
Neurodegenerative Disease Market Size and Share
Market Overview
| Study Period | 2020 - 2031 |
|---|---|
| Market Size (2026) | USD 63.21 Billion |
| Market Size (2031) | USD 88.83 Billion |
| Growth Rate (2026 - 2031) | 7.04 % |
| Fastest Growing Market | Asia Pacific |
| Largest Market | North America |
| Market Concentration | Medium |
Major Players *Disclaimer: Major Players sorted in no particular order Image © Mordor Intelligence. Reuse requires attribution under CC BY 4.0. | |
Neurodegenerative Disease Market Analysis by Mordor Intelligence
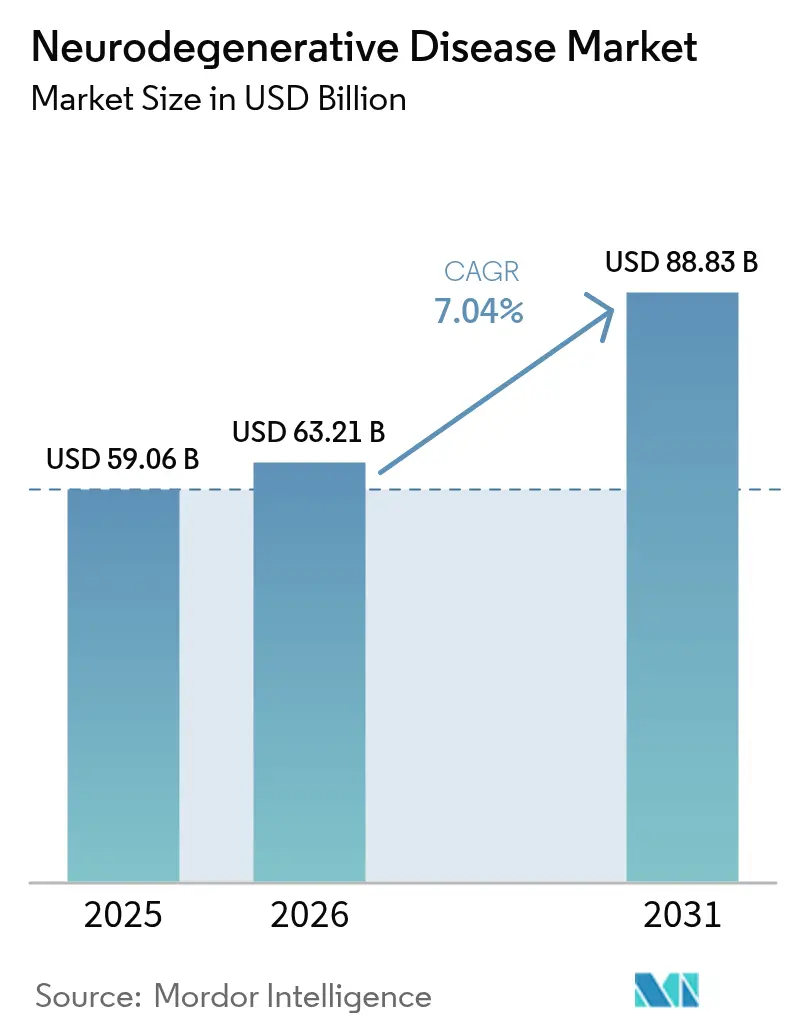
The Neurodegenerative Disease Market size is expected to grow from USD 59.06 billion in 2025 to USD 63.21 billion in 2026 and is forecast to reach USD 88.83 billion by 2031 at 7.04% CAGR over 2026-2031.
Robust demand is fuelled by an aging global population, fresh approvals for disease-modifying biologics, and sharper diagnostic tools that enable earlier intervention. Competitive pressure intensifies as incumbents defend blockbuster franchises while biotechnology newcomers push gene and RNA therapies toward late-stage trials. Payer appetite for premium pricing remains intact in the United States, yet parallel generic erosion in symptomatic drugs reshapes revenue mixes. Taken together, these forces put the neurodegenerative disease market on a durable growth path that balances near-term stability with long-term innovation. At the same time, Asia-Pacific governments are mandating nationwide dementia screening, spurring double-digit test volumes that lift reagent demand. Competitive intensity is escalating as AI-enabled discovery platforms compress target-identification timelines and draw venture capital toward niche, genetically defined indications.
Key Report Takeaways
- By indication, Alzheimer’s disease held 41.72% of the Neurodegenerative disease market share in 2025, while amyotrophic lateral sclerosis is projected to record a 9.36% CAGR through 2031.
- By drug class, cholinesterase inhibitors accounted for 27.98% share of the Neurodegenerative disease market size in 2025; gene and cell therapies are poised to grow at a 9.21% CAGR between 2026 and 2031.
- By molecule type, small-molecule drugs commanded 60.55% share in 2025, whereas RNA-based therapeutics show the fastest 9.14% CAGR outlook to 2031.
- By route of administration, oral formulations dominated with 76.88% share in 2025, and transdermal or intranasal delivery is forecast to expand at a 9.88% CAGR over the same period.
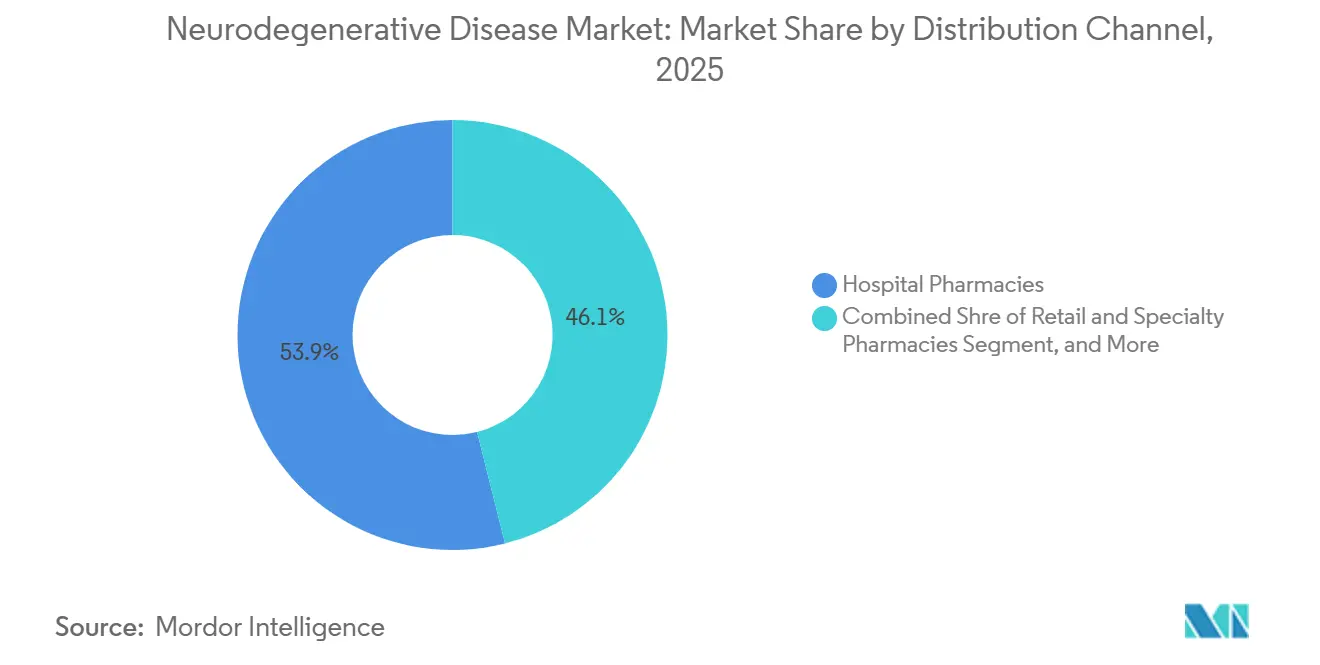
- By distribution channel, hospital pharmacies led with 53.92% share in 2025; online pharmacies are expected to advance at a 10.08% CAGR to 2031.
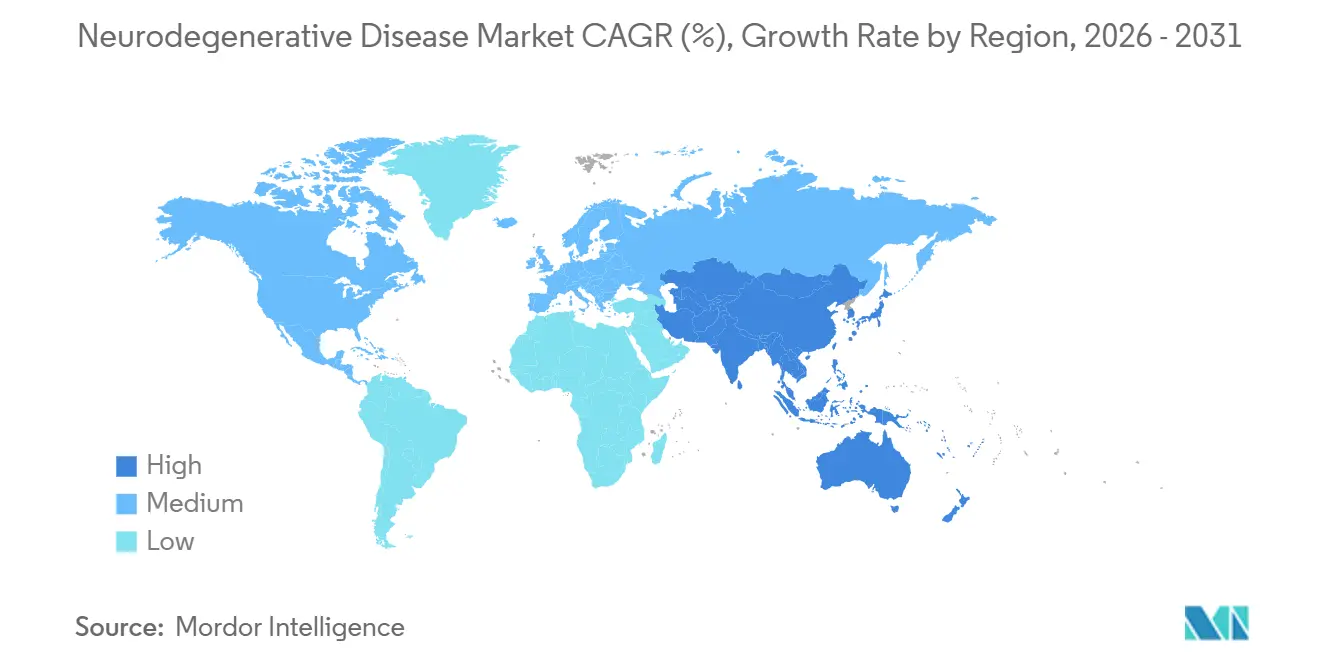
- By geography, North America generated 41.96% of revenue in 2025, while Asia-Pacific is on track for an 8.31% CAGR through 2031.
Note: Market size and forecast figures in this report are generated using Mordor Intelligence’s proprietary estimation framework, updated with the latest available data and insights as of 2026.
Market Trends and Insights
Drivers Impact Analysis of Neurodegenerative Disease Market*
| DRIVER | (~) % IMPACT ON CAGR FORECAST | GEOGRAPHIC RELEVANCE | IMPACT TIMELINE |
|---|---|---|---|
| Aging population escalating disease burden | +1.2% | Global, peak intensity in Japan, South Korea, Germany, Italy | Long term (≥ 4 years) |
| Launch and reimbursement of disease-modifying therapies | +1.5% | North America and Europe, expanding to Asia-Pacific | Medium term (2-4 years) |
| Advancements in neuro-imaging and blood-based biomarkers | +0.9% | North America and Europe, urban China and India | Medium term (2-4 years) |
| Expanding neuroscience R&D investments | +1.1% | United States, United Kingdom, Switzerland, China | Long term (≥ 4 years) |
| AI-enabled de-novo target discovery | +0.8% | North America and Europe, hubs in Singapore and Israel | Short term (≤ 2 years) |
| Brain-targeted delivery platforms | +0.7% | North America and Europe, trial sites in Australia and Japan | Medium term (2-4 years) |
| Source: Mordor Intelligence | |||
Aging Population Escalating Disease Burden
People aged 65 and older will comprise 16.5% of the world’s population by 2030, with Japan already at 29.1% in 2024.[1]U.S. Food & Drug Administration, “Biomarker Qualification for Neurodegenerative Diseases,” fda.gov National health-care systems are responding with community screening mandates; Japan began compulsory annual cognitive checks for citizens over 75 in April 2025, channeling roughly 1.2 million residents into diagnostic pathways that rely on plasma p-tau assays before costly PET imaging.[2]National Institutes of Health, “ClinicalTrials.gov Trends in Neurodegenerative Trials,” clinicaltrials.gov South Korea enacted a parallel program in January 2026, while German insurers started reimbursing plasma p-tau217 in November 2025. Rising prevalence drives payer willingness to fund early intervention, a strategy supported by Alzheimer’s Disease International, which reported dementia-related costs exceeding USD 1.3 trillion in high-income countries during 2024.
Launch and Reimbursement of Disease-Modifying Therapies
The 2024 approvals of donanemab and subcutaneous lecanemab shifted commercial narratives from symptom relief to disease alteration. Their launch proved payers will reimburse high-cost biologics when evidence shows amyloid plaque clearance and cognitive stabilization. More than 15 additional anti-amyloid or anti-tau antibodies now populate Phase III pipelines, signaling a therapeutic arms race. Biogen, Roche, and Johnson & Johnson deploy adaptive trial designs and fluid biomarker surrogate endpoints to shorten development timelines. Investor confidence surges, with neuroscience IPO proceeds rising despite macro uncertainty. Over the medium term, combination regimens pairing antibodies with small-molecule anti-inflammatories are expected to widen clinical benefit windows, further enlarging revenue opportunities across the neurodegenerative disease market.
Full FDA approvals for Eisai’s lecanemab in July 2024 and Eli Lilly’s donanemab in October 2024 validated the anti-amyloid class after showing 27% and 35% cognitive-decline slowing, respectively. Japan’s PMDA approved lecanemab in September 2024 and set annual reimbursement at JPY 2.98 million (USD 20,100) three months later.
Advancements In Neuroimaging and Biomarker Diagnostics
Precision diagnostics underpin personalized treatment algorithms. Amyloid PET, CSF p-tau assays, and emerging plasma-based tests enable stratification of preclinical populations, lifting trial success odds and facilitating earlier prescribing. Lantheus’ 2024 acquisition of Life Molecular Imaging secured proprietary tracers that now integrate into commercial treatment pathways. Diagnostic reimbursement codes expand in the United States, while Europe adopts joint clinical-assessment frameworks to streamline coverage decisions. Plasma p-tau217 reached 89% sensitivity and 91% specificity for Alzheimer’s pathology in a 2024 Lancet Neurology study.[3]Biotechnology Innovation Organization, “Clinical Development Success Rates,” bio.org Roche launched its CE-marked Elecsys p-tau181 test in January 2025 at roughly USD 150, one-tenth the cost of amyloid-PET.
Expanding Neuroscience R&D Investments
Roche’s USD 50 billion commitment through 2030 exemplifies the sector’s massive capital influx. Similar, though smaller, pledges by Eli Lilly, Novartis, and Takeda concentrate on biologics manufacturing and AI-enabled target discovery. Venture capital funding rebounds after a 2024 dip, emphasizing platform technologies such as protein degraders and gene-editing modalities. Academic-industry consortia proliferate, pooling datasets and accelerating IND filings. Governments weigh in through tax incentives and expedited pathways, underscoring neuroscience as a strategic research frontier. Eli Lilly allocated USD 3.2 billion to new neuroscience programs and, in July 2023, acquired Versantis Bio for USD 1.9 billion to repurpose bimagrumab for Parkinson's-related sarcopenia. Pennsylvania earmarked USD 5 million for neurodegenerative research in December 2025, while Ireland’s FutureNeuro committed EUR 17.9 million in May 2024 to chronic-disease diagnostics.
Restraints Impact Analysis of Neurodegenerative Disease Market*
| RESTRAINT | (~) % IMPACT ON CAGR FORECAST | GEOGRAPHIC RELEVANCE | IMPACT TIMELINE |
|---|---|---|---|
| High attrition rates in late-stage trials | -1.3% | Global, highest in North America and Europe | Medium term (2-4 years) |
| Premium pricing of advanced therapies | -0.9% | Global, acute in United States, mitigated in Europe | Short term (≤ 2 years) |
| Limited biomarker infrastructure | -0.6% | Latin America, Middle East, Africa, rural Asia-Pacific | Long term (≥ 4 years) |
| Viral-vector manufacturing bottlenecks | -0.8% | Global, affecting launches in North America, Europe, Japan | Medium term (2-4 years) |
| Source: Mordor Intelligence | |||
Patent Expirations of Key Neurology Brands
Eli Lilly terminated zagotenemab in December 2024, writing off USD 1.2 billion after missing cognitive endpoints. Roche ended its gantenerumab Alzheimer’s prevention study in March 2024 on the grounds of futility. Regulators now allow surrogate endpoints, but confirmatory trials must prove clinical benefit within nine years, compressing commercialization windows.
Aricept’s loss of exclusivity in 2026 erases USD 2.8 billion in branded revenue, triggering price compression across generic donepezil competitors. Similar erosion hits Namzaric by 2029, overlapping with premium launches of antibodies and gene therapies. Portfolio managers hedge by layering life-cycle extensions, fixed-dose combos, new delivery systems, and OTC switches, but margin dilution remains inevitable. Emerging markets, where intellectual property enforcement lags, see even steeper price declines, challenging multinational revenue-recapture strategies. This constraint suppresses near-term top-line growth while nudging firms to accelerate higher-value innovation, thereby indirectly sustaining the broader neurodegenerative disease market.
Premium Pricing of Advanced Biologics & Gene Therapies
Lecanemab lists at USD 26,500 per year, and donanemab is expected to cost near USD 32,000, swelling Medicare Part B spending by 38% between 2023 and 2024. Novartis’ Zolgensma commands USD 2.1 million per patient; outcomes-based contracts tie payments to motor milestones. Germany negotiated a 12% discount on lecanemab in May 2025, linking price to real-world evidence of benefit beyond 18 months.
*Our forecasts treat driver/restraint impacts as directional, not additive. The impact forecasts reflect baseline growth, mix effects, and variable interactions.
Neurodegenerative Disease Market Segment Analysis
By Indication:
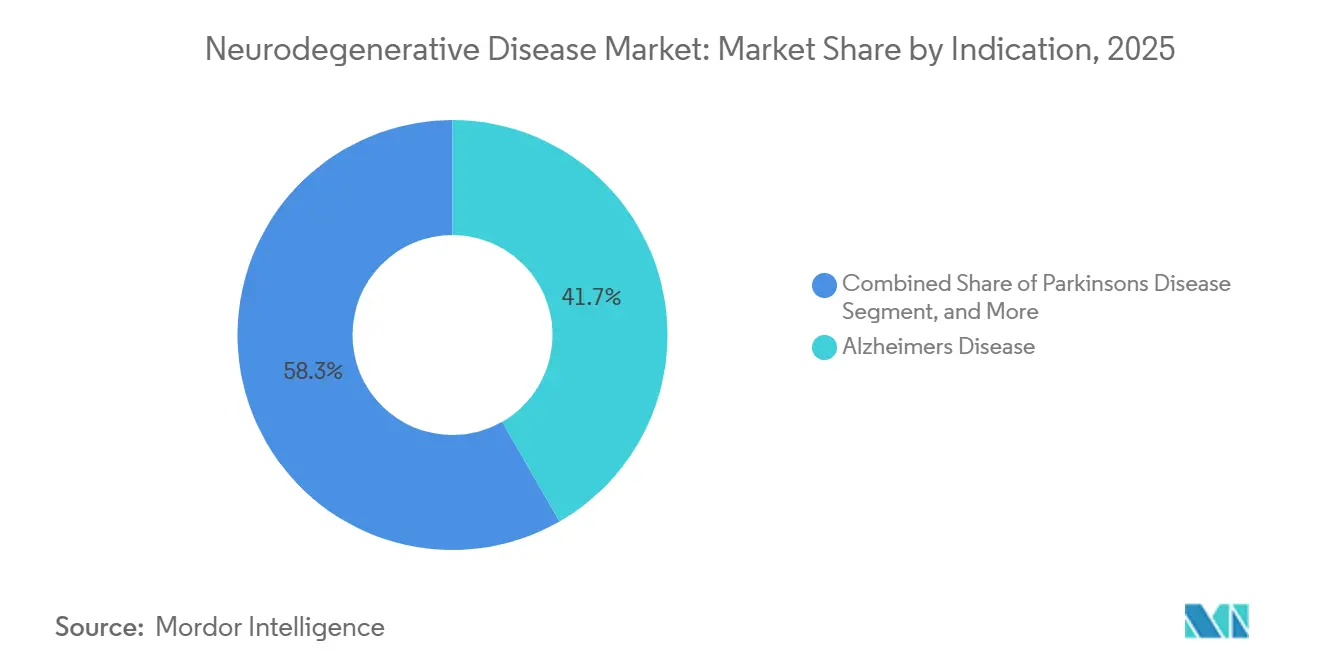
Alzheimer’s Disease Dominates Despite ALS GrowthAlzheimer’s disease commanded 41.72% of the neurodegenerative disease market share in 2025, buoyed by high prevalence and multiple labeled therapies. The 2025 surge in Leqembi revenue, topping JPY 23.1 billion (USD 154 million), reaffirmed commercial headroom for disease-modifying antibodies. Parkinson’s and multiple sclerosis sustain volume through entrenched dopaminergic and immunomodulatory regimens, yet incremental innovation remains slower. ALS, albeit small, posts a 9.36% CAGR, supported by gene-silencing candidates and expanded newborn-screening programs. Huntington’s benefits from Pridopidine’s European nod, adding a tangible disease-modifying option for the first time. Over the forecast, Alzheimer’s still anchors the neurodegenerative disease market, but diversified revenue flow from rare indications mitigates concentration risk.
A second layer of growth emerges as regulators widen accelerated-approval eligibility to lysosomal storage diseases with neurodegenerative components. Denali’s tividenofusp alfa breakthrough tag illustrates this trend, channelling capital toward previously neglected orphan indications. Collectively, these shifts broaden the therapeutic canvas, raising the ceiling for total neurodegenerative disease market size and creating cross-segment synergies in biomarker standardization.



By Drug Class:
Cholinesterase Inhibitors Anchor, Gene Therapies AscendCholinesterase inhibitors accounted for 27.98% of the neurodegenerative disease market in 2025, reflecting entrenched first-line use. Yet pipeline velocity now favors gene and cell therapies, which are set to grow 9.21% annually as vector design and manufacturing scale improve. Solid Biosciences’ SGT-212 clearance for Friedreich ataxia validates systemic AAV delivery for neuro-cardiac phenotypes, opening paths to adjacent forms of ataxia. Meanwhile, monoclonal antibodies extend beyond amyloid to target alpha-synuclein and TDP-43, supported by learnings in dosing optimization. NMDA antagonists and dopamine agonists remain staples but face generic exposure; sponsors defend share through long-acting injectables and digital adherence tools. RNA therapeutics occupy a strategic middle ground, with lower COGS than biologics and greater specificity than small molecules, further fragmenting drug-class leadership in the neurodegenerative disease market.
By Molecule Type:
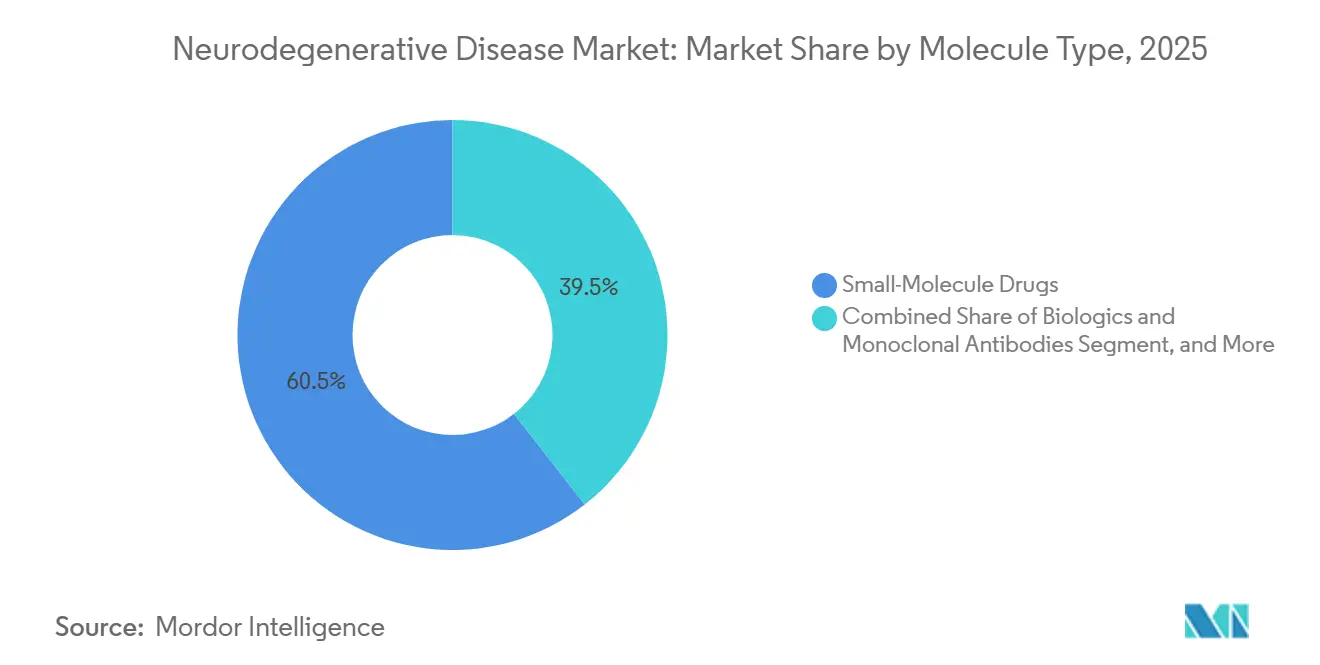
Small Molecules Lead, RNA Therapeutics Gain TractionSmall molecules retained 60.55% share in 2025, sustained by oral preference and mature supply chains. However, antisense oligonucleotides and siRNA platforms are predicted to post 9.14% CAGR, and they benefit from chemical modifications that extend dosing intervals to quarterly or bi-annual regimens. Ionis and Alnylam showcase proof-of-concept in spinal muscular atrophy and ATTR amyloidosis; lessons transfer into Parkinson’s and Huntington’s, reducing clinical risk. Biologics, including bispecific antibodies, expand via subcutaneous reformulations that cut infusion times and site-of-care costs. Meanwhile, hybrid constructs - antibody-RNA conjugates - blur category lines and demand nuanced regulatory guidance.
Manufacturing investments focus on modular, single-use bioreactors adaptable to both viral vectors and mRNA payloads. Such flexibility lowers capex per campaign, encouraging broader experimentation across molecule types and sustaining innovation-led growth in the neurodegenerative disease market.
By Route of Administration:
Novel Delivery Gains TractionOral dosing dominated with 76.88% share in 2025, but patient and caregiver surveys reveal growing acceptance of minimally invasive alternatives once clinical benefit is demonstrated. Intranasal glutathione and transdermal rotigotine pilot programs record high adherence, validating 9.88% CAGR forecasts for these routes. Regulatory agencies expedite device-drug combination reviews, recognizing unmet needs in motor-symptom fluctuation control. Subcutaneous antibody auto-injectors halve clinic-time burden, enlarging eligible patient pools and smoothing supply chain logistics. Focused-ultrasound-mediated BBB openings remain experimental but show potential for periodic, non-systemic gene-editing payload delivery. Collectively, route innovation diversifies delivery choices and enhances the patient-centricity of the neurodegenerative disease industry.
By Distribution Channel:
Digital Transformation AcceleratesHospital pharmacies controlled 53.92% of the neurodegenerative disease market share in 2025 as initiation protocols for antibodies and gene therapies demand specialist oversight. Yet telemedicine proliferation propels online pharmacy CAGR to 10.08%, with e-prescription integrations enabling direct-to-home fulfilment for maintenance dosing. Specialty pharmacies fortify cold-chain capacity and deploy nurse-led adherence programs; CareMed’s alliance with Eisai typifies such models. Retail chains upgrade consultation rooms for in-store cognitive testing, bridging diagnosis and dispensing. Payers pilot value-based contracts tied to digital-biomarker outcomes uploaded via patient apps, further embedding tech into distribution workflows. This omni-channel evolution underpins an increasingly accessible neurodegenerative disease market.
Geography Analysis
North America Neurodegenerative Disease Market
North America accounted for 41.96% of worldwide revenue in 2025, as the FDA’s accelerated approval pathway and Medicare reimbursement are driving rapid uptake of novel biologics. Breakthrough tags for posdinemab and tividenofusp alfa in January 2025 exemplify regulatory agility. Venture capital funnels toward Boston and San Francisco hubs, while Roche’s USD 50 billion U.S. expansion secures domestic biologics capacity. Canada broadens early-access programs, and Mexico leverages near-shoring to attract packaging operations, creating a contiguous North American supply ecosystem that boosts the neurodegenerative disease market.
APAC Neurodegenerative Disease Market
Asia-Pacific holds the fastest 8.31% CAGR outlook through 2031. Japan’s rapid adoption of Leqembi set a regional precedent for reimbursing expensive antibodies despite budget scrutiny. China is accelerating NDA reviews through its priority-review channel, with local firms co-developing biosimilars and RNA therapies to lower entry prices. South Korea funds AI-guided screening tools, and Australia integrates genomic testing into public health benefits. Collectively, infrastructure expansion and policy harmonization expand patient access and diversify revenue drivers within the neurodegenerative disease market.
Europe Neurodegenerative Disease Market
Europe posts steady growth anchored by EMA’s centralized procedures that balance risk and access. The agency’s Pridopidine reversal signals an openness to re-evaluation based on post-hoc analyses. Germany, France, and the United Kingdom remain premium markets but negotiate outcome-based rebates to contain spending. Southern Europe increases deployment of regional dementia plans co-funded by EU cohesion funds, supporting earlier diagnosis and slowing disease progression. While differing national HTA assessments fragment launch sequencing, collective purchasing through EU4 consortia mitigates pricing gaps and sustains the continental contribution to the neurodegenerative disease market.

Regulatory Landscape
Regulatory pathways for neurodegenerative therapies continue to emphasize expedited development with tighter expectations around biomarkers, patient stratification, and confirmatory evidence. In the United States, the FDA reinforced fit-for-purpose development planning for serious, high-unmet-need neurological conditions through guidance, including its April 2024 guidance for amyotrophic lateral sclerosis drug development, and a March 2026 draft guidance on New Approach Methodologies (NAMs) that describes how non-animal methods can be qualified and used to support regulatory decision-making.
In Europe, the EMA continues to tighten standardization for dementia trials through updated scientific guidance for Alzheimer’s disease and other dementias, while applying more explicit benefit-risk and population-definition requirements. The July 2025 EMA outcome after re-examination for Kisunla (donanemab) underscored defined eligible populations and evidentiary thresholds. In parallel, EU institutions have been progressing a broad pharmaceutical legislation reform package, with compromise texts published in March 2026 that include revised data protection constructs and additional obligations intended to improve continuity of supply across member states, shaping launch planning and post-authorization responsibilities.
Competitive Landscape
Market structure remains moderately concentrated, with top multinationals leveraging patent estates and distribution muscle, yet no single firm exceeds a one-third share. Biogen, Roche, Eli Lilly, Eisai, and Novartis collectively hold an estimated 62% of branded revenue, leaving ample headroom for venture-backed entrants. Strategic alliances dominate deal flow, typified by Biogen–Neomorph’s USD 1.45 billion protein-degrader pact and Novartis–BioAge’s USD 530 million longevity collaboration. M&A activity rebounded with AbbVie’s USD 8.7 billion Cerevel take-out and Johnson & Johnson’s USD 14.6 billion Intra-Cellular Therapies acquisition, reflecting appetite for de-risked Phase II assets.
Emerging platforms leverage AI to unearth novel targets and accelerate chemistry workflows, challenging incumbents’ scale advantage. Solid Biosciences’ FDA clearance and Annovis Bio’s phase-3 acceptance underscore regulators’ willingness to green-light smaller sponsors with compelling science. Meanwhile, big pharma diversifies into diagnostics and digital health to lock in end-to-end value capture, as shown by Lantheus’ imaging play and Eli Lilly’s tele-health rollout. Overall, dynamic collaboration, selective consolidation, and cross-sector convergence define competitive choreography within the neurodegenerative disease market.
Neurodegenerative Disease Industry Leaders
Boehringer Ingelheim International GmbH
UCB SA
Novartis AG
Merck & Co Inc.
Teva Pharmaceuticals, Inc.
- *Disclaimer: Major Players sorted in no particular order

Neurodegenerative Disease Market Companies Covered in this Report
- Abbvie
- AC Immune SA
- Alector, Inc.
- Amneal Pharmaceuticals
- Annovis Bio
- Athira Pharma
- Biogen
- Biohaven Pharmaceuticals
- Boehringer Ingelheim
- Denali Therapeutics
- Eisai
- Eli Lilly and Company
- Roche
- H. Lundbeck
- Ionis Pharmaceuticals
- Johnson & Johnson Services, Inc. (Janssen)
- Merck
- Neuron23 Inc.
- Novartis Inc
- Oryzon Genomics
- Pfizer
- Prothena
- Revance Therapeutics, Inc.
- Sanofi
- Seelos Therapeutics
- Solid Biosciences Inc.
- Teva Pharmaceutical Industries
- UCB
- Vertex Pharmaceuticals

Market Opportunities and Future Outlook
Adoption of therapies and diagnostics is shifting toward earlier and more scalable care pathways, creating opportunities in biomarker-enabled screening, higher-throughput diagnostics, and differentiated administration formats that reduce site-of-care burden. A concrete signal is the July 2026 FDA approval of Eisai’s supplemental filing for LEQEMBI IQLIK (lacanemab-irmb) subcutaneous injection as an initiation dose for early Alzheimer’s disease, which supports broader outpatient initiation models and expands the addressable service ecosystem around infusion alternatives, specialty pharmacy coordination, and adherence programs.
Pipeline breadth and funding mechanisms also support whitespace in rare and orphan neurodegenerative disorders, alongside platform approaches aimed at shared mechanisms such as protein misfolding. In January 2026, ARPA-H launched the BIOGAMI program focused on early detection and intervention for protein misfolding in neurodegenerative diseases, strengthening the translational pipeline for novel modalities and enabling partnerships around assays, data infrastructure, and intervention strategies. On the regulatory and commercialization front, the EMA’s January 2026 marketing authorization for Aqneursa to treat neurological symptoms of Niemann-Pick type C disease adds another reference point for advancing therapies in smaller, genetically defined populations where trial design, endpoints, and patient identification remain execution levers.
Recent Industry Developments in Neurodegenerative Disease Market
- July 2026: The FDA approved Eisai’s supplemental Biologics License Application for LEQEMBI IQLIK (lacanemab-irmb) subcutaneous injection as an initiation dose for early Alzheimer’s disease. The update broadens administration flexibility and strengthens the case for moving parts of disease-modifying therapy initiation into lower-acuity settings supported by specialty distribution and monitoring services.
- June 2026: UCB completed its acquisition of Neurona Therapeutics for about USD 1.2 billion, adding the cell therapy candidate NRTX-1001 for epilepsy. The transaction adds to UCB’s CNS pipeline and indicates continued willingness among large biopharma to use M&A to access differentiated, platform-like neurotherapeutic modalities.
- December 2024: Lantheus completed its acquisition of Life Molecular Imaging for about USD 1.27 billion, expanding its neuroimaging portfolio. The deal improves access to proprietary PET tracers that support amyloid-pathology confirmation and treatment selection workflows, tightening links between diagnostics and therapy adoption in neurodegenerative care pathways.


Neurodegenerative Disease Market Report Scope and Research Methodology
Market Definition and Coverage
For this methodology, the neurodegenerative disease market is measured as the global revenue from prescription therapeutics used to manage neurodegenerative conditions across the patient journey, counted at manufacturer level and reported in current US dollars.
Scope exclusions: This sizing excludes diagnostics, medical devices, and non-drug care services that are sometimes grouped into broader neurology or care delivery spend.
Segments Covered in This Report
- By Indication
- Parkinsons Disease
- Alzheimers Disease
- Amyotrophic Lateral Sclerosis (ALS)
- Multiple Sclerosis
- Huntington Disease
- Frontotemporal Dementia
- Spinal Muscular Atrophy (SMA)
- Other Rare Neurodegenerative Disorders
- By Drug Class
- NMDA Receptor Antagonists
- Cholinesterase Inhibitors
- Dopamine Agonists
- Immunomodulators / Monoclonal Antibodies
- Gene & Cell Therapies
- Antisense Oligonucleotides & RNAi
- Other Drug Classes
- By Molecule Type
- Small-Molecule Drugs
- Biologics & Monoclonal Antibodies
- RNA-based Therapeutics
- Others
- By Route of Administration
- Oral
- Parenteral (IV/SC)
- Transdermal/Intranasal
- Intrathecal Delivery
- Focused-Ultrasound Mediated Delivery
- By Distribution Channel
- Hospital Pharmacies
- Retail & Specialty Pharmacies
- Online Pharmacies
- By Geography
- North America
- United States
- Canada
- Mexico
- Europe
- Germany
- United Kingdom
- France
- Italy
- Spain
- Rest of Europe
- Asia-Pacific
- China
- India
- Japan
- Australia
- South Korea
- Rest of Asia-Pacific
- Middle East and Africa
- GCC
- South Africa
- Rest of Middle East and Africa
- South America
- Brazil
- Argentina
- Rest of South America
- North America
Data Sources, Market Sizing, and Validation
Desk Research
Desk research is used to set the clinical and commercial frame before we build the model, so the math stays tied to real treated patients and real product availability. We rely on public health and epidemiology sources such as the World Health Organization (WHO), the US Centers for Disease Control and Prevention (CDC), and national health agencies for prevalence, age mix, and disease burden signals.
To cross-check treatment patterns and access, we also review sources such as the US FDA and the European Medicines Agency (EMA) for approvals and label scope, along with peer-reviewed journals for changes in standard of care and persistence assumptions. For market structure and company exposure, we use company filings, annual reports, investor presentations, and reputable press coverage, supported by paid subscriptions used for company financials and intelligence, news and financials, and patent databases when needed. These desk sources are illustrative and not exhaustive, and additional public references are used for data collection, validation, and clarification.
Primary Interviews and Surveys
Primary work is used to pressure-test assumptions that cannot be read directly from public data, especially treated share, product mix shifts, and pricing direction by geography. We speak with a balanced set of stakeholders such as neurologists, hospital and retail pharmacists, payers, distributors, and industry executives across APAC, EMEA, and the Americas, and then we reconcile the inputs back to the desk model to close gaps and confirm the final outputs.
Distribution of primary research fieldwork respondents
| Company type | Respondent position | Region |
|---|---|---|
| Top tier: 39% | CXOs: 19% | APAC: 37% |
| Mid tier: 42% | Functional/Unit leaders: 30% | EMEA: 37% |
| Smaller Players: 19% | Managers: 51% | Americas: 26% |
Market-Sizing & Forecasting
Sizing is anchored in a top-down demand pool build where epidemiology and diagnosis rates are translated into an addressable treated population, and then converted into value using therapy mix and pricing. Because country-level data quality varies, we check the results with selective bottom-up approximations such as sampled product level revenue build-ups, channel checks on volume direction, and average selling price (ASP) times estimated patient counts, which are used to adjust totals when they do not reconcile.
Key inputs that move the model include disease prevalence and aging trend, diagnosis and specialist access rates, treated share and adherence patterns, therapy class mix, branded versus generic split, and reimbursement or formulary tightening that can change uptake. We also track approval timelines and label expansions, since new launches or broader eligibility can shift both volume and price realization.
For forecasting, scenario analysis is used to reflect different adoption speeds for newer therapies, alongside ARIMA style smoothing for stable components where historic growth is steadier. Where bottom-up checks are incomplete, gaps are handled by using proxy countries with similar care pathways and then scaling by population, access, and per patient spending signals validated through interviews.
Data Validation & Update Cycle
Outputs are validated through multiple steps that compare the final number against independent signals such as neurology drug spend direction, therapy class growth rates, and region-level access changes discussed by experts. When a country or class shows a sharp jump or dip, we recheck the inputs, revisit assumptions, and trigger follow-up calls to confirm whether the shift is real or data-driven.
Before sign-off, the model and key assumptions go through an analyst review pass so unit logic, currency treatment, and regional roll-ups remain consistent. Reports are refreshed annually, and material events such as major approvals, safety updates, or pricing policy changes can lead to interim revisions. Right before delivery, a fresh update pass is done so clients receive the latest view available.
Mordor Intelligence's Neurodegenerative Disease Market Estimate Compared With Other Published Estimates
Published market sizes for neurodegenerative disease can differ even when the topic name looks similar, because each study draws the line around what is counted and which revenue streams are included. Differences also show up when assumptions for treated share, therapy mix, and price realization are handled in different ways.
The main gap comes from whether the market is limited to prescription therapeutics or widened to include diagnostics, devices, and care services, and then the totals change quickly. In Mordor Intelligence calculations, only drug revenues tied to neurodegenerative indications are counted, and broader diagnostic and patient care revenues are kept outside the model even if they relate to the same patients.
Benchmark comparison
| Source | Market Size | Gaps in Research Methodology |
|---|---|---|
| Mordor Intelligence | USD 63.21 B (2026) | |
| Industry Publisher A | USD 62.59 B (2026) | Uses a wider revenue frame that can include diagnostics, devices, and care services, and also reports values at factory gate which can shift totals depending on channel structure. |
| Global Consultancy B | USD 61.93 B (2024) | Anchors on a different base year and may apply different treated share and pricing progression assumptions by region, which can move the starting point before the forecast is built. |
Across the three figures, the spread is mainly explained by what gets included beyond prescription drugs and how base years and pricing logic are set. By keeping the definition tied to treated therapeutics revenues and cross-checking assumptions with direct stakeholder inputs, the final estimate stays easier to replicate and interpret across regions.


Key Questions Answered in the Report
How large is the Neurodegenerative disease market in 2026?
It reached USD 63.21 billion in 2026 and is projected to climb to USD 88.83 billion by 2031.
Which indication dominates sales?
Alzheimer’s disease leads with 41.72% share of global revenue in 2025.
What is the fastest-growing region between 2026 and 2031?
Asia-Pacific is forecast to expand at an 8.31% CAGR due to aging demographics and improved access.
Are gene therapies gaining traction?
Yes, gene and cell therapies are the fastest-growing drug class with a projected 9.21% CAGR.
How are digital channels affecting drug distribution?
Online pharmacies show a 10.08% CAGR as telemedicine and e-prescriptions improve access to complex therapies.
What keeps late-stage failure rates high?
Biological complexity and difficulty in measuring clinical endpoints drive Phase III attrition rates above 85%.
Page last updated on:


 Your data is secure and never sold or shared.


