Aerospace And Defense Biometrics Market Size and Share
Market Overview
| Study Period | 2019 - 2030 |
|---|---|
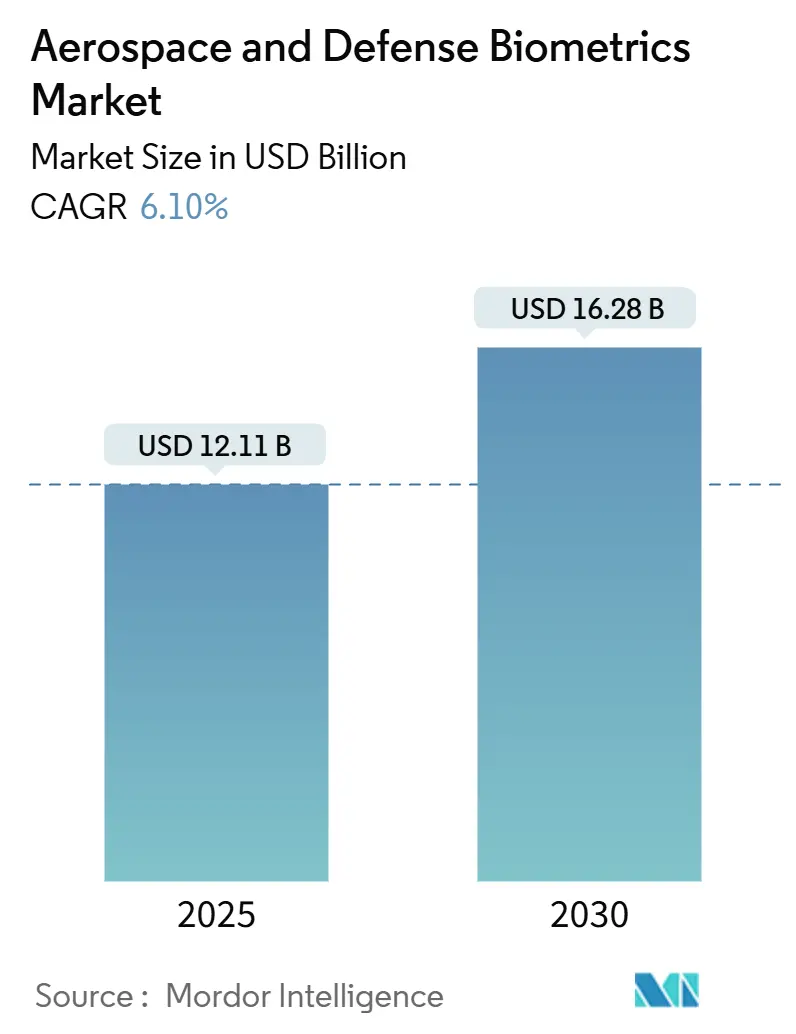
| Market Size (2025) | USD 12.11 Billion |
| Market Size (2030) | USD 16.28 Billion |
| Growth Rate (2025 - 2030) | 6.10% CAGR |
| Fastest Growing Market | Asia Pacific |
| Largest Market | North America |
| Market Concentration | Medium |
Major Players *Disclaimer: Major Players sorted in no particular order Image © Mordor Intelligence. Reuse requires attribution under CC BY 4.0. | |
Aerospace And Defense Biometrics Market Analysis by Mordor Intelligence
The aerospace and defense biometric market generated a size of USD 12.11 billion in 2025 and is projected to reach USD 16.28 billion by 2030, translating into a 6.1% CAGR across the forecast horizon. Budget expansions at major defense ministries, the transition from single-factor checks to multi-modal authentication, and the integration of biometrics into zero-trust cyber frameworks underpin this trajectory.[1]Source: NATO, “NATO Countries Increase Defense Spending by 11% in 2024,” nato.int Interoperable solutions that authenticate personnel on the ground, in orbit, and across coalition networks are now baseline requirements. Contactless modalities are favored for crews operating in protective gear, while on-device artificial intelligence (AI) mitigates connectivity gaps common to satellite links. Program spending in NATO countries and India’s USD 75 billion modernization drive signal long-term demand for systems that can withstand extreme climates, radiation, and electronic counter-measures. Supply-chain reinforcement, exemplified by the US Department of Defense (DoD)’s USD 2.3 billion rare-earth diversification fund, helps vendors secure sensor inputs critical to next-generation payloads.[2]Source: U.S. Department of Defense, “DoD Announces $2.3 Billion Investment in Rare Earth Supply Chain Diversification,” defense.gov
Key Report Takeaways
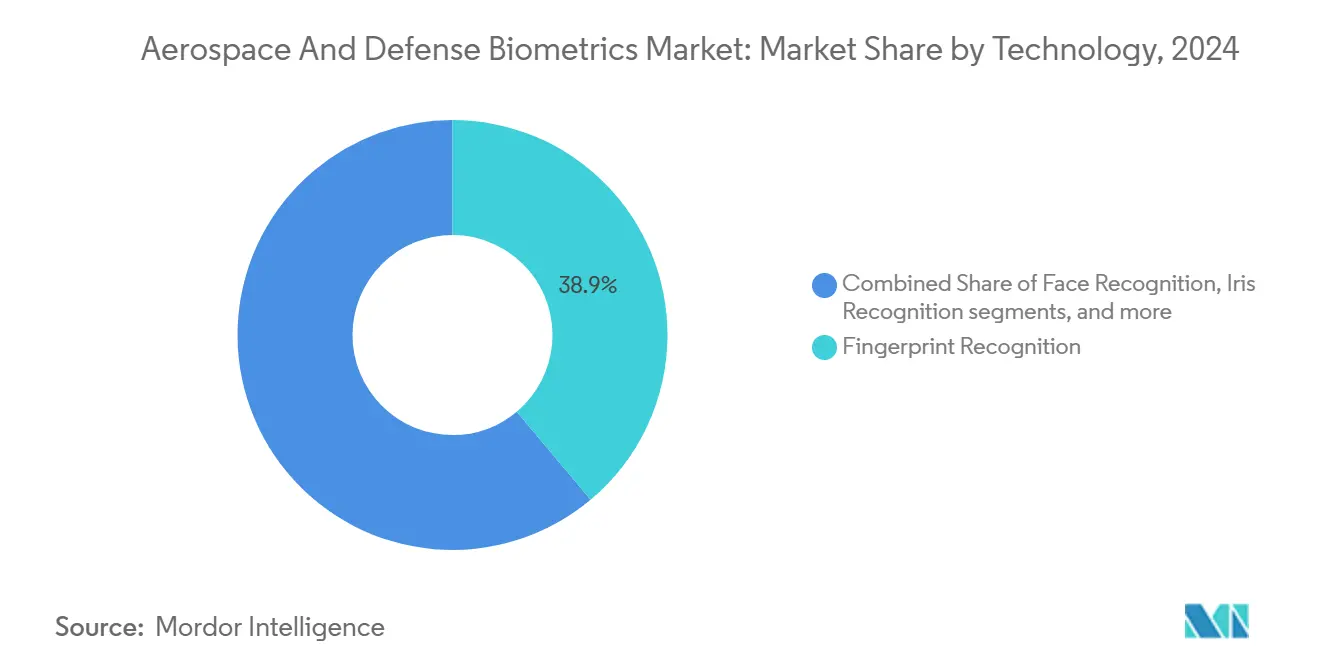
- By technology, fingerprint recognition held 38.90% of the aerospace and defense biometric market share in 2024, whereas iris recognition is advancing at an 8.32% CAGR through 2030.
- By component, hardware dominated 2024 revenue with 53.65%, but services are forecast to expand at a 7.65% CAGR due to integration and maintenance contracts.
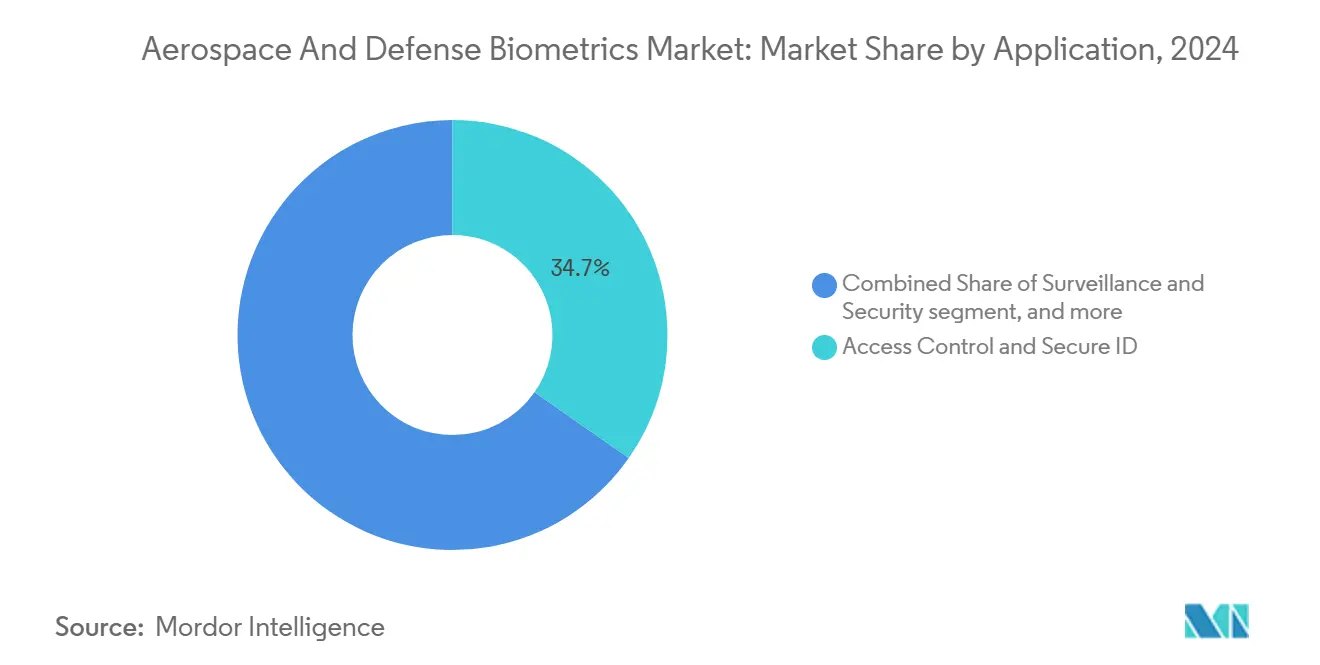
- By application, access control led with 34.70% revenue share in 2024, while payment systems are projected to compound at 8.32% CAGR to 2030.
- By end user, the military and defense segment controlled 39.50% of 2024 spending; the space end user segment is set to rise fastest at 8.65% CAGR through 2030.
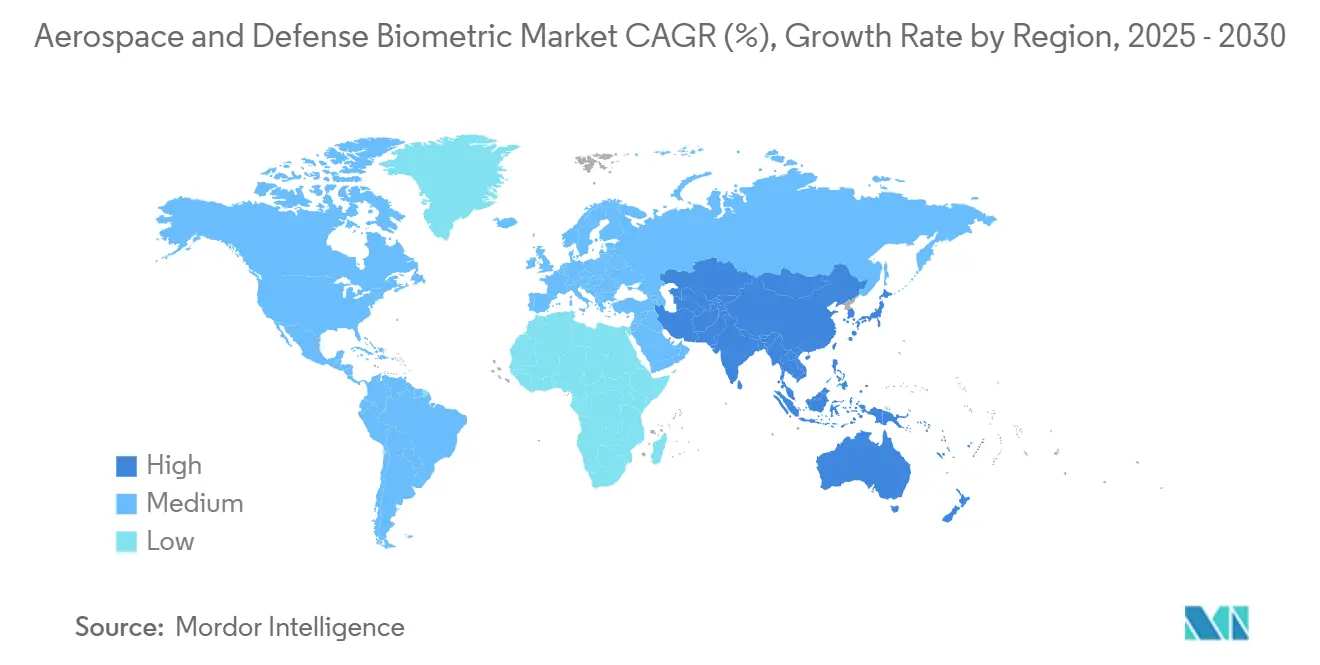
- By region, North America commanded 40.20% revenue in 2024, yet Asia-Pacific is on track for the highest regional CAGR of 8.12% to 2030.
Global Aerospace And Defense Biometrics Market Trends and Insights
Drivers Impact Analysis*
| Driver | (~)% Impact on CAGR Forecast | Geographic Relevance | Impact Timeline |
|---|---|---|---|
| Rising adoption of biometric-enabled e-gates and seamless travel programs | +1.2% | Global, with concentration in North America and EU | Medium term (2-4 years) |
| Surge in defense spending on soldier digital ID and access control | +1.8% | NATO countries, APAC defense modernization markets | Long term (≥ 4 years) |
| Growing need for secure immigration and border surveillance | +0.9% | North America, EU, Middle East border regions | Short term (≤ 2 years) |
| Integration of biometrics with zero-trust defense cyber-architectures | +1.1% | Global, led by US federal mandate compliance | Medium term (2-4 years) |
| On-device AI for crew health and authentication in spacecraft | +0.7% | Space-faring nations: US, EU, China, India, Japan | Long term (≥ 4 years) |
| NATO-driven interoperable biometric data-sharing mandates | +0.4% | NATO member countries, allied partnerships | Long term (≥ 4 years) |
| Source: Mordor Intelligence | |||
Rising Adoption of Biometric-Enabled E-Gates and Seamless Travel Programs
Airports now cut passenger processing from 3-5 minutes to roughly 25 seconds by deploying multi-modal e-gates. Vision-Box’s 150-plus gates across Indonesia handled over 6 million travelers in 2024, proving industrial-scale viability.[3]Source: Vision-Box, “Vision-Box Deploys 150+ E-gates in Indonesia,” vision-box.com Facial recognition accuracy surpassing 99% at Helsinki Airport confirms that performance can align with European privacy rules. Countries in the Middle East and Southeast Asia increasingly view e-gates as leapfrog security assets and symbols of technological status. Adoption cycles are accelerated because integration often requires no overhaul of point-of-sale or passenger service systems. Dual-mode gates that blend facial and iris scans are installed at civilian airports servicing military flights to ensure a common credentialing backbone.
Surge in Defense Spending on Soldier Digital ID and Access Control
Collective NATO budgets climbed 11% in 2024, with identity-centric projects high on the spending docket. The US Army’s USD 249 million award to Leidos prioritizes biometric gatekeepers at bases worldwide. Ruggedized scanners now capture prints through gloves, and face engines tolerate helmets and night-vision gear. Continuous biometric hand-offs between portable radios, tactical networks, and command systems ensure personnel authentication even in comms-denied settings. Demand for modular kits adaptable to land, maritime, and airborne platforms positions service providers for recurring upgrade revenue over 10-year lifecycles.
Growing Need for Secure Immigration and Border Surveillance
Satellite-linked biometric watchlists extend identity checks far beyond fixed border posts. Frontex integrates facial analytics with Earth-observation feeds to flag anomalous crossings on Europe’s external frontier. Mobile units operated by US Customs and Border Protection processed 2.3 million encounters in 2024, demonstrating the field-ready scalability of iris systems. Behavioral analytics embedded inside biometric engines now weigh gait or micro-expression cues to elevate or dismiss alerts, shrinking operator workload. Governments see the linkage of satellite reconnaissance and biometric identification as the logical evolution of perimeter security.
Integration of Biometrics with Zero-Trust Defense Cyber-Architectures
Executive Order 14028 obliges every US federal agency to retire implicit-trust models. The Cybersecurity and Infrastructure Security Agency’s maturity framework lists multi-factor biometric gates as a core pillar. Continuous verification observes user behavior, device posture, and bio-signals throughout a session instead of a single log-on. This is critical for satellite control rooms where operators manage constellations for hours. Classified enclaves install offline biometric modules so zero-trust principles survive even air-gapped conditions. Vendors with Common Criteria-certified algorithms and SECRET-level cleared staff win disproportionately in this procurement environment.
Restraints Impact Analysis*
| Restraint | (~)% Impact on CAGR Forecast | Geographic Relevance | Impact Timeline |
|---|---|---|---|
| Privacy and data-protection compliance burdens | -0.8% | EU (GDPR), California (CCPA), global privacy regulations | Short term (≤ 2 years) |
| Retrofit costs for legacy aircraft and defense assets | -1.1% | North America, Europe legacy defense infrastructure | Medium term (2-4 years) |
| Algorithmic bias causing mission-critical false negatives | -0.6% | Global, particularly diverse operational environments | Long term (≥ 4 years) |
| Rare-earth component supply-chain vulnerabilities | -0.9% | Global, concentrated impact on Western defense contractors | Medium term (2-4 years) |
| Source: Mordor Intelligence | |||
Privacy and Data-Protection Compliance Burdens
The 2024 European Data Protection Board guidance forces aerospace operators to embed privacy-by-design in every biometric flow. Article 9 mandates granular consent logging, tightened purpose limitation, and local processing wherever feasible. Compliance adds 15-25% to deployment expense, often delaying programs at smaller contractors. California’s CCPA extension in the US compels separate data governance frameworks for state contracts. Vendors are now encrypting templates on-chip and automating deletion at mission close-out to limit statutory exposure. Although costly, these measures create new service lines for compliance audits and privacy engineering.
Retrofit Costs for Legacy Aircraft and Defense Assets
Aging fleets in North America and Europe still host analog avionics panels and cramped compartments. Embedding biometric sensors into such environments may mean custom mounts, EMI shielding, and recertification, each of which inflates program budgets. Defense authorities weigh operational disruption against security gains, causing multi-year phase-ins. Hardware-as-a-service models and edge AI boards that piggyback on existing power buses are emerging to soften the capex spike. Still, lifecycle support remains an open question for cash-constrained operators.
*Our forecasts treat driver/restraint impacts as directional, not additive. The impact forecasts reflect baseline growth, mix effects, and variable interactions.
Segment Analysis
By Technology: Iris Recognition Gains Ground Despite Fingerprint Dominance
Fingerprint scanners provided 38.9% of the aerospace and defense biometric market share in 2024, reflecting entrenched supply chains and proven accuracy. However, iris systems are trending toward an 8.32% CAGR to 2030 as contactless verification becomes essential inside hermetic suits and depressurized modules. The aerospace and defense biometric market size attached to iris readers is forecast to expand at least two points faster than any competing modality over the next five years. NASA’s Artemis habitats will rely on dual-eye identification for hatch access, demonstrating use cases beyond Earth orbit.
Multi-modal stacks merging prints, faces, and irises dominate new Requests for Proposal, bringing error rates below the 1-in-100 million threshold demanded by missile command posts. Facial algorithms are now fused with spectral imaging to improve performance under infrared floodlights, a familiar setting at forward operating bases. Voiceprints and behavioral biometrics remain niche but benefit unmanned ground stations with obstructed cameras. Vendors also embed secure elements inside sensors for template-on-chip storage, blocking extraction even after device capture in hostile territory.


By Component: Services Segment Accelerates as Hardware Matures
Hardware held a 53.65% share in 2024, but services revenue will grow at a 7.65% CAGR as primes seek lifecycle annuities via maintenance, red-team testing, and threat-intel feeds. For instance, IDEMIA’s USD 194.5 million GSA award bundles sustainment, training, and analytics dashboards into a single vehicle. If current renewal rates hold, the aerospace and defense biometric market size for integration and sustainment could eclipse hardware spending by 2028. Software upgrades add synthetic data augmentation, bias-reduction patches, and post-quantum cryptography each quarter, keeping license fees climbing.
Edge AI modules custom-tuned for radiation-hardened environments enter second-generation design, lowering swap-out needs. Yet even with improved Mean Time Between Failures, orbital deployments require contractor-operated ground-station help desks to recalibrate templates when radiation blips distort sensor fidelity. This service wrapper cements multi-year revenue streams and dovetails with broader zero-trust rollouts across government IT estates.
By Application: Payment Systems Emerge as Growth Driver
Access control and secure ID commanded 34.70% of 2024 revenue, but biometric payment flows are charting an 8.32% CAGR. Airlines introduce facial-token wallets that let passengers pay for duty-free purchases without cards or boarding passes, trimming queue times and reducing ancillary fraud. Defense commissaries plan similar pilots so deployed personnel can transact inside access-controlled perimeters without carrying physical IDs. Surveillance and security remain robust as satellite sensors funnel live feeds into biometric watchlists, enriching situational awareness in border zones.
In high-throughput environments like ISS resupply docks, biometric payment systems prevent credential swapping and streamline inventory audits. The aerospace and defense biometric market now embeds payment APIs alongside traditional identification calls, making vendor lock-in less severe and stimulating middleware competition. Crew authentication applications in space vehicles also adopt continuous heartbeat and skin-temperature signals, ultimately merging payment, health, and access credentials into a single bio-token.
By End User: Space Sector Leads Growth Trajectory
Military and defense users held 39.50% of outlays in 2024, yet the space end user vertical will surge at an 8.65% CAGR through 2030. For months, crew isolation on lunar gateways requires continuous biometric health and security checks independent of Earth links. ESA’s new protocols store encrypted templates locally so authentication can persist through solar-storm outages. The aerospace and defense biometric market size attributable to space platforms is expected to cross USD 2 billion by 2030 if mission manifests remain on schedule.
Homeland security agencies adopt the same hardened algorithms, shrinking vendor design cycles. Commercial aviation’s parallel investments in passenger flow systems create economies of scale that defense ministries leverage via commercial off-the-shelf (COTS) procurement clauses. Dual-use pathways thus shorten lab-to-field timelines and reduce upfront R&D risk, reinforcing market stickiness among top integrators.
Geography Analysis
North America’s dominance is rooted in contiguous supply chains, long-running classified programs, and robust vendor–government ecosystems. Northrop Grumman’s USD 1.4 billion IBCS award to Poland underscores export momentum as allies plug into US doctrine. Canada’s lunar rover plans and Mexico’s e-gate procurements widen the continental addressable base. The aerospace and defense biometric market has benefited from streamlined certification under FIPS-201, allowing off-the-shelf modules to leapfrog some NATO testing hurdles.
Asia-Pacific outpaces other regions in growth as strategic rivalry compels accelerated technology adoption. India’s Aadhaar experience primes domestic integrators to extend authentication from civil to defense spacecraft. China’s Tiangong station schedules push for AI-driven biometric self-diagnostics, fostering local silicon innovation to counter Western export restrictions. Japan and South Korea co-invest in quantum-safe identity chips, seeking autonomy from external suppliers.
Europe balances innovation with stringent compliance. While restrictive, the EDPB’s biometric guidelines catalyze research into homomorphic encryption for template matching. ESA’s multi-agency Human and Robotic Exploration directorate funds continuous bio-monitoring wearables technologies transferable to military field hospitals. Elsewhere, the UAE and Saudi Arabia embed biometric corridors at mega-hubs to manage pilgrimage surges and expatriate labor flows, illustrating humanitarian and security duality.

Competitive Landscape
The aerospace and defense biometric market is moderately consolidated. Thales, IDEMIA, and Northrop Grumman leverage existing defense accreditations and have capture teams versed in lengthy procurement cycles. Thales booked over USD 400 million in biometric deals during 2024, including Indonesian e-gates that process 6 million travelers yearly. IDEMIA’s service-heavy contract with the GSA exemplifies a pivot to recurring revenue over perpetual licenses. Northrop Grumman layers biometric modules onto command-and-control (C2) assets, raising switching costs for allied militaries.
New entrants focus on specialty niches. iPluence’s eye-signal patent supports head-mounted displays that require hands-free identification. Startups offering quantum-resistant template vaults position for future standards. Component suppliers such as Infineon embed biometric secure elements inside satellite-grade microcontrollers, ensuring root-of-trust at the hardware layer.
Strategic moves center on open APIs and data-sharing mandates. NATO urges interoperable formats so allied forces can validate identities across joint operations, propelling consortium-based tenders. Meanwhile, algorithmic fairness missions spur partnerships with academic labs to enrich training datasets and reduce demographic bias. Vendors who certify ethical AI and military-grade robustness are set to command premium margins.
Aerospace And Defense Biometrics Industry Leaders
NEC Corporation
Thales Group
Leidos Holdings, Inc.
Northrop Grumman Corporation
IDEMIA Group
- *Disclaimer: Major Players sorted in no particular order

Recent Industry Developments
- January 2025: IDEMIA Group won a USD 194.5 million GSA contract to deploy multi-modal authentication across US federal agencies, emphasizing zero-trust readiness.
- October 2024: Leidos captured a USD 249 million US Army force-protection deal featuring biometric access control.


Global Aerospace And Defense Biometrics Market Report Scope
| Fingerprint Recognition |
| Face Recognition |
| Iris Recognition |
| Others Types |
| Hardware |
| Software |
| Services |
| Access Control and Secure ID |
| Surveillance and Security |
| Immigration and Border Management |
| Crew and Employee Authentication |
| Payment and Transaction |
| Military and Defense |
| Homeland Security |
| Commercial Aviation |
| Space |
| North America | United States | |
| Canada | ||
| Mexico | ||
| Europe | United Kingdom | |
| France | ||
| Germany | ||
| Italy | ||
| Russia | ||
| Rest of Europe | ||
| Asia-Pacific | China | |
| India | ||
| Japan | ||
| South Korea | ||
| Rest of Asia-Pacific | ||
| South America | Brazil | |
| Rest of South America | ||
| Middle East and Africa | Middle East | Saudi Arabia |
| Israel | ||
| United Arab Emirates | ||
| Rest of Middle East | ||
| Africa | South Africa | |
| Rest of Africa | ||
| By Technology | Fingerprint Recognition | ||
| Face Recognition | |||
| Iris Recognition | |||
| Others Types | |||
| By Component | Hardware | ||
| Software | |||
| Services | |||
| By Application | Access Control and Secure ID | ||
| Surveillance and Security | |||
| Immigration and Border Management | |||
| Crew and Employee Authentication | |||
| Payment and Transaction | |||
| By End User | Military and Defense | ||
| Homeland Security | |||
| Commercial Aviation | |||
| Space | |||
| By Geography | North America | United States | |
| Canada | |||
| Mexico | |||
| Europe | United Kingdom | ||
| France | |||
| Germany | |||
| Italy | |||
| Russia | |||
| Rest of Europe | |||
| Asia-Pacific | China | ||
| India | |||
| Japan | |||
| South Korea | |||
| Rest of Asia-Pacific | |||
| South America | Brazil | ||
| Rest of South America | |||
| Middle East and Africa | Middle East | Saudi Arabia | |
| Israel | |||
| United Arab Emirates | |||
| Rest of Middle East | |||
| Africa | South Africa | ||
| Rest of Africa | |||


Key Questions Answered in the Report
How large is the Satellite aerospace and defense biometric market in 2025?
It stands at USD 12.11 billion and is forecasted to climb to USD 16.28 billion by 2030, marking a 6.10% CAGR.
Which technology leads current deployments?
Fingerprint recognition holds 38.90% share due to mature supply chains, but iris systems are the fastest riser at 8.32% CAGR.
Why is Asia-Pacific the fastest-growing region?
India’s and China’s sizeable defense and space budgets push regional CAGR to 8.12% through 2030, outpacing all other geographies.
What segment offers the highest growth opportunity?
The space end-user segment is projected to expand at 8.65% CAGR as crewed missions and commercial constellations require autonomous biometric monitoring.
How do privacy regulations affect adoption?
GDPR and CCPA compliance can add up to 25% in deployment costs, but they are spurring innovation in privacy-preserving template storage and encryption.
Which companies dominate the competitive landscape?
Thales Group, IDEMIA Group, and Northrop Grumman Corporation together account for a significant share, leveraging established defense credentials and end-to-end integration capabilities.
Page last updated on:


