Military Cybersecurity Market Size and Share
Market Overview
| Study Period | 2020 - 2031 |
|---|---|
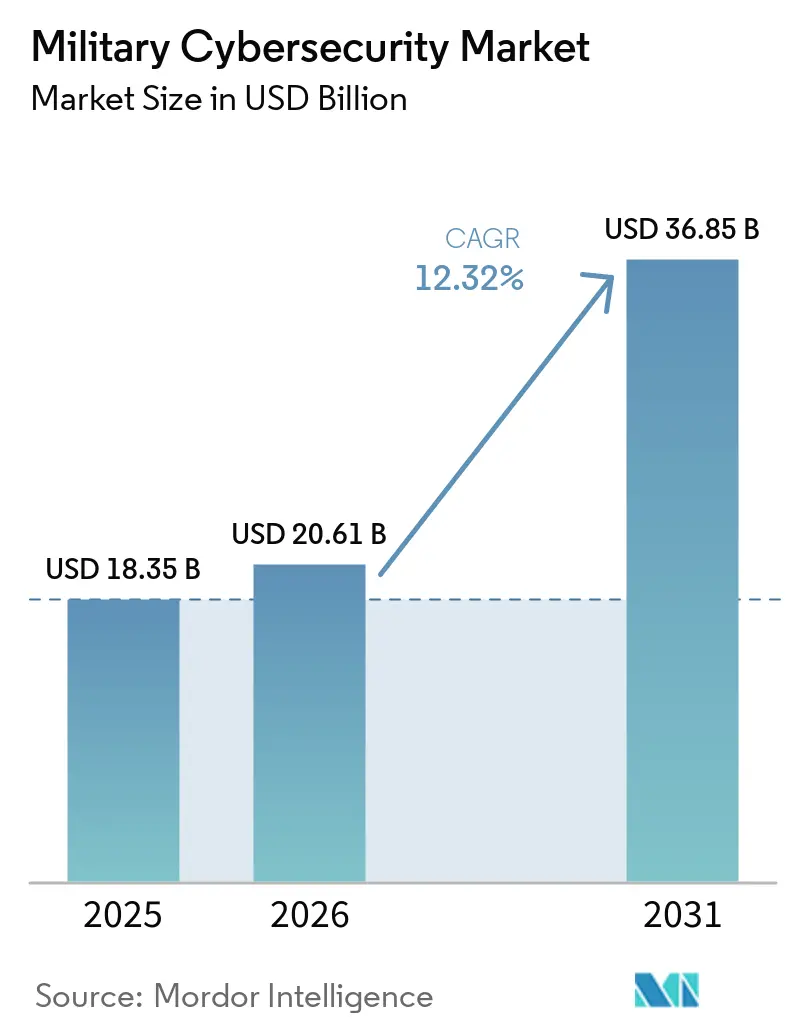
| Market Size (2026) | USD 20.61 Billion |
| Market Size (2031) | USD 36.85 Billion |
| Growth Rate (2026 - 2031) | 12.32% CAGR |
| Fastest Growing Market | North America |
| Largest Market | North America |
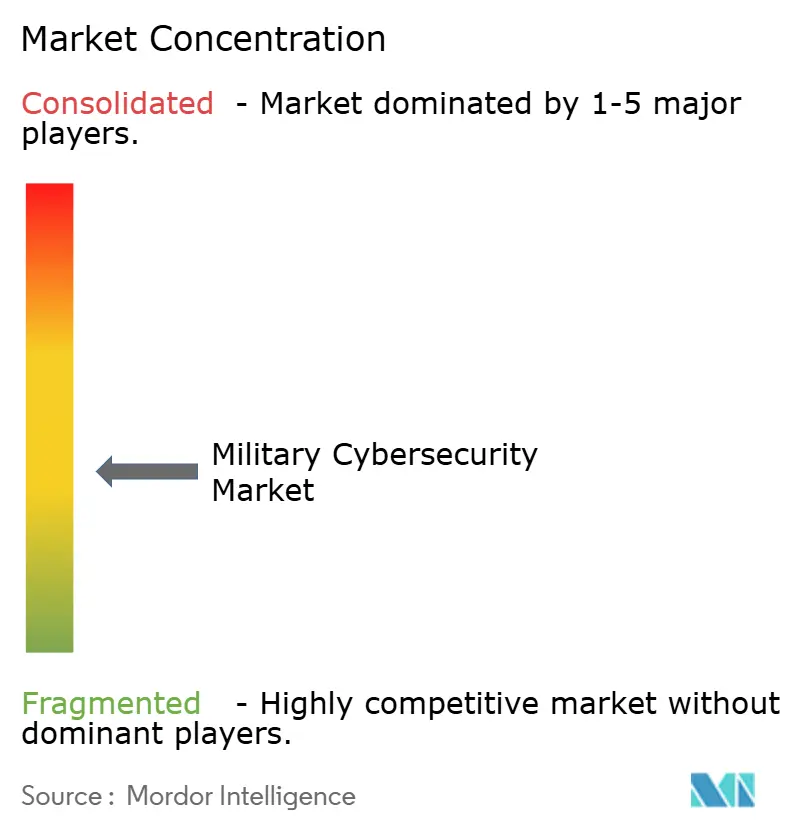
| Market Concentration | Medium |
Major Players *Disclaimer: Major Players sorted in no particular order Image © Mordor Intelligence. Reuse requires attribution under CC BY 4.0. | |
Military Cybersecurity Market Analysis by Mordor Intelligence
The military cybersecurity market size was valued at USD 18.35 billion in 2025 and estimated to grow from USD 20.61 billion in 2026 to reach USD 36.85 billion by 2031, at a CAGR of 12.32% during the forecast period (2026-2031). Growth stems from state-sponsored intrusions, zero-trust mandates, and multi-domain modernization programs that compel defense agencies to harden digital infrastructure. The Pentagon set the tone by allocating USD 14.5 billion for cyberspace activities in fiscal 2025, a year-on-year rise of USD 64 million.[1]Source: US Department of Defense, “FY 2025 Budget Request,” comptroller.defense.gov NATO established an Integrated Cyber Defence Centre in July 2024 to synchronize alliance responses. Asia-Pacific governments followed suit, with Japan approving a historic USD 734 billion defense budget for 2025 that embeds sizeable cyber allocations. Procurement patterns shifted toward software-defined defenses, evidenced by the US Army’s Software Bill of Materials (SBOM) mandate effective February 2025. Demand surged for threat-intelligence platforms, attributing attacks to nation-state actors, while managed security services gained traction amid an acute shortage of cleared cyber talent.
Key Report Takeaways
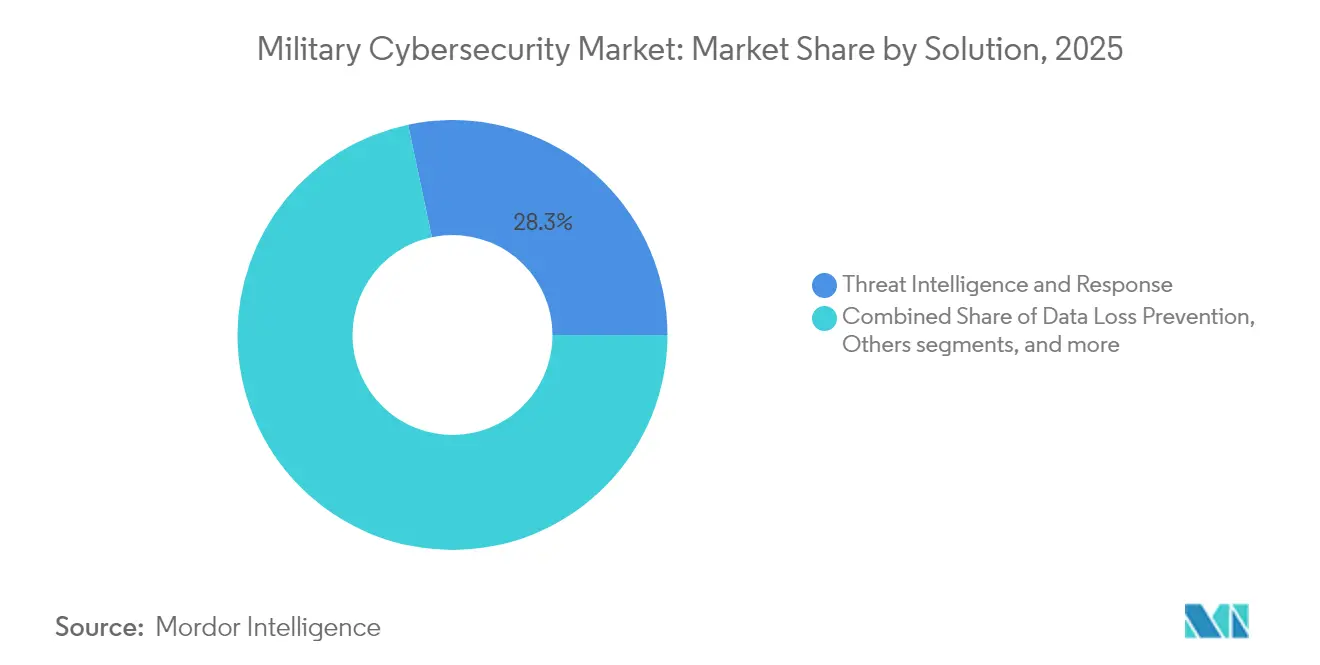
- By solution, the threat intelligence and response segment held 28.31% of the military cybersecurity market share in 2025; the managed security services segment is forecasted to expand at a 14.28% CAGR to 2031.
- By security layer, network security led with 38.12% revenue share in 2025; cloud security is advancing at a 16.18% CAGR through 2031.
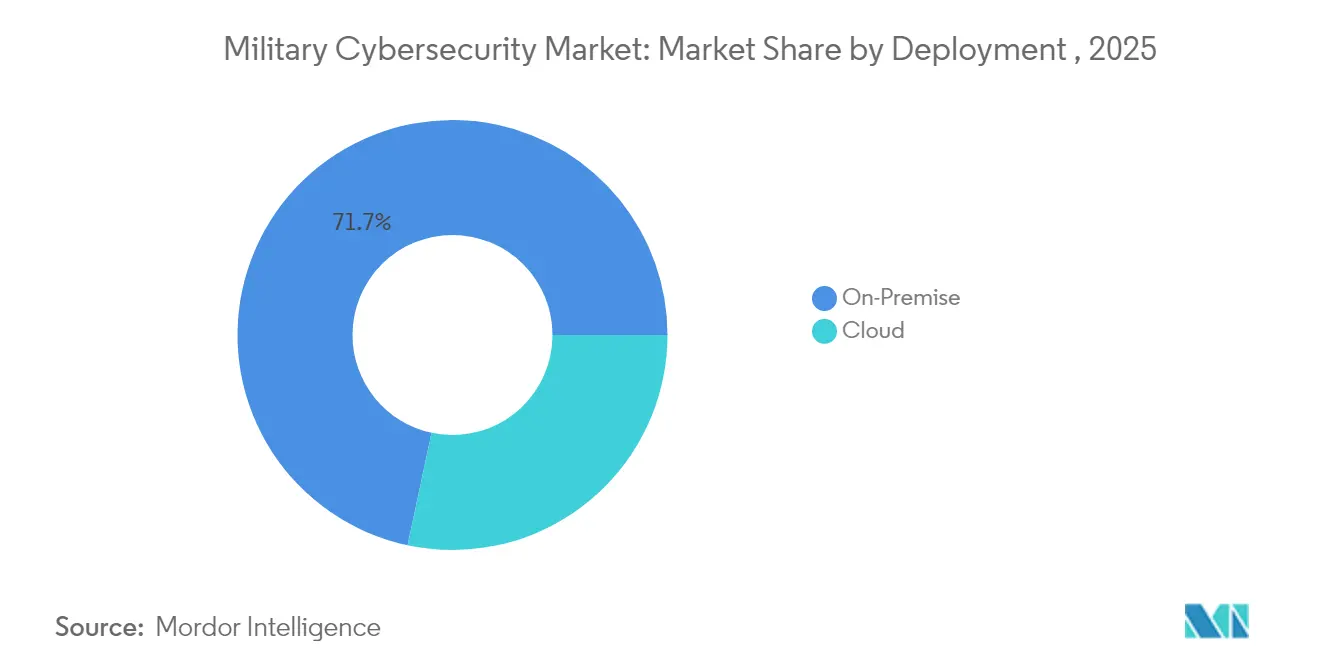
- By deployment, on-premises solutions accounted for 71.65% of the military cybersecurity market size in 2025, while cloud deployments rose at a 16.55% CAGR.
- By operation domain, land forces captured 42.11% share of the military cybersecurity market size in 2025; air forces posted the highest 15.22% CAGR to 2031.
- By component, software and services accounted for 60.02% of the military cybersecurity market size in 2025, while hardware rose at a 12.92% CAGR.
- By geography, North America commanded a 45.35% revenue share in 2025, while Asia-Pacific recorded the fastest 13.22% CAGR through 2031.
Note: Market size and forecast figures in this report are generated using Mordor Intelligence’s proprietary estimation framework, updated with the latest available data and insights as of 2026.
Global Military Cybersecurity Market Trends and Insights
Drivers Impact Analysis*
| Driver | (~) % Impact on CAGR Forecast | Geographic Relevance | Impact Timeline |
|---|---|---|---|
| Escalating state-sponsored cyber-intrusions | 3.2% | Global, concentrated in North America and Europe | Short term (≤ 2 years) |
| Modernization programs (JADC2, DIANA, etc.) | 2.8% | North America and NATO allies | Medium term (2-4 years) |
| Cloud and Zero-Trust adoption across DoD | 2.1% | North America, expanding to APAC | Medium term (2-4 years) |
| Private-5G/Open RAN roll-outs drive RF-layer security | 1.9% | Global, led by North America and APAC | Long term (≥ 4 years) |
| SBOM mandates for weapon-system software | 1.4% | North America, spreading to allied nations | Short term (≤ 2 years) |
| Post-quantum cryptography urgency | 1.1% | Global, prioritized in advanced economies | Long term (≥ 4 years) |
| Source: Mordor Intelligence | |||
Escalating state-sponsored cyber-intrusions
Sophisticated nation-state campaigns reshaped defense priorities, shifting military procurement from perimeter defenses toward assume-breach architectures. China’s December 2024 Treasury hack and the UK Ministry of Defence payroll breach highlighted persistent advanced-persistent-threat activity.[2]Source: Julian E. Barnes, “China Hacked Treasury Dept. in ‘Major’ Breach, U.S. Says,” The New York Times, nytimes.com In response, the 2025 US National Defense Authorization Act classified ransomware groups as hostile actors, increasing demand for platforms that identify attribution at scale. The Office of the Director of National Intelligence launched Sentinel Horizon using Recorded Future intelligence, demonstrating reliance on commercial tradecraft.
Modernization programs drive integrated cyber architectures
Joint All-Domain Command and Control (JADC2) requires defenses that secure traffic spanning land, sea, air, space, and cyber domains, pushing vendors to deliver interoperable, classification-aware solutions. NATO’s Defence Innovation Accelerator funded 70 dual-use firms in 2025, each receiving EUR 100,000 (~USD 116,000) to mature technologies for secure communications. The EU Cyber Solidarity Act injected EUR 1.11 billion (~USD 1.28 billion) into cross-border Security Operations Centres, prompting demand for coalition-ready platforms.[3]Source: European Commission, “The EU Cyber Solidarity Act,” digital-strategy.ec.europa.eu Vendors that built standards-compliant solutions captured opportunities across allied forces.
Cloud and zero-trust adoption accelerates military digital transformation
The Department of Defense pursued full zero-trust deployment by 2027, demonstrated by DISA’s Thunderdome pilot and the Navy’s Flank Speed service. Identity-centric security models created openings for vendors offering continuous device validation and micro-segmentation. The Air Force published a data-centric zero-trust blueprint prioritizing automated content labeling over network boundaries. As classified workloads migrated to accredited clouds, demand rose for enclave-level encryption and policy-based access controls.
Private-5G and Open RAN deployments expand attack surfaces
The Pentagon budgeted USD 179 million for 5G research in 2024 and outlined deployments across roughly 800 bases, requiring RF-layer defenses and secure network slicing. Spain, Jordan, and other allies issued contracts for private 5G, driving global defense spending on cellular networks toward USD 1.5 billion for 2024-2027. Open RAN architectures introduced new supply-chain risks, elevating demand for integrity-verification tools that validate disaggregated components. Vendors specializing in telecom security positioned offerings around high-frequency intrusion detection and end-to-end encryption for tactical communications.
Restraints Impact Analysis*
| Restraint | (~) % Impact on CAGR Forecast | Geographic Relevance | Impact Timeline |
|---|---|---|---|
| Cleared-cyber talent shortage | -2.1% | North America, extending to allied nations | Medium term (2-4 years) |
| Budget constraints / cost overruns | -1.8% | Global, acute in smaller defense budgets | Short term (≤ 2 years) |
| Legacy OT/ICS fragmentation | -1.3% | Global, severe in established military bases | Long term (≥ 4 years) |
| Data-sovereignty and export-control barriers | -0.9% | Global, concentrated in coalition operations | Medium term (2-4 years) |
| Source: Mordor Intelligence | |||
Cleared-cyber talent shortage constrains implementation velocity
Defense agencies grappled with roughly 225,000 unfilled US cyber roles, with clearances exacerbating gaps. The March 2023 Cyber Workforce Strategy pivoted to skills-based hiring, yet clearance timelines still slowed project rollouts. The Office of the National Cyber Director removed four-year degree prerequisites, but labor costs continued to climb as agencies competed for scarce expertise.
Legacy OT/ICS fragmentation creates integration challenges
Many weapon programs lag in embedding cybersecurity during development, leaving thousands of legacy industrial control systems vulnerable. The Pentagon prepared zero-trust guidance for OT environments, scheduled for release in September 2025, acknowledging complex air-gapped networks that require specialized segmentation. Obsolescence management teams struggled to replace aging components amid short commercial life-cycles, slowing unified-architecture rollouts.
*Our forecasts treat driver/restraint impacts as directional, not additive. The impact forecasts reflect baseline growth, mix effects, and variable interactions.
Segment Analysis
By Solution: Threat intelligence and response dominate, managed security services surge
The threat intelligence and response held 28.31% of the military cybersecurity market share in 2025, reflecting commanders’ need for campaign-level attribution and predictive analytics. Vendors integrated AI models to correlate indicators across multiple classification tiers, reducing latency between detection and operational action. Managed security services posted a 14.28% CAGR as organizations outsourced 24/7 monitoring to offset staff shortages. Identity and Access Management tools grew on the back of zero-trust directives that mandated continuous verification. Security information and event management platforms evolved toward cloud-native, behavior analytics engines that identify subtle anomalies rather than rely solely on rule-based alerts.
Defense agencies increasingly paired threat intelligence feeds with kinetic planning systems, allowing commanders to model cyber effects alongside physical operations. The military cybersecurity market size for threat intelligence is projected to reach USD 10.29 billion by 2031, growing at 12.08% annually. SBOM compliance tools became integral to managed-service portfolios, ensuring software supply-chain visibility for new and retrofit programs.


By Security Layer: Network security remains cornerstone yet cloud surges
Network security captured 38.12% revenue in 2025, anchored by encryption, segmentation, and cross-domain guards that protect classified links. Private 5G deployments widened the footprint for adaptive firewalls that secure software-defined radio paths. Cloud security logged a 16.18% CAGR as accredited hyperscale zones handled sensitive, unclassified workloads. Multi-tenant boundary controls, enclave-level keys, and continuous compliance checks dominated procurement requirements.
Endpoint and application security are blended into zero-trust orchestration, where device health, user behavior, and data labels drive access decisions irrespective of network location. The military cybersecurity market size for cloud security is forecast to exceed USD 7.05 billion by 2031. Meanwhile, hardware-based encryption modules supported post-quantum roadmaps, ensuring traffic protection beyond 2035.
By Deployment: On-premise persists yet hybrid grows
On-premise maintained 71.65% market share in 2025 as commanders required deterministic control under communications-denied conditions. Air-gapped data centers, forward-deployed servers, and ruggedized tactical clouds dominated field procurements. Cloud deployments rose at 16.55% CAGR as DoD shifted non-classified workloads to commercial regions that passed FedRAMP High and Impact Level 5 baselines.
Hybrid models combined edge processing with intermittent synchronization to central clouds, supporting missions where latency and resilience trumped bandwidth constraints. The Pentagon piloted offshore cloud regions to enable coalition operations without repatriating data—an approach that emphasized enclave shielding over physical location. Cloud-native DevSecOps pipelines shortened update cycles, accelerating vulnerability patching from months to hours.
By Operation Domain: Land forces anchor spending, air forces accelerate
Given their distributed installations and legacy systems, land forces accounted for 42.11% of the military cybersecurity market in 2025. Brigade Combat Teams modernized their Tactical Server Infrastructure, integrating software-defined radios with cyber protections. The military cybersecurity market share of land assets is projected to fall slightly as spending diffuses across other domains. Air forces experienced the fastest 15.22% CAGR due to unmanned aerial systems, satellite links, and advanced avionics requiring secure over-the-air updates.
Naval platforms hardened control networks spanning submarines, carriers, and littorals, deploying autonomous cyber agents that operate without satellite reach. The US Space Command invested in resilient ground stations and encryptors that withstand jamming and spoofing. Cross-domain solutions ensured mission data flowed between service branches while preserving classification boundaries.
By Component: Software and services dominate digital shift
Software and services represented 60.02% revenue in 2025 as defense agencies prioritized agile patches, analytics, and outsourced monitoring. The "Continuous Authority to Operate" frameworks reduced accreditation cycles, promoting rapid feature releases. The hardware segment grew at a 12.92% CAGR through 2031, fueled by trusted-platform modules, encryption accelerators, and AI inference chips that detect malware. DARPA's USD 42.8 million INGOTS program funded automated vulnerability discovery that runs on edge processors, proving hardware-software convergence. Future procurements will blend secure boot, measured attestation, and containerized microservices to deliver layered defenses from silicon to application.
Geography Analysis
North America retained 45.35% market share in 2025, underpinned by the United States’ USD 30 billion cyber allocation and mature acquisition ecosystem. Regional programs such as DISA’s Thunderdome, the Army’s SBOM mandate, and private 5G rollouts shaped global requirements. Canada leveraged NATO’s Defence Innovation Accelerator to co-fund dual-use startups, while Mexico advanced military cloud accreditation to secure border operations. The military cybersecurity market size for North America is projected to reach USD 16.58 billion by 2031.
Asia-Pacific posted the highest 13.22% CAGR as Japan adopted an active cyber defense posture, authorizing pre-emptive operations against adversaries. QUAD initiatives standardized software security audits across Australia, India, Japan, and the United States, easing vendor entry. ASEAN militaries formed dedicated cyber commands; Singapore’s Digital Intelligence Service operationalized integrated threat-hunting across maritime and land assets. China’s Volt Typhoon campaign against Guam’s infrastructure accelerated investment in island-based early-warning systems.
Europe benefited from the EUR 1.11 billion (~USD 1.28 billion) Cyber Solidarity Act and the NATO Integrated Cyber Defence Centre. Finland hosted technology hubs working on 6G secure communications, attracting Northern European startups. However, fragmented procurement and divergent cryptographic standards slowed cross-border scaling. The Middle East and Africa expanded cyber budgets to protect critical infrastructure amid regional conflicts, though growth remained uneven due to fiscal constraints.


Competitive Landscape
The market showed moderate concentration. Lockheed Martin Corporation, BAE Systems plc, Northrop Grumman Corporation, and RTX Corporation extended traditional strength by integrating AI-driven analytics into command-and-control suites. Commercial specialists such as Palo Alto Networks, Fortinet, Cisco, and CrowdStrike secured large managed-service and software subscriptions; Palo Alto’s USD 996 million DISA blanket purchase agreement signaled acceptance of commercial tools for classified workloads. Partnerships proliferated: Lockheed Martin embedded AI sensors from CrowdStrike into F-35 mission systems; BAE Systems collaborated with Splunk on real-time log analytics for naval combat networks.
Strategic moves included Palantir’s USD 919.78 million sole-source Navy deal for granular classification controls and HII’s USD 70 million Air Force task order focused on vulnerability mitigation. Vendors differentiated by supplying standards-compliant SBOM generators, post-quantum encryption suites, and RF-layer intrusion detection tuned for private 5G. Niche disruptors targeted operational-technology security; General Dynamics’ USD 185 million Air Force contract addressed industrial control systems hardening.
As top suppliers jointly controlled about 55% of global revenue, the market showed healthy competition yet clear leadership. Integrated architecture offerings that combine zero-trust, threat intelligence, and supply-chain assurance determined contract wins, while point products risked commoditization.
Military Cybersecurity Industry Leaders
Lockheed Martin Corporation
Northrop Grumman Corporation
BAE Systems plc
RTX Corporation
Thales Group
- *Disclaimer: Major Players sorted in no particular order

Recent Industry Developments
- February 2025: HII announced its Mission Technologies division secured a USD 70 million task order to enhance the security of US Air Force systems and software. Over five years, HII will identify and mitigate vulnerabilities, ensuring compliance with government-mandated information security requirements and protecting against unauthorized access or adversarial threats.
- June 2024: Leidos was awarded a USD 738 million follow-on contract to provide enterprise IT, telecommunications, and cybersecurity support to the Department of the Air Force in the National Capital Region. The single-award contract includes a one-year base period, four one-year options, and a six-month option.


Research Methodology Framework and Report Scope
Market Definitions and Key Coverage
Our study classifies the military cybersecurity market as all dedicated hardware, software, and managed services purchased by national defense ministries and uniformed forces to protect mission-critical networks, weapon platforms, and classified data from malicious cyber activity.
Solutions span threat intelligence, identity and access controls, network, cloud, and endpoint security layers, and related professional services.
Scope Exclusions: Spending by civilian agencies, border-control IoT sensors, and generic commercial antivirus tools are outside this assessment.
Segmentation Overview
- By Solution
- Threat Intelligence and Response
- Identity and Access Management
- Data Loss Prevention
- Security Information and Event Management
- Unified Threat Management
- Risk and Compliance Management
- Managed Security Services
- Others
- By Security Layer
- Endpoint Security
- Network Security
- Cloud Security
- Application Security
- By Deployment
- On-Premise
- Cloud
- By Operation Domain
- Land Forces
- Air Forces
- Naval Forces
- By Component
- Hardware Appliances
- Software and Services
- By Geography
- North America
- United States
- Canada
- Mexico
- Europe
- United Kingdom
- Germany
- France
- Russia
- Rest of Europe
- Asia-Pacific
- China
- Japan
- India
- South Korea
- Rest of Asia-Pacific
- South America
- Brazil
- Mexico
- Rest of South America
- Middle East and Africa
- Middle East
- Saudi Arabia
- UAE
- Israel
- Rest of Middle East
- Africa
- South Africa
- Rest of Africa
- Middle East
- North America
Detailed Research Methodology and Data Validation
Primary Research
Interviews with program managers, retired cyber officers, and vendors supplying security appliances across North America, Europe, Asia-Pacific, and the Middle East allowed us to validate penetration rates, average selling prices, and adoption timelines that desk work alone could not surface.
Survey feedback from system integrators further tightened assumptions on cloud migration pace and zero-trust compliance milestones.
Desk Research
Mordor analysts built the foundation using freely available tier-1 sources such as US DoD budget justifications, NATO Cooperative Cyber Defence Centre publications, SIPRI military-expenditure tables, EU Agency for Cybersecurity alerts, and Japanese MoD procurement releases, which clarify platform counts and security upgrade cycles.
Company 10-Ks, program briefings, and respected defense media helped benchmark typical contract values.
Paid databases, including D&B Hoovers for integrator revenues and Dow Jones Factiva for award notices, provided additional checkpoints.
This list is illustrative; many more documents informed data collection and cross-checks.
Market-Sizing & Forecasting
A top-down reconstruction starts with defense IT outlays, classified thematically, which are then adjusted by historical cyber-spend ratios and confirmed through sampled contract values (bottom-up roll-ups of major providers).
Key variables include annual defense cyber incident counts, share of workloads moved to secure clouds, rhythm of multi-domain command and control programs (e.g. JADC2), average hardware refresh cycles, and cleared-talent salary inflation.
A multivariate regression captures how each driver shapes value through 2030.
Where supplier roll-ups fall short, gap-filling uses region-specific price-per-seat benchmarks agreed during interviews.
Data Validation & Update Cycle
Outputs pass three-layer variance checks, peer review, and senior analyst approval before release.
Models refresh every twelve months, with interim revisions triggered by major contract awards or regulatory shifts, ensuring clients receive the latest calibrated view.
Why Mordor's Military Cybersecurity Baseline Commands Reliability
Published numbers often differ because publishers choose unlike scopes, price proxies, and refresh cadences.
Key gap drivers include inclusion of allied aerospace IT budgets by some observers, omission of cloud-delivered managed security by others, or single-year FX conversions that skew totals against multi-year averages chosen by Mordor.
Benchmark comparison
| Market Size | Anonymized source | Primary gap driver |
|---|---|---|
| USD 18.35 B (2025) | Mordor Intelligence | - |
| USD 33.25 B (2025) | Global Consultancy A | Bundles broader aerospace IT assets and partial bottom-up inventory of subcontractors, inflating baseline |
| USD 15.05 B (2025) | Trade Journal B | Excludes cloud-based managed services and relies on conservative flat pricing for subscription tools |
The comparison shows how disciplined scope selection, balanced top-down with sampled bottom-up checks, and annual refreshes let Mordor deliver a transparent, dependable benchmark decision-makers can trace back to clear variables and repeatable steps.


Key Questions Answered in the Report
What is the current Military Cybersecurity Market size?
The military cyber security market was valued at USD 20.61 billion in 2026 and is projected to reach USD 36.85 billion by 2031, registering a robust 12.32% CAGR.
Who are the key players in Military Cybersecurity Market?
Thales Group, Lockheed Martin Corporation, General Dynamics Corporation, Northrop Grumman Corporation, and BAE Systems plc are the major companies operating in the military cybersecurity market.
Which is the fastest growing region in Military Cybersecurity Market?
Asia-Pacific posted the highest 13.22% CAGR as Japan adopted an active cyber defense posture, authorizing pre-emptive operations against adversaries.
Which region has the biggest share in Military Cybersecurity Market?
North America retained 45.35% market share in 2025, underpinned by the United States’ USD 30 billion cyber allocation and mature acquisition ecosystem.
Page last updated on:


