Military Sensors Market Size and Share
Market Overview
| Study Period | 2020 - 2031 |
|---|---|
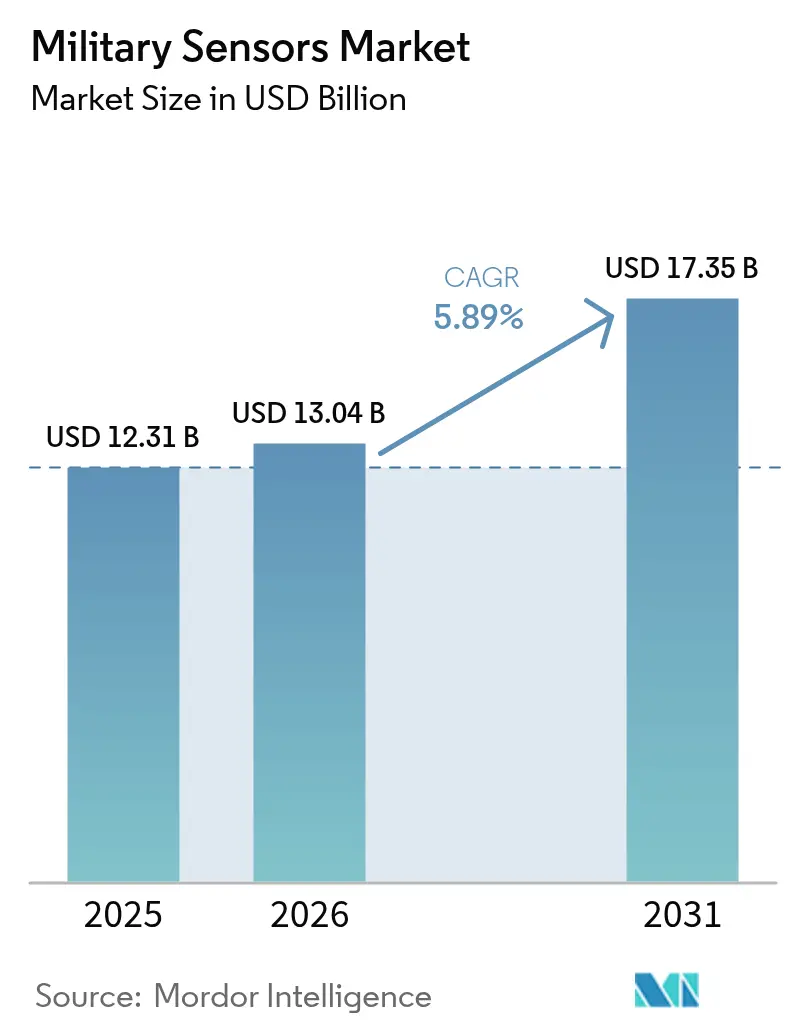
| Market Size (2026) | USD 13.04 Billion |
| Market Size (2031) | USD 17.35 Billion |
| Growth Rate (2026 - 2031) | 5.89% CAGR |
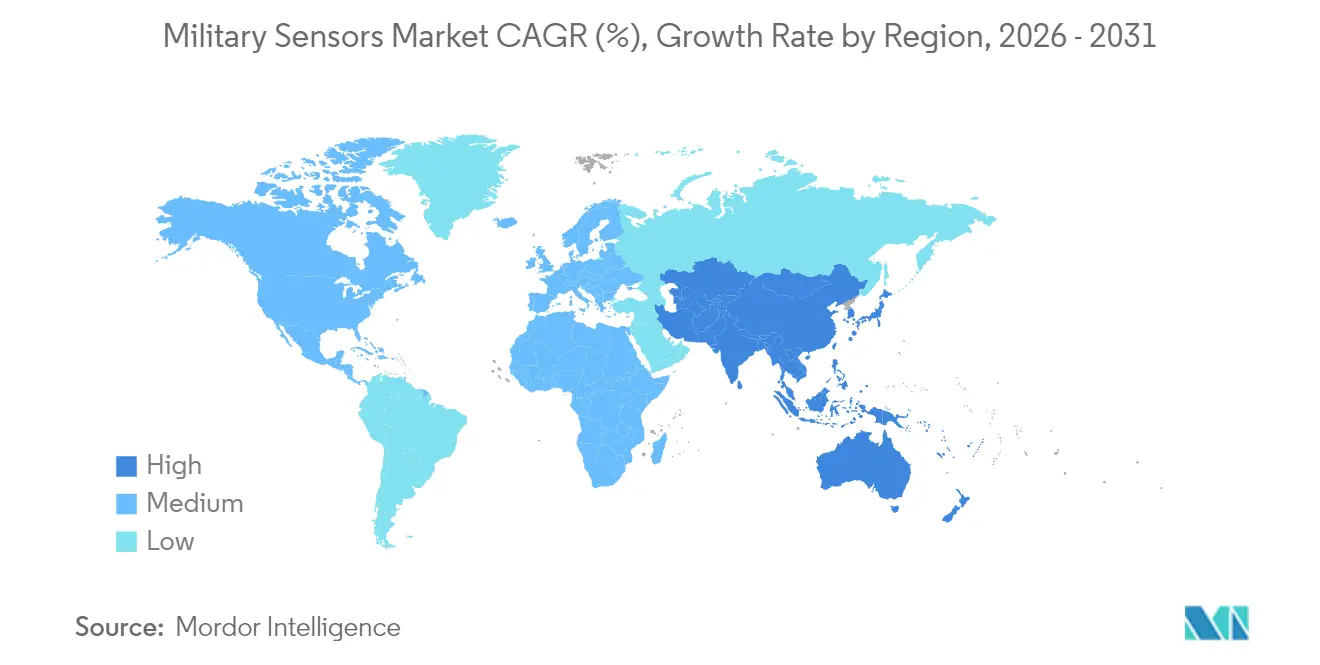
| Fastest Growing Market | Asia Pacific |
| Largest Market | North America |
| Market Concentration | Medium |
Major Players *Disclaimer: Major Players sorted in no particular order Image © Mordor Intelligence. Reuse requires attribution under CC BY 4.0. | |
Military Sensors Market Analysis by Mordor Intelligence
The military sensors market size is expected to grow from USD 12.31 billion in 2025 to USD 13.04 billion in 2026 and is forecast to reach USD 17.35 billion by 2031 at 5.89% CAGR over 2026-2031. The military sensors market size trajectory reflects rapid defense-modernization cycles in response to intensifying great-power rivalry and the accelerating pace of hypersonic and unmanned‐system threats. Quantum sensing advances, artificial-intelligence-driven data fusion, and miniaturization breakthroughs are reshaping surveillance doctrines and enabling persistent, distributed sensor constellations that cover every operational domain. Defense ministries are reallocating budgets toward multifunction radar arrays, space-based early-warning nodes, and soldier-worn EO/IR devices that deliver real-time targeting data. At the same time, supply-chain fragilities in rare-earth magnets and III–V semiconductors drive near-shoring policies, while spectrum congestion pushes industry toward photonic processing and dynamic frequency-management solutions to preserve detection range in jammed environments.
Key Report Takeaways
- By sensor type, radar systems led with 39.10% of the military sensors market share in 2025; electro-optical/infrared sensors are expanding at the fastest 6.37% CAGR through 2031.
- By platform, land systems captured 42.10% of the military sensors market size in 2025; airborne platforms recorded the highest 7.05% CAGR to 2031.
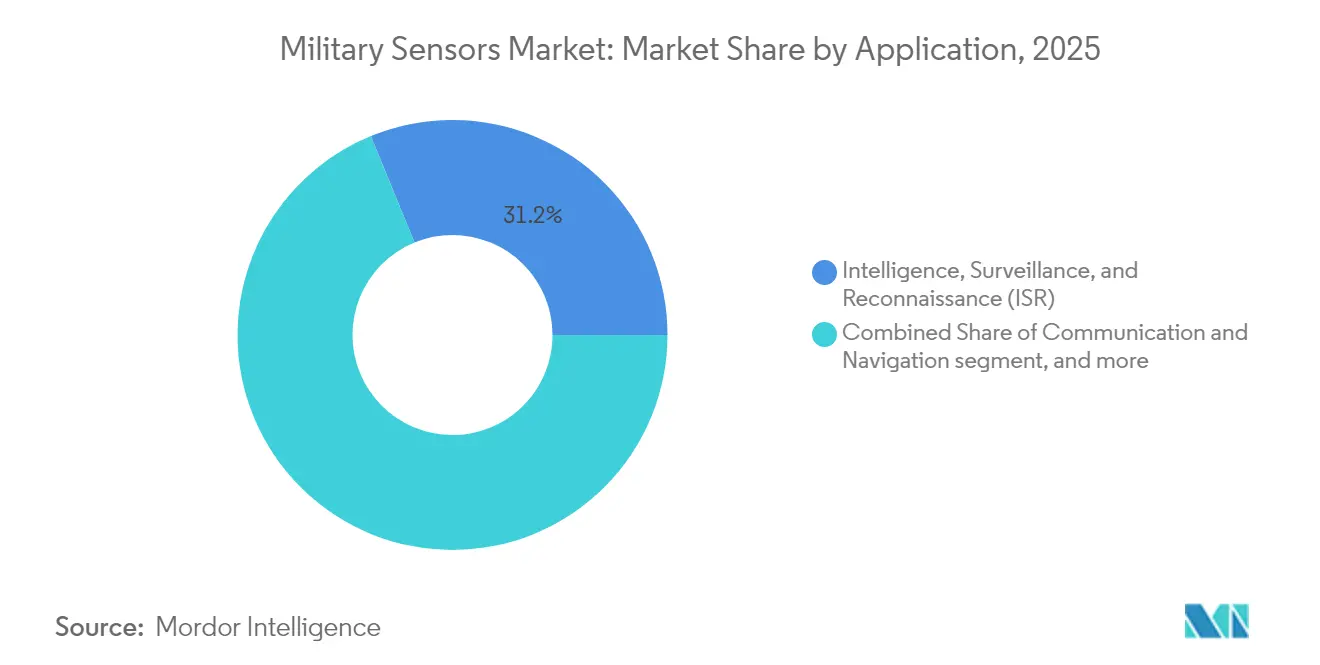
- By application, ISR commanded a 31.20% revenue share in 2025, while integrated soldier systems advanced at a 6.12% CAGR through 2031.
- By technology, MEMS and nanotechnology sensors held a 38.20% share in 2025; quantum and cold-atom sensors posted the strongest 7.88% CAGR during the forecast.
- By geography, North America represented 37.20% of 2025 revenue; Asia-Pacific is the fastest-growing region at a 5.41% CAGR to 2031.
Note: Market size and forecast figures in this report are generated using Mordor Intelligence’s proprietary estimation framework, updated with the latest available data and insights as of 2026.
Global Military Sensors Market Trends and Insights
Drivers Impact Analysis*
| Driver | % Impact on CAGR Forecast | Geographic Relevance | Impact Timeline |
|---|---|---|---|
| Surge in ISR-focused defense budgets | +1.2% | Global, with concentration in North America and APAC | Medium term (2-4 years) |
| Rapid uptake of UAV-borne miniaturized sensors | +0.9% | Global, led by North America and Europe | Short term (≤ 2 years) |
| Escalating radar deployments along contested borders | +0.7% | APAC core, spill-over to Europe and MEA | Medium term (2-4 years) |
| AI-enabled multi-sensor fusion for real-time battlespace awareness | +0.8% | North America and EU, expanding to APAC | Long term (≥ 4 years) |
| Proliferation of near-space platforms demanding space-based sensors | +0.6% | Global, with early gains in North America | Long term (≥ 4 years) |
| Breakthroughs in quantum sensing unlocking low-observable target detection | +0.5% | North America and EU, selective APAC adoption | Long term (≥ 4 years) |
| Source: Mordor Intelligence | |||
Surge in ISR-focused defense budgets
Annual appropriations are shifting decisively toward persistent global surveillance. The Pentagon’s FY 2025 plan allocates USD 108.7 million for Wide-Field-of-View tracking satellites and USD 76 million for Hypersonic and Ballistic Tracking Space Sensors. This confirms that orbital architectures now underpin early-warning doctrine. European governments are mirroring the trend; Sweden’s acquisition of the TPY-4 radar underscores NATO’s push for wide-area air-defense coverage.[1]Lockheed Martin, “Sweden Selects TPY-4 Radar,” lockheedmartin.com ISR allocations increasingly bundle AI edge-processing modules, enabling sensors to filter clutter at the collection point instead of flooding command centers. Budget realignment also favors open-system architectures that future-proof platforms against rapid threat evolution and software-defined waveform updates.
Rapid uptake of UAV-borne miniaturized sensors
Unmanned aircraft are now primary carriers of advanced payloads. General Atomics and Saab have demonstrated an airborne early-warning variant of the MQ-9B that displaces traditional E-2-class assets at lower cost.[2]General Atomics, “MQ-9B AEW Press Release,” ga-asi.com Miniaturization allows AESA radars, EW pods, and hyperspectral imagers to fit onto Group-3 drones, expanding coverage of forward areas without risking crewed platforms. France’s frontline micro-factories produce FPV drones with embedded sensors in three-hour cycles, showing how additive manufacturing reduces logistics tails. The trend drives a distributed detection model where swarms relay fused data to commanders, shrinking sensor-to-shooter timelines.
Escalating radar deployments along contested borders
Border flashpoints from the Himalayas to the South China Sea are witnessing dense radar build-outs. China’s microwave-photonic prototype can track ten Mach 20 projectiles simultaneously, achieving a 28 cm range error and 99.7% speed accuracy.[3] People’s Liberation Army Daily via South China Morning Post, “Microwave-Photonic Radar,” scmp.com Such performance forces neighbors to invest in equal or better counters, catalyzing regional radar spending. Land forces pair long-range arrays with counter-UAS sensors that differentiate small drones from clutter, a capability US Army labs demonstrated in 2025 to protect border agents. Procurement specifications now emphasize automated target classification, cyber-hardening, and rapid deployability on modular towers.
AI-enabled multi-sensor fusion for real-time battlespace awareness
Artificial intelligence is integrating once-stovepiped feeds. Lockheed Martin and Google Cloud are fielding large-language-model toolchains that cut engineering cycle times for sensor upgrades and sharpen predictive maintenance. Meta-Anduril “Eagle Eye” headsets passively tag threats within a soldier’s field of view, lifting cognitive load in complex terrain. QinetiQ’s USD 31.5 million task order on the Integrated Sensor Architecture program proves that open data standards can link legacy cameras, acoustic arrays, and satellites into a common operational picture.[4]QinetiQ US, “Integrated Sensor Architecture Task Order,” qinetiq.com With fusion algorithms running at the tactical edge, commanders receive decisional data instead of raw imagery, preserving bandwidth and accelerating response.
Restraints Impact Analysis*
| Restraint | % Impact on CAGR Forecast | Geographic Relevance | Impact Timeline |
|---|---|---|---|
| High acquisition and lifecycle costs of next-gen sensor suites | -0.8% | Global, particularly affecting smaller defense budgets | Medium term (2-4 years) |
| Stringent ITAR/export-control regimes | -0.6% | Global, with concentration in technology transfer markets | Long term (≥ 4 years) |
| Rare-earth-dependent RF/EO component supply-chain fragility | -0.5% | Global, with acute impact on Western manufacturers | Medium term (2-4 years) |
| RF spectrum congestion limiting sensor architecture scalability | -0.4% | Global, particularly in dense electromagnetic environments | Short term (≤ 2 years) |
| Source: Mordor Intelligence | |||
High acquisition and lifecycle costs of next-gen sensor suites
Cutting-edge sensor arrays are stretching procurement budgets. Raytheon’s USD 647 million SPY-6 production award illustrates that hardware price is only the entry fee; support costs can rise 200-300% over the life-of-type. Smaller nations hesitate to commit, creating a tiered adoption curve that advantages well-funded militaries. Soldier-level optics now feature augmented reality overlays and uncooled thermal cores, pushing unit prices far above legacy NVGs, as Elbit’s USD 139 million binocular order shows. Budget pressure incentivizes open-architecture designs and modular upgrade kits that defer obsolescence without full recapitalization.
Stringent ITAR/export-control regimes
International arms regulations complicate cross-border sales, especially for quantum and AI-enabled sensors with dual-use potential. Vendors face lengthy license cycles that inflate non-recurring engineering costs and can chill collaborative R&D. Finland’s 2025 trial of Nokia-Bittium tactical networks highlighted how allied projects must weave around export rules while achieving interoperability. Divergent regional standards risk fragmenting supply chains and undercutting economies of scale, limiting the global reach of smaller innovators.
*Our forecasts treat driver/restraint impacts as directional, not additive. The impact forecasts reflect baseline growth, mix effects, and variable interactions.
Segment Analysis
By Sensor Type: Radar leadership under EO/IR pressure
Radar arrays generated USD 4.81 billion in 2025, equal to 39.10% of the military sensors market. Their dominance stems from all-weather reach and target-class discrimination across air-and-missile defense corridors. The segment benefits from gallium-nitride power amplifiers that lift range while shrinking size and cooling loads. Yet EO/IR modules grow fastest at 6.37% CAGR as forces demand passive, low-probability-of-intercept tracking. The F-22’s panoramic IR defensive system typifies how thermal cameras now double as threat-warning gear, extending radar-silent survivability.
Precision strike doctrine drives EO/IR proliferation aboard UAVs, rotorcraft, and soldier helmets. Multispectral gimbals deliver day-night imagery streamed through encrypted datalinks, while cooled mid-wave detectors provide long-range identification. Acoustic-sensor spending rises in submarine hunting as low-frequency active sonars pair with machine-learning auto-classifiers. Chemical-biological-radiological (CBR) sensors are regaining prominence after the 2024 incidents underscored the risk of non-kinetic attacks. LiDAR adoption accelerates for autonomous convoy navigation and terrain mapping, leveraging automotive supply-chain cost curves. MEMS inertial units achieve less than 1°/h bias drift, enabling precision fires in GPS-denied zones. Laboratory breakthroughs at the University of Colorado suggest quantum atom-interferometer compasses could displace gyros, a shift that may reorder long-term procurement priorities.


By Platform: Land systems still ahead amid airborne sprint
Land platforms accounted for 42.10% of 2025 revenue, reflecting heavy investment in counter-battery radars, coastal surveillance arrays, and border-fence sensor networks. The military sensors market sees steady contract flow for truck-mounted, AESA-equipped radars that relocate within minutes and cue precision fires. However, airborne payloads exhibit the briskest 7.05% CAGR. The MQ-9B AEW variant compresses airborne-warning costs by magnitude versus large turboprop aircraft, spurring allied air forces to reallocate surveillance budgets.
Rotorcraft fleets integrate compact AESAs for long-range maritime search, while High-Altitude, Long-Endurance drones carry hyperspectral kits that detect camouflaged armor. Naval modernization adds panoramic IR cameras atop masts and variable-depth sonars below hulls, creating a layered anti-submarine bubble. The military sensors market size for space-based platforms will expand strongly as Northrop Grumman’s tracking satellites transition from R&D to production funding. Breakthrough infrared photodiodes from Aalto University improve responsiveness 35% at telecommunication wavelengths, promising lighter satellite payloads and reduced cooling loads.
By Application: ISR primacy meets rising soldier demand
ISR missions delivered 31.20% of the military sensors market revenue in 2025 because intelligence remains the currency of modern conflict. Multidomain commanders expect wide-area correlation of radar, EO, and electronic-support measures across the kill chain. Yet, Integrated Soldier Systems notch the highest 6.12% CAGR as platoons require sensor fusion at the edge. Elbit’s binocular NVGs feed heads-up ballistic solutions to infantry, integrating uncooled thermal, laser range-finding, and digital magnetic compasses.
Target-recognition modules embed AI chips that interrogate onboard databases to flag friend-or-foe in less than two seconds. Fire-control radars align with semi-active seekers, cutting crew workload and conserving munitions. Electronic-warfare arrays float on tethered aerostats to monitor RF emissions across 500 km. Command-and-control systems exploit the Integrated Sensor Architecture to share curated data layers among joint units, ensuring common geospatial frames of reference. Specialized EO/IR payloads like Surface Optics’ hypersonic-glare filter protect sensors from plasma sheaths around high-speed weapons, an emerging requirement as boost-glide vehicles proliferate.
By Technology: MEMS steadiness confronted by quantum surge
MEMS and nano-sensors encompass 38.20% of 2025 spending, valued for maturity, low power, and mass-production economics. They anchor aircraft attitude systems, artillery fuzes, and vehicle health monitors. Nevertheless, quantum and cold-atom devices rise at 7.88% CAGR, promising GPS-independent navigation and picoTesla magnetic anomaly detection. The military sensors market sees prototype atom gravimeters that can spot subterranean tunnels or stealth submarines by reading minute gravity gradients. Photonic-and-AESA suites leverage optical signal processing to sidestep RF jamming and deliver broadband beam steering. AI-grade edge processors sit atop sensor stacks, compressing terabytes into target coordinates before transmission, saving scarce tactical bandwidth.
Aalto University’s nano-cloud metasurface toggles emissivity from 0.2 to 0.8, enabling uniforms that stay cool under solar load yet remain invisible to hostile IR cameras. China’s microwave-photonic radar illustrates how photonics clears bandwidth bottlenecks and reduces weight, aligning with airborne platform constraints. Such cross-domain advances suggest the military sensors market will witness technology leapfrogs rather than linear updates over the next decade.
Geography Analysis
North America generated 37.20% of 2025 revenue in the military sensors market, sustained by the Space Development Agency’s proliferated-LEO constellations and Big-Five primes that vertically integrate sensors, processors, and effectors. The SPY-6 radar line funds a multi-year production ramp and underpins the region’s edge in gallium-nitride power modules. Canada contributes active electronically steered sonar for Arctic domain awareness, while Mexico fields modular counter-UAS towers along critical corridors, broadening regional demand. University-industry consortia accelerate lab-to-range cycles, making North America a first adopter of quantum compasses and photonic RF apertures.
Asia-Pacific posts the fastest 5.41% CAGR through 2031, anchored by China’s microwave-photonic radar breakthroughs that spur counter-investments across India, Japan, and Australia. India’s border surveillance network orders multisensor masts every 10 km along the LAC, combining AESA, EO/IR, and passive RF finders. Japan upgrades Aegis destroyers with solid-state S-band arrays to track hypersonic glide vehicles, while South Korea integrates high-pixel-count EO cameras on indigenous MALE drones. Australia’s submarine program drives deep-ocean acoustic sensor demand and funds quantum magnetometer research under the AUKUS umbrella. Europe maintains a mature but growing share. Sweden’s TPY-4 buy strengthens northern-flank air coverage and sets a procurement template for other mid-sized NATO members. Finland’s Nokia-Bittium hybrid network proves commercial-off-the-shelf 5G can harden battlefield links without breaching export-control red lines. Germany’s FCAS fighter studies evaluate conformal photonic apertures embedded in composite skins, reflecting continental interest in low-observable sensor integration. The Middle East and Africa show pocket growth, with GCC states procuring counter-drone radars to protect critical infrastructure and African peacekeeping forces equipping patrols with inexpensive day-night cameras.

Competitive Landscape
The military sensors market shows moderate concentration. Lockheed Martin Corporation, RTX Corporation, and Northrop Grumman Corporation secure multi-billion-dollar framework contracts by bundling sensors with command systems and lifecycle sustainment. Raytheon’s SPY-6 and Northrop’s Hypersonic Tracking Space Sensor exemplify how prime contractors leverage vertical integration from wafer fab to software analytics. Partnerships with cloud leaders inject AI accelerators into traditionally hardware-centric portfolios, as evidenced by the Lockheed-Google alliance that embeds generative models into sensor life-cycle management.
European champions—Thales Group, BAE Systems plc, Leonardo S.p.A—retain regional procurement advantages and co-develop with local ministries to meet NATO interoperability standards. They pursue bolt-on acquisitions of photonics and MEMS start-ups to refresh pipelines without lengthy in-house R&D. Meanwhile, a cohort of quantum-sensor specialists, often university spin-offs, capture early funding rounds and Small Business Innovation Research contracts. Surface Optics, for instance, secured a Phase II award to tailor EO/IR detectors for hypersonic-missile plumes.
Competitive pressure is intensifying around open architectures. Customers demand vendor-agnostic plug-and-play modules to avoid lock-in. In response, incumbents publish interface control documents and adopt SOSA standards to keep platforms relevant. Patent activity in cold-atom technologies rose double digits in 2024–2025, signaling that intellectual-property moats, not factory scale, may determine the next decade’s winners. Overall, rivalry centers on who can integrate quantum, AI, and photonics fastest while still delivering militarized reliability levels.
Military Sensors Industry Leaders
Honeywell International Inc.
Lockheed Martin Corporation
RTX Corporation
Thales Group
BAE Systems plc
- *Disclaimer: Major Players sorted in no particular order

Recent Industry Developments
- June 2025: The French Army started frontline micro-factory trials producing FPV drones with embedded sensors.
- March 2025: Lockheed Martin partnered with Google Cloud to embed generative AI across sensor programs.
- January 2025: QinetiQ US received USD 31.5 million for the Integrated Sensor Architecture tasking to boost data-sharing.
- December 2024: Surface Optics Corporation won Phase II SBIR to develop EO/IR sensors for hypersonic missile detection.


Global Military Sensors Market Report Scope
Several types of sensors are integrated into military systems to enhance their capabilities and ensure that the systems work according to their specifications. The study entails a comprehensive evaluation of the military sensors, including, but not limited to, electro-optical and infrared sensors, seismic sensors, acoustic sensors, magnetic sensors, pressure sensors, temperature sensors, torque sensors, speed sensors, level sensors, flow sensors, force sensors, angle of attack (AoA) sensors, and altimeters.
The military sensors market is segmented by application, platform, and geography. By application, it is divided into Intelligence, Surveillance, and Reconnaissance (ISR), communication and navigation, target recognition, electronic warfare, and command and control. By platform, it is divided into airborne, terrestrial, and naval. The report also covers the market sizes and forecasts for the military sensors market in major countries across different regions. For each segment, the market size is provided in terms of value (USD).
| Radar Sensors |
| Electro-Optical/Infra-Red (EO/IR) Sensors |
| Acoustic (Sonar) Sensors |
| Magnetic and Seismic Sensors |
| Chemical, Biological and Radiological Sensors |
| LiDAR Sensors |
| MEMS Inertial and Environmental Sensors |
| Airborne |
| Land |
| Naval |
| Space-based |
| Intelligence, Surveillance, and Reconnaissance (ISR) |
| Communication and Navigation |
| Target Recognition and Fire Control |
| Electronic Warfare (EW) and Counter-Measures |
| Command, Control, and Situation Awareness |
| Integrated Soldier Systems |
| MEMS and Nano-technology Sensors |
| Photonic and AESA Sensors |
| AI/Edge-computing-enabled Sensors |
| Quantum and Cold-atom Sensors |
| North America | United States | |
| Canada | ||
| Mexico | ||
| Europe | United Kingdom | |
| France | ||
| Germany | ||
| Italy | ||
| Russia | ||
| Rest of Europe | ||
| Asia-Pacific | China | |
| Japan | ||
| India | ||
| South Korea | ||
| Rest of Asia-Pacific | ||
| South America | Brazil | |
| Rest of South America | ||
| Middle East and Africa | Middle East | Saudi Arabia |
| UAE | ||
| Rest of Middle East | ||
| Africa | South Africa | |
| Rest of Africa | ||
| By Sensor Type | Radar Sensors | ||
| Electro-Optical/Infra-Red (EO/IR) Sensors | |||
| Acoustic (Sonar) Sensors | |||
| Magnetic and Seismic Sensors | |||
| Chemical, Biological and Radiological Sensors | |||
| LiDAR Sensors | |||
| MEMS Inertial and Environmental Sensors | |||
| By Platform | Airborne | ||
| Land | |||
| Naval | |||
| Space-based | |||
| By Application | Intelligence, Surveillance, and Reconnaissance (ISR) | ||
| Communication and Navigation | |||
| Target Recognition and Fire Control | |||
| Electronic Warfare (EW) and Counter-Measures | |||
| Command, Control, and Situation Awareness | |||
| Integrated Soldier Systems | |||
| By Technology | MEMS and Nano-technology Sensors | ||
| Photonic and AESA Sensors | |||
| AI/Edge-computing-enabled Sensors | |||
| Quantum and Cold-atom Sensors | |||
| By Geography | North America | United States | |
| Canada | |||
| Mexico | |||
| Europe | United Kingdom | ||
| France | |||
| Germany | |||
| Italy | |||
| Russia | |||
| Rest of Europe | |||
| Asia-Pacific | China | ||
| Japan | |||
| India | |||
| South Korea | |||
| Rest of Asia-Pacific | |||
| South America | Brazil | ||
| Rest of South America | |||
| Middle East and Africa | Middle East | Saudi Arabia | |
| UAE | |||
| Rest of Middle East | |||
| Africa | South Africa | ||
| Rest of Africa | |||


Key Questions Answered in the Report
What is the current value of the military sensors market?
The military sensors market size stands at USD 13.04 billion in 2026 and is projected to climb to USD 17.35 billion by 2031, translating into a 5.89% CAGR.
Which sensor type holds the largest share?
Radar systems lead with 39.10% military sensors market share in 2025 owing to their long-range, all-weather performance.
Which platform segment is growing fastest?
Airborne platforms, especially UAV payloads, register the highest 7.05% CAGR as militaries shift surveillance duties to unmanned assets.
Why is Asia-Pacific the fastest-growing region?
Regional modernization programs and heightened border tensions push Asia-Pacific to a 5.41% CAGR, underpinned by China’s and India’s sensor procurements.
How are AI and quantum technologies changing military sensors?
AI enables real-time sensor fusion and predictive maintenance, while quantum devices promise GPS-free navigation and ultra-sensitive detection, reshaping future procurement strategies.
What are the main restraints on market growth?
High acquisition and lifecycle costs and strict export-control regulations slow adoption, particularly among smaller defense budgets and cross-border collaborations.
Page last updated on:


