Military Wearables Market Size and Share
Market Overview
| Study Period | 2019 - 2031 |
|---|---|
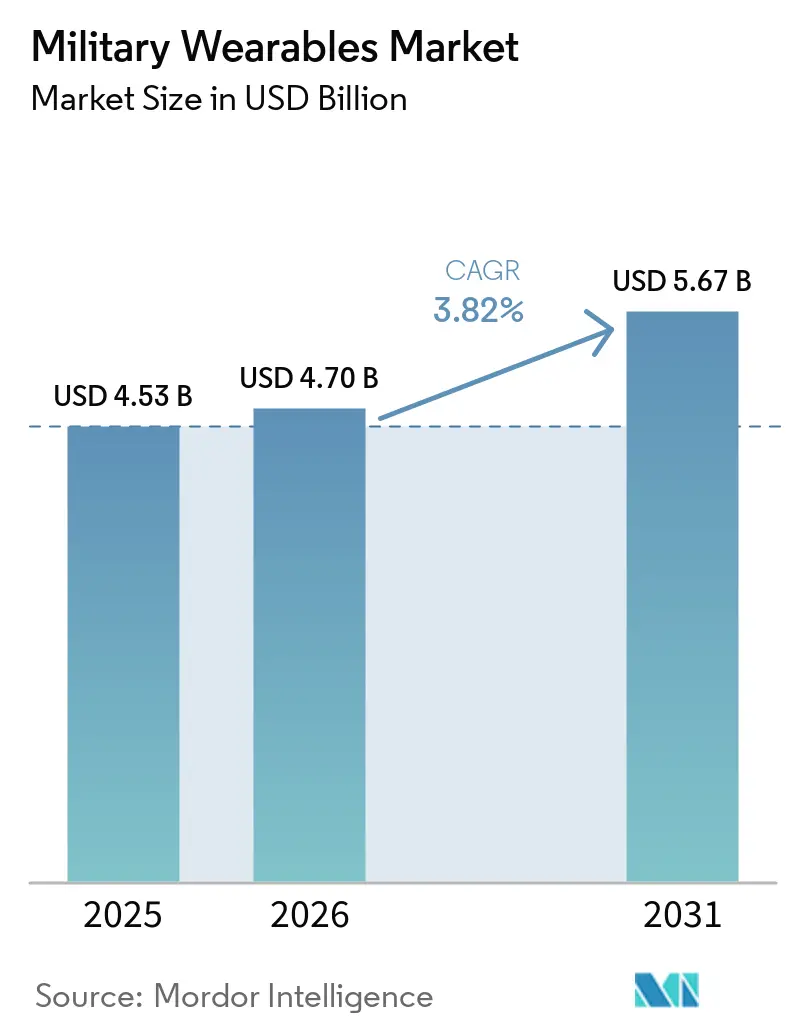
| Market Size (2026) | USD 4.70 Billion |
| Market Size (2031) | USD 5.67 Billion |
| Growth Rate (2026 - 2031) | 3.82% CAGR |
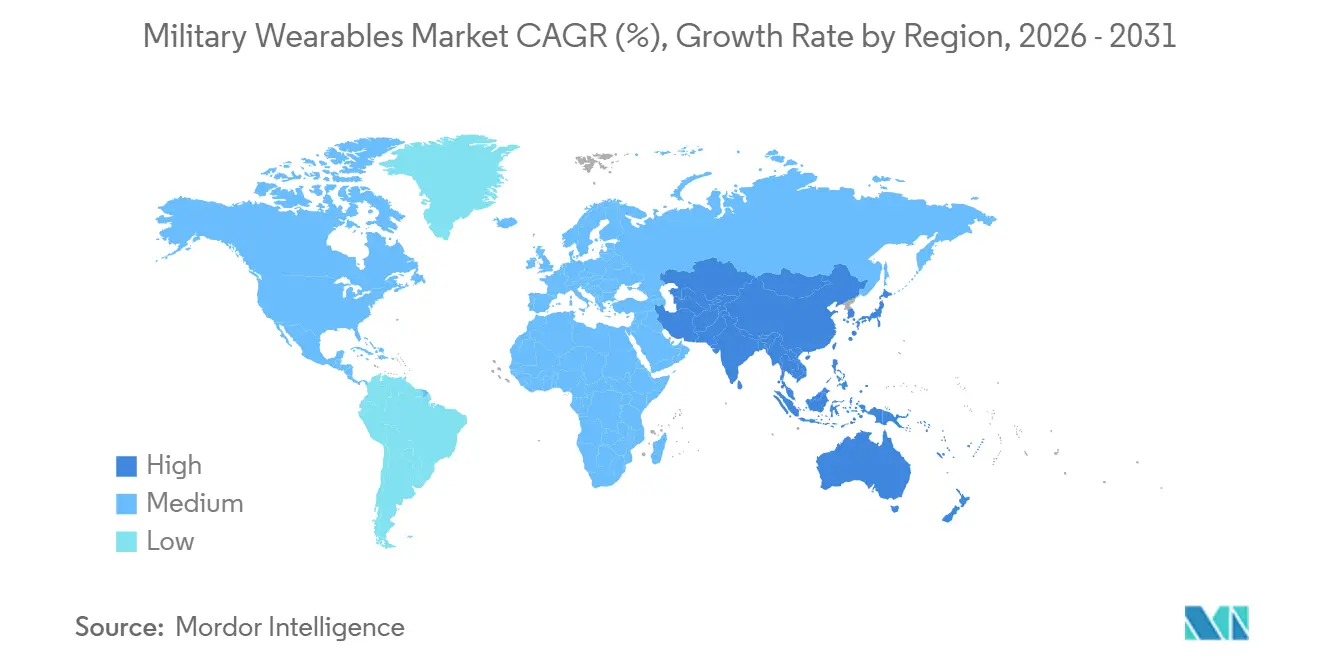
| Fastest Growing Market | Asia-Pacific |
| Largest Market | North America |
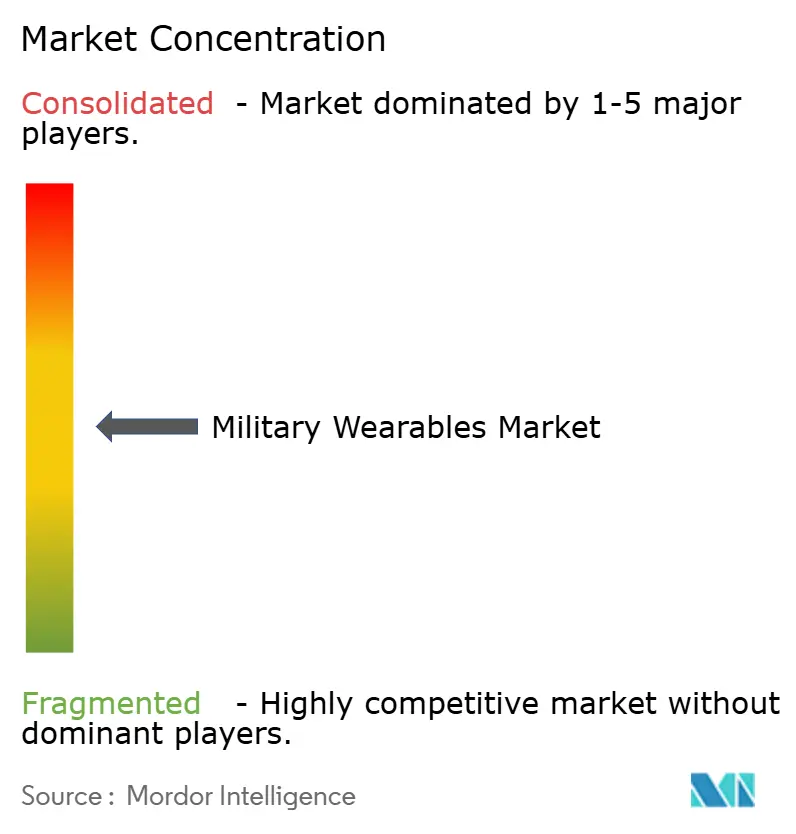
| Market Concentration | Medium |
Major Players *Disclaimer: Major Players sorted in no particular order Image © Mordor Intelligence. Reuse requires attribution under CC BY 4.0. | |
Military Wearables Market Analysis by Mordor Intelligence
The military wearables market size is projected to expand from USD 4.53 billion in 2025 and USD 4.70 billion in 2026 to USD 5.67 billion by 2031, registering a CAGR of 3.82% between 2026 and 2031. The market is moving forward on the back of steady soldier modernization budgets. That support is visible in active procurement, such as the Bundeswehr’s April 2026 call-off for additional IdZ-ES soldier systems under a broader framework through 2030.[1]Source: Rheinmetall AG, “Bundeswehr bestellt Soldatensysteme IdZ-ES bei Rheinmetall,” Rheinmetall, rheinmetall.com The military wearables market is also being shaped by a broader shift toward digitized dismounted operations, where physiological monitoring, networked displays, and integrated computing are moving from evaluation into broader field use across NATO and aligned programs. Competitive strategy in the military wearables market is changing from closed hardware stacks toward modular designs and partnership-led ecosystems, as primes defend major programs. At the same time, newer firms enter through optics, computing, and software subsystems. Regional demand remains strongest in North America, while the Asia Pacific is expanding faster as local programs aim to reduce supply dependence and build indigenous wearable capability across large ground force bases. The military wearables market still shows measured headline growth because its highest volume demand comes from stable protective and communications procurement. At the same time, the most disruptive technologies remain concentrated in smaller operational cohorts.
Key Report Takeaways
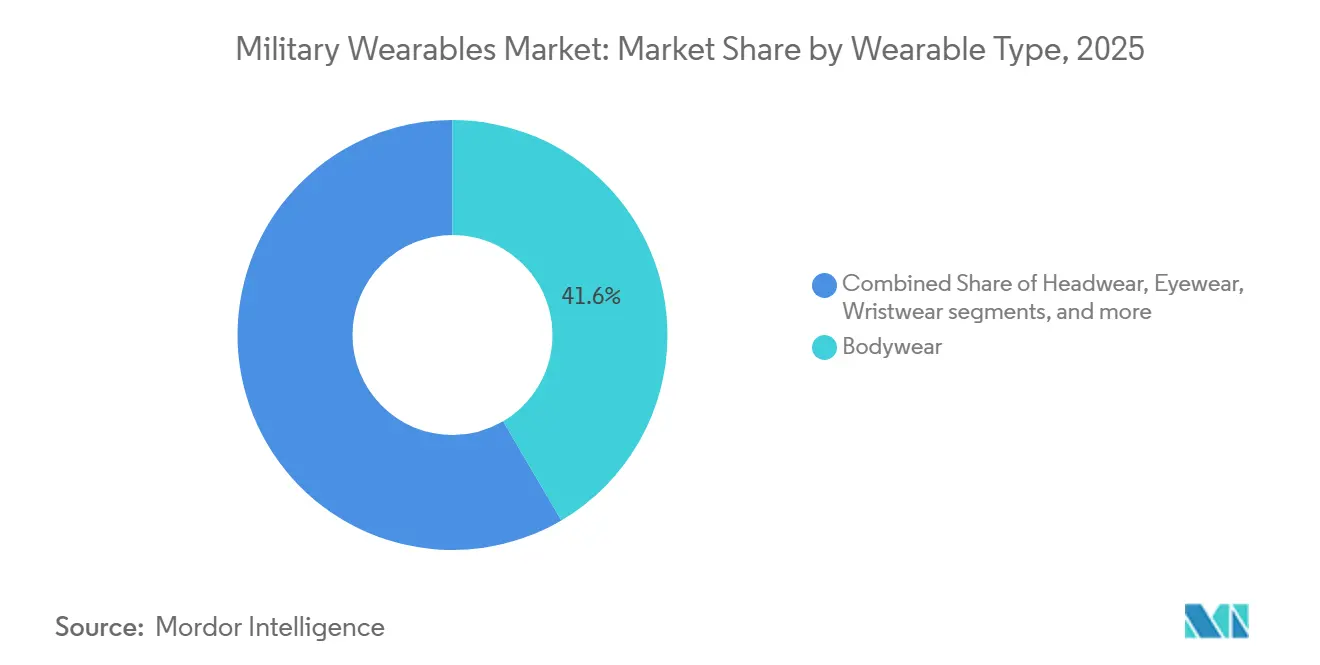
- By wearable type, bodywear held 41.55% of the military wearables market share in 2025, while exoskeletons are forecast to grow at a 6.65% CAGR through 2031.
- By application, communication and computing accounted for 37.20% of the military wearables market size in 2025, while power and energy management is projected to expand at a 5.80% CAGR through 2031.
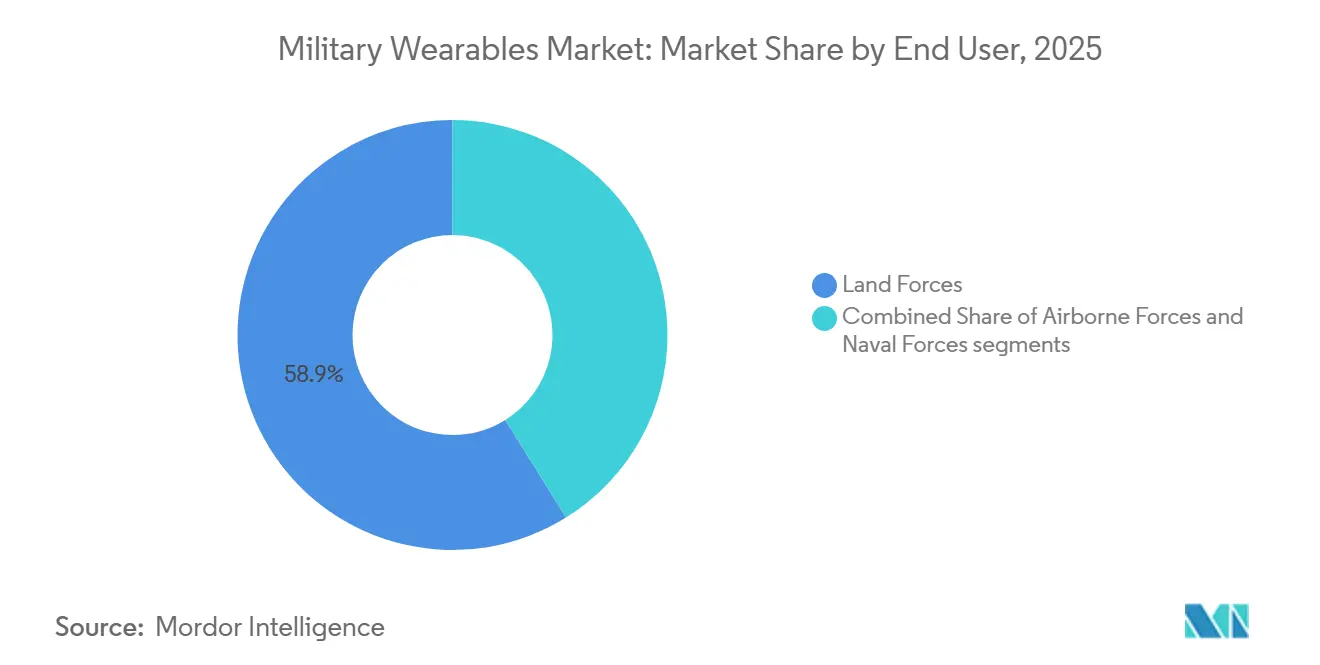
- By end user, land forces held 58.85% of the market in 2025, while airborne forces are forecast to expand at a 6.42% CAGR through 2031.
- By core technology, smart textiles captured 34.40% of the market in 2025, while wearable robotics and actuators are forecast to rise at a 7.15% CAGR through 2031.
- By geography, North America held 47.65% of the military wearables market share in 2025, while the Asia-Pacific is forecast to advance at a 6.45% CAGR through 2031.
Note: Market size and forecast figures in this report are generated using Mordor Intelligence’s proprietary estimation framework, updated with the latest available data and insights as of January 2026.
Market Trends and Insights
Drivers Impact Analysis of Military Wearables Market*
| Driver | (~) % Impact on CAGR Forecast | Geographic Relevance | Impact Timeline |
|---|---|---|---|
| Increased global investment in next-generation soldier modernization programs | +1.0% | Global | Short term (≤ 2 years) |
| Growing operational need for real-time biometric and health monitoring | +0.7% | Global, with early gains in North America and APAC | Short term (≤ 2 years) |
| Advancements in battery energy density enhancing mission endurance | +0.6% | North America and EU | Medium term (2-4 years) |
| Deployment of AI-driven sensor fusion for enhanced situational awareness | +0.4% | North America, APAC | Medium term (2-4 years) |
| Emergence of low-SWaP photonics enabling wearable directed-energy technologies | +0.3% | NATO nations, United States | Medium term (2-4 years) |
| Integration of augmented reality (AR) systems for battlefield visualization and mission planning | +0.2% | North America, spill-over to EU | Long term (≥ 4 years) |
| Source: Mordor Intelligence | |||
Increased Global Investment in Next-Generation Soldier Modernization Programs
Defense modernization spending is the clearest demand anchor for the military wearables market because several large soldier programs are now in delivery rather than concept stages. Germany moved the pace higher when Rheinmetall secured a EUR 3.1 billion (USD 3.21 billion) framework for IdZ-ES soldier systems in February 2025, covering up to 368 platoon-level equipment sets through 2030. That program received another boost in April 2026 with a EUR 1.0 billion (USD 1.21 billion) call-off order for 8,600 additional soldiers, which extended near-term visibility into demand for networked armor, night vision, and tactical computing. Canada added another clear procurement signal in May 2025 when its Department of National Defense contracted Logistik Unicorp for CAD 19.70 million (USD 14.19 million) to deliver modernized equipment for 3,000 soldiers as part of its light forces upgrade effort.[2]Source: Government of Canada, “Contract Awarded for Modernized Equipment for Canadian Army Light Forces,” Canada.ca, canada.ca These awards matter beyond the top line because each soldier system order pulls through demand for protective carriers, embedded electronics, textiles, power modules, and rugged interfaces across the military wearables market. The result is a procurement environment where large national contracts keep prime contractors central. Still, they also create a larger downstream opportunity set for subsystem vendors that can meet military qualification standards.
Growing Operational Need for Real-Time Biometric and Health Monitoring
Real-time physiological monitoring is becoming a practical capability in the military wearables market rather than a limited pilot concept. The US Army announced that the Wearable All-Hazard Remote Monitoring Program was deployed to select special operations units in late 2025 and is scheduled for broader joint-force deployment in fiscal year 2026. That shift matters because it shows that wearable systems are now expected to support training, safety, hazard awareness, and mission readiness within the same hardware environment. RTI International’s AlphaWear program integrates heat strain and infection risk monitoring into a defense-focused precision health platform.[3]Source: RTI International, “AlphaWear Wearable Platform for Military Precision Health,” RTI International, rti.org Launched in October 2025, AlphaWear is a wearable data platform for US military personnel that enables real-time tracking of heat stress, infection risk, and mental health using fitness-style devices. This technology highlights the growing role of wearables in enhancing military readiness and operational efficiency. As this capability expands, the military wearables market is separating further from consumer formats, as military designs must accommodate ballistic protection, communications gear, and contested field conditions rather than comfort-led daily use, strengthening a protected niche where defense-specific integration matters as much as sensor performance. It also raises the value of software layers that can turn raw biometric data into usable alerts without adding more hardware burden per soldier.
Integration of Augmented-Reality Systems for Battlefield Visualization
Augmented reality systems remain one of the most active investment themes in the military wearables market because they sit at the intersection of command visibility, night operations, and sensor fusion. Anduril unveiled its EagleEye modular helmet in October 2025, with partners including Meta, Qualcomm, and Gentex, and said field evaluation units were scheduled for US Army review in 2026. The appeal of these systems is not limited to the display itself, as the helmet serves as a gateway for communication, targeting, autonomous system control, and data sharing within a single wearable architecture. At the same time, the IVAS experience showed that soldier acceptance can block even a well-funded program when the form factor, visual strain, and software maturity do not align with operational use, according to the Department of Defense test record. That experience is pushing the military wearables market away from monolithic design choices and toward modular, updateable systems that can change optics, software, and compute elements without replacing the entire platform. The net effect is that battlefield visualization remains a growth area. Still, future awards are more likely to favor vendors that can prove adaptability, lower training burden, and better human factors.
Open-Standard Modular AI Accelerators Reducing SWaP for On-Edge Processing
On-body AI inference is emerging as a longer-cycle demand driver in the military wearables market, as more workloads are expected to run at the tactical edge without constant backhaul. EDT introduced its EDGETAK platform in April 2025, based on the NVIDIA Jetson Orin NX, positioning the system for wearable edge AI tasks in environments where local processing is essential. This direction matters because it reduces reliance on remote computing for threat recognition, data fusion, and mission support tasks that must operate in denied conditions. It also aligns with the broader procurement move toward modular architecture, where hardware refresh cycles can occur at the subsystem level rather than through a full-soldier-system replacement. Open interface design is evident in programs like Gentex's MOSA-compliant PURSUIT helmet, selected by the US Navy in 2026 for integration flexibility. In January 2026, Gentex Corporation announced its PURSUIT Helmet System as the Next Generation Fixed Wing Helmet (NGFWH). This USD 22 million contract modernizes aircrew equipment, addressing safety and ergonomic challenges while reinforcing Gentex's leadership in advanced protective solutions. Over time, that model can widen access for smaller compute and software suppliers in the military wearables market, even if large primes continue to control the main program shells. The practical constraint is that edge AI only adds value when its power draw, thermal load, and certification path remain acceptable for sustained field use.
Restraints Impact Analysis of Military Wearables Market*
| Restraint | (~) % Impact on CAGR Forecast | Geographic Relevance | Impact Timeline |
|---|---|---|---|
| Lack of standardized interoperability frameworks across allied forces | -0.4% | Global (NATO, APAC coalitions) | Medium term (2-4 years) |
| High cybersecurity costs outweighing ROI compared to legacy equipment | -0.3% | Global | Short term (≤ 2 years) |
| Geopolitical instability impacting lithium and critical battery material supply chains | -0.2% | NATO member states, United States | Medium term (2-4 years) |
| Rising ethical concerns over continuous biometric surveillance of soldiers | -0.1% | Global | Short term (≤ 2 years) |
| Source: Mordor Intelligence | |||
Lack of Standardized Interoperability Frameworks Across Allied Forces
Interoperability remains a structural brake on the military wearables market because coalition operations still do not operate around a single shared hardware and data standard. The US Army’s Mission Partner Kit enhanced multinational command-and-control connectivity during exercises such as Saber Strike 24 and Saber Junction 24 by enabling shared situational awareness, secure chat, voice communication, and collaboration tools. However, significant challenges persist in achieving broader coalition interoperability, particularly regarding incompatible communication networks, data-sharing protocols, classification rules, and the adoption of standardized software-based frameworks across allied formations. Europe is trying to address that gap through structured programs such as the ACHILE effort, which is working to harmonize next-generation dismounted soldier systems across multiple member states through 2027. The same push is visible in the broader European defense base, where the ARMETISS program is developing common smart garment modules across a multi-country consortium. Until these efforts translate into procurement-level interface discipline, armies will continue to face higher integration costs whenever national wearable stacks meet in joint deployments. That raises switching costs and tends to favor established cross-border suppliers over smaller specialists, which slows the pace at which the military wearables market can scale across alliances.
High Cybersecurity Costs Outweighing ROI Compared to Legacy Equipment
Cyber hardening is another important restraint in the military wearables market because every connected device increases the certification and sustainment burden. Programs that add networking, sensing, and edge computing also add testing demands around electromagnetic compatibility, system assurance, and secure software updates. The IVAS program demonstrates that rapidly changing challenges can affect schedules and production decisions, as repeated test results and necessary revisions led to delays despite significant cumulative program expenditures, especially for units that compare advanced networked wearables to legacy gear that is less capable but easier to field and maintain. Smaller firms can bring useful innovation to the military wearables market, but they often face the steepest cost challenge because compliance infrastructure is expensive and time-consuming to build. The result is a market where technical promise does not always translate into rapid adoption unless the cyber and certification cases are as strong as the operational ones.
*Our forecasts treat driver/restraint impacts as directional, not additive. The impact forecasts reflect baseline growth, mix effects, and variable interactions.
Military Wearables Market Segment Analysis
By Wearable Type:
Exoskeletons Shift From Prototype to Operational PriorityBodywear accounted for the largest share in 2025, with 41.55%, and that base still defines the center of volume in the military wearables market. This position reflects the fact that bodywear already sits at the core of protection and load carriage, which makes it the easiest layer for electronics integration to enter through existing purchasing channels. Headwear is becoming increasingly significant as helmets evolve toward modular digital architectures. Anduril's EagleEye program exemplifies this trend by integrating ballistic protection, AI-enabled vision, and command interfaces into a unified platform. Eyewear remains active through night vision and display upgrades, while wristwear and hearables continue to serve smaller but useful roles in local control, team awareness, and protected communications. The military wearables market, therefore, still depends on stable body-borne procurement for scale, even as exoskeletons attract the strongest growth narrative at the edge of the segment.
Exoskeletons are forecast to grow at a 6.65% CAGR through 2031, making them the fastest-growing category in the military wearables market within the wearable type segmentation. That pace reflects a clear shift from demonstration programs toward operational relevance, especially in missions where endurance, load carriage, and repetitive strain matter more than broad unit scale. The strongest near-term signal came from Ukraine in March 2026, when forces began using exoskeletons on the frontline to reduce strain and improve artillery loading productivity under combat conditions. In the military wearable industry, this type of live use carries more weight than lab performance because procurement agencies look for evidence that wearable support systems can work under field stress, maintenance pressure, and uncertain power conditions.


By Application:
Power and Energy Management Emerges as the Critical Constraint LayerCommunication and computing led the application split, accounting for 37.20% of the military wearables market in 2025, indicating that networked operations remain central to current demand. This category remains anchored by radios, tactical displays, and battle management interfaces that connect the individual soldier to the wider unit. Vision and surveillance continue to attract funding through night-vision and augmented display programs, while navigation and positioning are gaining weight as forces prepare for more degraded or denied-signal environments. Protection and survivability still provide the most stable volume base because they are tied to long-established procurement cycles, and health and stress monitoring is gaining ground as systems like WARP show practical value in training safety and force readiness. The military wearables market is therefore broadening across applications. However, the largest spending still follows communications, while the fastest change is occurring in how programs manage power across the full soldier kit.
Power and energy management is projected to grow at a CAGR of 5.80% through 2031, emerging as the fastest-growing application area within the military wearables market. The increase is attributed to a fundamental operational factor: each additional display, sensor, radio, or computing module raises the soldier's power requirements. The segment is gaining importance because modern soldier kits can no longer be optimized as independent devices; instead, they need shared power logic, higher battery density, and lower overall energy waste during extended missions. In the military wearable industry, energy management is moving from a support function to a core part of system design because endurance directly affects mission time, mobility, and gear weight.
By End-User:
Land Forces Command Volume, Airborne Forces AccelerateLand forces accounted for 58.85% of the market in 2025, making them the largest end-user segment in the military wearables market by a significant margin. That scale stems from the basic force structure, because the largest armies field the largest soldier populations and therefore drive the highest unit volumes for protective gear, computing, sensors, and integration kits. Land programs also shape which technologies move from evaluation to record procurement, since this user base provides the widest testing environment and the strongest basis for long-term sustainment decisions, providing established primes with an advantage, as certification history and logistics are critical to major force modernization programs.
Airborne forces are forecast to grow at a 6.42% CAGR through 2031, making them the fastest-expanding end-user group in the military wearables market. Their growth profile reflects a stronger need for lightweight capability, rapid setup, and higher function per kilogram during insertion and short-cycle operations. Naval demand remains more specialized and is tied to specific mission sets, such as aviation, shipboard communications, and maritime patrol, rather than broad formation-level standardization. The result is a split structure in which land forces continue to dominate the military wearables market through scale, while airborne procurement drives faster adoption of advanced mobility-focused architectures. This combination keeps the segment balanced between large, predictable orders and smaller but faster-moving high-performance programs.
By Core Technology:
Smart Textiles Anchor the Market, Wearable Robotics Set the PaceSmart textiles accounted for 34.40% of the market in 2025, making them the broadest current technology layer in the military wearables market. Their strength lies in the fact that fabrics, carriers, and base layers provide a practical way to integrate monitoring, power, and sensing without altering the soldier’s full external loadout. In 2025, MIT showcased a garment-integrated fiber computer for wearable activity recognition and real-time health monitoring. The technology was tested in Arctic conditions with US Army and Navy personnel during the Musk Ox II mission, highlighting its potential for smart military clothing in extreme environments. The same direction is being pursued at the program level through the ARMETISS initiative, where European partners are developing smart garments for thermoregulation, physiological monitoring, geopositioning, and armor-damage detection. The military wearables market, therefore, rests today on textile-based integration for breadth, while robotics, sensor fusion, and advanced optics define the pace of future capability change.
Wearable robotics and actuators are forecast to grow at a 7.15% CAGR through 2031, which gives them the fastest trajectory among core technologies in the military wearables market. Much of that momentum comes from the same operational logic driving exoskeleton demand, where lower strain, better load handling, and mission endurance can justify spending even for smaller user groups. Ukraine’s frontline use of exoskeletons in 2026 reinforced that robotics is moving closer to real mission value rather than just laboratory promise. AR and VR optics are also advancing through military and commercial collaboration, with Anduril and Meta linking defense requirements to commercial waveguide development to shorten upgrade cycles.
Geography Analysis
North America Military Wearables Market
North America held 47.65% of the market in 2025, giving the region the largest share of the military wearables market and of global defense wearable procurement. Its lead comes from the depth of US defense budgets, the presence of major system integrators, and a procurement base that can absorb both established primes and newer technology firms.
EMEA Military Wearables Market
Europe is seeing synchronized program activity, and that is lifting the military wearables market across both national procurement and shared industrial initiatives. The IVAS program's shift in 2025, when Anduril and Microsoft expanded their partnership for future development and cloud support, showed how quickly the region can redirect program leadership when performance expectations are not met. The UK reinforced this regional momentum in February 2026 when the MoD awarded BlackTree Technologies a contract worth up to GBP 86 million (USD 116.99 million) for the Dismounted Data System. The AI-capable system includes radios, headsets, display tablets, cables, batteries, pouches, and antennas, with deliveries to the UK Army planned in tranches from September 2026 and full rollout expected by 2027. In April 2026, Germany's IdZ-ES call-off order activated a major tranche under the February 2025 framework contract, the largest soldier-systems procurement framework for Rheinmetall and BAAINBw. The EUR 1.04 billion (USD 1.21 billion) order includes modernizing existing systems, procuring 237 additional platoon systems, and supporting subcontractors involved in IT equipment, optics, optronics, military clothing, protective gear, and related services. Regional capability building is also visible in common development projects, especially ARMETISS, which links seven nations and 20 partners around smart garment technologies. This is significant as Europe is increasing its equipment purchases but also working to establish a unified architecture and enhance local industrial capabilities for future replacement cycles. In contrast, the Middle East and Africa account for a smaller share of the overall market. However, interest in advanced optics, head-mounted systems, and localized protective manufacturing is driving selective growth opportunities for suppliers with regional partnerships.
APAC Military Wearables Market
Asia Pacific is forecast to grow at a 6.45% CAGR through 2031, making it the fastest-growing regional market for military wearables. This pace reflects rising defense budgets, stronger indigenous content rules, and the need to modernize large ground forces in contested security environments. India's F-INSAS effort, South Korea's Warrior Platform work, and China's continued investment in exoskeletons and digital soldier tools show that the region is not relying on a single model of adoption, but on several national pathways with different industrial strategies. Australia also adds relevance through battery development work that supports the longer endurance goals behind wearable deployments. The larger strategic effect is that Asia Pacific growth is building local supply capacity and demand, which may improve resilience for national programs but can also deepen interoperability gaps across the wider military wearables market.

Competitive Landscape
The military wearables market is moderately consolidated at the system integration level, where Rheinmetall, L3Harris Technologies, Saab AB, BAE Systems, Thales Group, and Lockheed Martin remain central because they already control qualification paths, program relationships, and long-term sustainment networks. Their advantage is strongest in large soldier modernization programs, where procurement offices favor proven delivery capacity over untested innovation alone. Even so, competition in the military wearables market is changing because the most valuable positions are moving from single-device supply to ownership of the broader soldier system architecture. Companies that control the integration backbone can capture follow-on work in optics, compute, communications, and software, even when individual components come from outside vendors. That is why platform partnerships and open interface claims now matter almost as much as the physical device specification.
Anduril is the clearest challenger to older program economics in the military wearables market. Its expanded IVAS partnership with Microsoft in February 2025 gave it a stronger position in a flagship US program, while its May 2025 partnership with Meta linked commercial waveguide and AI capabilities to defense wearable development. Gentex showed a similar strategic response from an established supplier when its PURSUIT helmet was selected by the US Navy, featuring a MOSA-compliant design built for future head-mounted integration. L3Harris enhanced its position in the US soldier night-vision market in 2026 when the Army selected its NOVA system for the BiNOD program under a seven-year contract valued at up to USD 465 million. This award builds on L3Harris' previous role in ENVG-B production, during which the company delivered over 20,000 units. However, the BiNOD program remains a multi-vendor initiative rather than an exclusive upgrade pathway for L3Harris.
The most open space in the military wearables market lies in biometric data platforms, conformal power systems, and low-SWaP edge computing, where primes still need specialist support. Competition is likely to remain active in these layers because procurement bodies are increasingly interested in modular insertion of new capabilities rather than relying entirely on a single proprietary stack. That makes subsystem vendors more relevant than before. However, this diminishes the role of major integrators, as final military acceptance continues to rely on program-level testing, security, and sustainment confidence. While the balance of power in the military wearables market is evolving, scale, certification, and integration remain more critical than speed alone.
Military Wearables Industry Leaders
BAE Systems plc
Lockheed Martin Corporation
Thales Group
Rheinmetall AG
Saab AB
- *Disclaimer: Major Players sorted in no particular order
Military Wearables Market Companies Covered in this Report
- BAE Systems plc
- Lockheed Martin Corporation
- Thales Group
- Elbit Systems Ltd.
- Safran SA
- Northrop Grumman Corporation
- Rheinmetall AG
- RTX Corporation
- L3Harris Technologies, Inc.
- Honeywell International Inc.
- SAAB AB
- Gentex Corporation
- Teledyne Technologies Incorporated
- Ekso Bionics Holdings, Inc.
- Black Diamond Advanced Technology, LLC

Recent Industry Developments in Military Wearables Market
- April 2026: Rheinmetall secured a EUR 1.04 billion (USD 1.21 billion) contract from the Bundeswehr for additional IdZ-ES soldier systems, under a framework agreement valued at up to EUR 3.10 billion (USD 3.21 billion). This development underscores the Bundeswehr's strategic focus on modernizing its digital battlefield capabilities. The contract highlights Rheinmetall's role in advancing integrated soldier systems, with implications for defense procurement trends and the growing importance of digital connectivity in military operations through platforms like D-LBO.
- April 2026: L3Harris Technologies was awarded a USD 465 million contract by the US Army for the Binocular Night Observation Device (BiNOD) program, emphasizing the military's focus on advanced night-vision capabilities. The NOVA system integrates innovative technology to meet long-term operational needs. This development highlights growing investments in soldier modernization, shaping procurement strategies, and reinforcing L3Harris's role in delivering critical defense solutions that enhance situational awareness across diverse operational scenarios.
- April 2026: AeroVironment's UES division secured a three-year, USD 25 million contract from the Air Force Research Laboratory (AFRL) to advance human performance technologies for field deployment. The contract transitions mid-stage sensor, diagnostic, and material systems from research to operational use. This award broadens AeroVironment's scope to include warfighter health and readiness technologies, aligning with US defense priorities such as survivability and faster transformation of laboratory innovations into deployable capabilities.
- February 2026: BlackTree Technologies secured a GBP 86 million (USD 116.99 million) contract from the UK MoD to supply AI-enabled tactical communication systems, including radios, headsets, and tablets. This development enhances battlefield decision-making and operational efficiency while reducing friendly fire risks. Tested in Estonia, the Dismounted Data System (DDS) demonstrates potential for broader NATO adoption, aligning with increased UK defense spending and fostering domestic defense industry growth through job creation and innovation.


Global Military Wearables Market Report Scope
Military wearables are body-worn, soldier-mounted, or platform-integrated systems designed to enhance communication, situational awareness, navigation, protection, health monitoring, power management, and overall operational performance for defense personnel. This report excludes general consumer wearables, non-defense fitness devices, commercial AR/VR products, and experimental wearable concepts unless specifically designed, procured, ruggedized, or integrated for military applications.
The military wearables market is segmented by wearable type, application, end-user, core technology, and geography. By wearable type, the market is segmented into headwear, eyewear, wristwear, bodywear, hearables, and exoskeletons. By application, the market is segmented into communication and computing, vision and surveillance, navigation and positioning, power and energy management, protection and survivability, and health and stress monitoring. By end user, the market is segmented into land, airborne, and naval forces. By core technology, the market is segmented into smart textiles, AR/VR optics and waveguides, AI-driven sensor fusion, energy harvesting, wearable robotics and actuators, and flexible and transparent displays. The report also covers the market sizes and forecasts for the military wearables market in major countries across different regions. For each segment, the market size is provided in terms of value (USD).
Segmentation Overview
| Headwear |
| Eyewear |
| Wristwear |
| Bodywear |
| Hearables |
| Exoskeletons |
| Communication and Computing |
| Vision and Surveillance |
| Navigation and Positioning |
| Power and Energy Management |
| Protection and Survivability |
| Health and Stress Monitoring |
| Land Forces |
| Airborne Forces |
| Naval Forces |
| Smart Textiles |
| AR/VR Optics and Waveguides |
| AI-Driven Sensor Fusion |
| Energy Harvesting |
| Wearable Robotics and Actuators |
| Flexible and Transparent Displays |
| North America | United States | |
| Canada | ||
| Mexico | ||
| Europe | United Kingdom | |
| France | ||
| Germany | ||
| Italy | ||
| Rest of Europe | ||
| Asia-Pacific | China | |
| India | ||
| Japan | ||
| South Korea | ||
| Australia | ||
| Rest of Asia-Pacific | ||
| South America | Brazil | |
| Rest of South America | ||
| Middle East and Africa | Middle East | United Arab Emirates |
| Saudi Arabia | ||
| Rest of Middle East | ||
| Africa | South Africa | |
| Rest of Africa | ||
| By Wearable Type | Headwear | ||
| Eyewear | |||
| Wristwear | |||
| Bodywear | |||
| Hearables | |||
| Exoskeletons | |||
| By Application | Communication and Computing | ||
| Vision and Surveillance | |||
| Navigation and Positioning | |||
| Power and Energy Management | |||
| Protection and Survivability | |||
| Health and Stress Monitoring | |||
| By End-User | Land Forces | ||
| Airborne Forces | |||
| Naval Forces | |||
| By Core Technology | Smart Textiles | ||
| AR/VR Optics and Waveguides | |||
| AI-Driven Sensor Fusion | |||
| Energy Harvesting | |||
| Wearable Robotics and Actuators | |||
| Flexible and Transparent Displays | |||
| By Geography | North America | United States | |
| Canada | |||
| Mexico | |||
| Europe | United Kingdom | ||
| France | |||
| Germany | |||
| Italy | |||
| Rest of Europe | |||
| Asia-Pacific | China | ||
| India | |||
| Japan | |||
| South Korea | |||
| Australia | |||
| Rest of Asia-Pacific | |||
| South America | Brazil | ||
| Rest of South America | |||
| Middle East and Africa | Middle East | United Arab Emirates | |
| Saudi Arabia | |||
| Rest of Middle East | |||
| Africa | South Africa | ||
| Rest of Africa | |||


Key Questions Answered in the Report
What is the expected value of the military wearables market by 2031?
The military wearables market is forecast to reach USD 5.67 billion by 2031, rising from USD 4.70 billion in 2026 at a 3.82% CAGR.
Which wearable type is growing the fastest in defense applications?
Exoskeletons are projected to post the fastest growth within wearable type segmentation, with a 6.65% CAGR through 2031.
Which application area currently leads spending on military wearables?
Communication and computing led application demand with 37.20% share in 2025, reflecting the central role of networking and command connectivity.
Which armed service segment creates the largest demand base?
Land forces accounted for 58.85% of demand in 2025 due to their larger force size and their role in broad soldier modernization programs.
Which region is expanding the fastest for military wearable adoption?
Asia Pacific is forecast to grow the fastest at a 6.45% CAGR through 2031, supported by indigenous programs and large ground force modernization.
What technology layer has the widest current commercial use in military wearables?
Smart textiles led core technology with 34.40% share in 2025 because they offer a practical path to integrate sensing and monitoring into existing gear.
Page last updated on:


