5G Technology Market Size and Share
Market Overview
| Study Period | 2020 - 2031 |
|---|---|
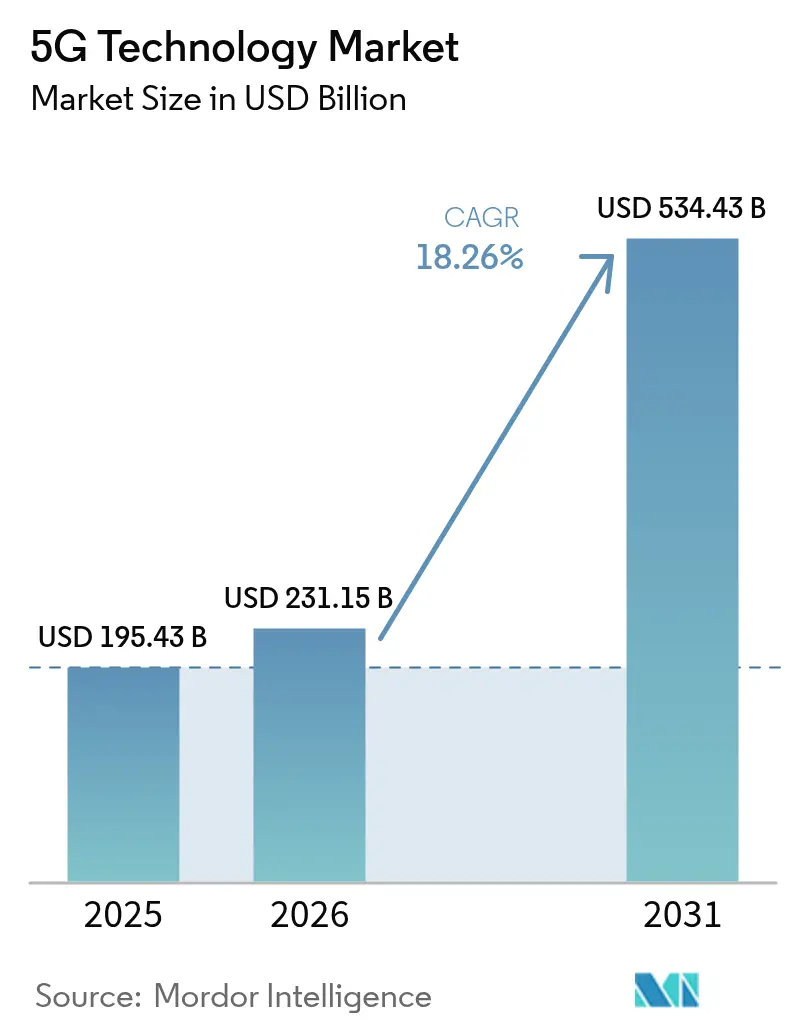
| Market Size (2026) | USD 231.15 Billion |
| Market Size (2031) | USD 534.43 Billion |
| Growth Rate (2026 - 2031) | 18.26% CAGR |
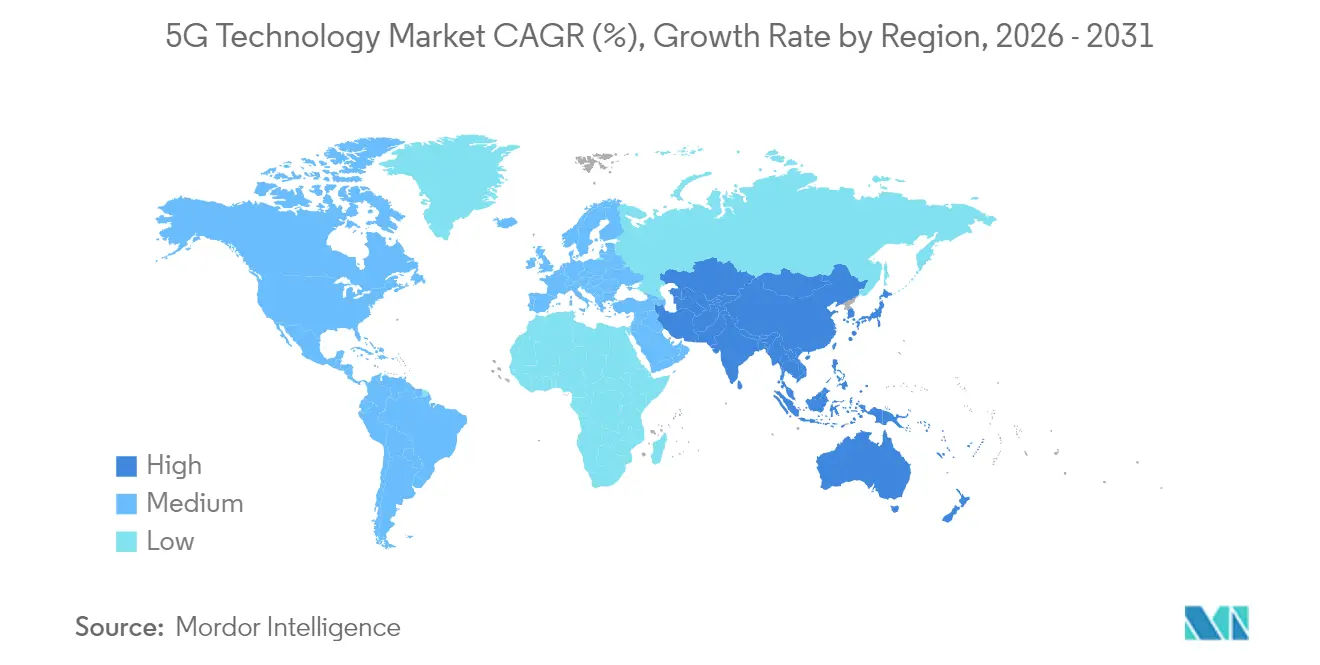
| Fastest Growing Market | Asia Pacific |
| Largest Market | Asia Pacific |
| Market Concentration | Medium |
Major Players *Disclaimer: Major Players sorted in no particular order Image © Mordor Intelligence. Reuse requires attribution under CC BY 4.0. | |
5G Technology Market Analysis by Mordor Intelligence
The 5G Technology market size is expected to grow from USD 195.43 billion in 2025 to USD 231.15 billion in 2026 and is forecast to reach USD 534.43 billion by 2031 at 18.26% CAGR over 2026-2031. Heightened enterprise demand for ultra-reliable low-latency links, massive machine-type communications, and cloud-native core deployments is accelerating mainstream adoption of commercial networks. Hardware outlays remain substantial, yet managed services, network-as-a-service models, and software-defined functions are steadily shifting revenue toward recurring operational streams. Asia Pacific maintains global leadership through coordinated government programs and large-scale operator investments, while North America and Europe prioritize spectrum sharing and energy-efficient architectures. As spectrum refarming, open interfaces, and edge compute mature, the 5G technology market is positioned to capture new value pools across automotive, industrial automation, and immersive media.
Key Report Takeaways
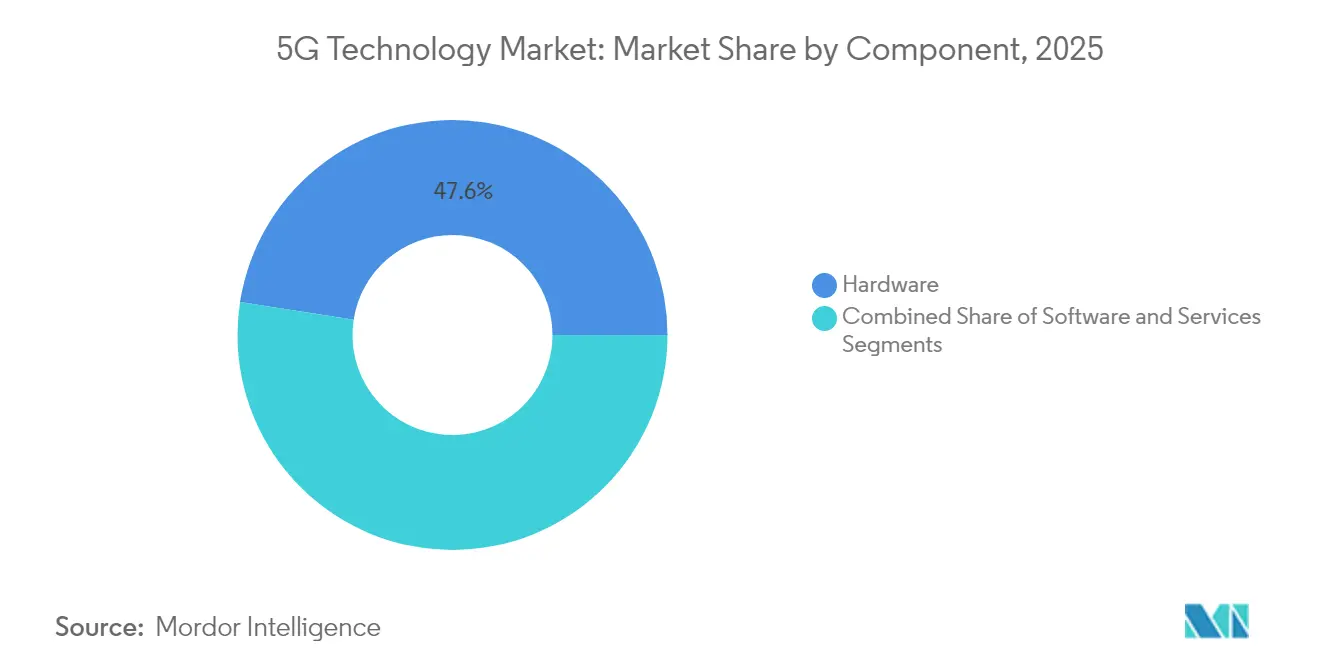
- By component, hardware accounted for 47.55% of the 5G technology market share in 2025, while services are projected to register the fastest 19.55% CAGR through 2031.
- By spectrum band, sub-6 GHz commanded 60.70% of the 5G technology market size in 2025. Hybrid Sub-6 GHz + mmWave implementations are advancing at a 20.95% CAGR to 2031.
- By application, enhanced mobile broadband (eMBB) led with 38.95% revenue share in 2025, whereas ultra-reliable low-latency communications (URLLC) are growing at 21.60% CAGR.
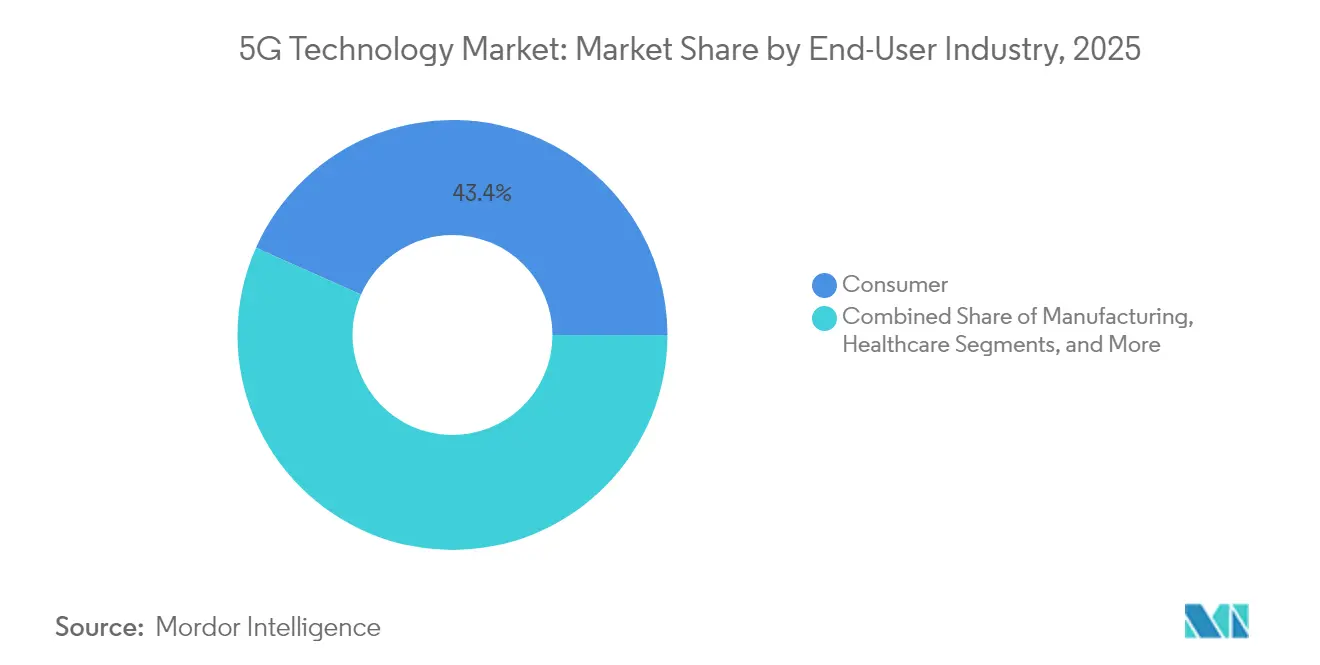
- By end-user, consumer use cases held 43.35% share in 2025, while the automotive segment exhibits an 18.65% CAGR through 2031.
- By architecture, non-stand-alone networks retained a 62.50% share in 2025; stand-alone deployments are climbing at a 20.45% CAGR.
- By geography, the Asia Pacific captured 41.05% of the 5G technology market share in 2025 and is forecast to expand at a 22.05% CAGR.
Note: Market size and forecast figures in this report are generated using Mordor Intelligence’s proprietary estimation framework, updated with the latest available data and insights as of 2026.
Global 5G Technology Market Trends and Insights
Drivers Impact Analysis*
| Driver | (~) % Impact on CAGR Forecast | Geographic Relevance | Impact Timeline |
|---|---|---|---|
| Sustained increase in connected devices | +4.2% | Global, with APAC leading IoT adoption | Medium term (2-4 years) |
| Component-level cost reductions (RF-front end, SiGe PAs) | +3.8% | Global, accelerated in emerging markets | Short term (≤ 2 years) |
| Superior latency and bandwidth versus 4G | +3.5% | Global, enterprise-focused regions | Medium term (2-4 years) |
| Rise of virtualized and cloud-native cores | +2.9% | North America and Europe early, APAC following | Long term (≥ 4 years) |
| Open-RAN capex savings in emerging markets | +2.1% | APAC, Latin America, Africa | Medium term (2-4 years) |
| Spectrum-sharing frameworks unlocking rural coverage | +1.8% | North America, Europe regulatory leadership | Long term (≥ 4 years) |
| Source: Mordor Intelligence | |||
Sustained Increase in Connected Devices
Cellular IoT connections are projected to surpass 5.9 billion by 2030, intensifying capacity requirements on public and private networks [1]GSMA, “Mobile Economy 2024,” gsma.com. Manufacturing plants are scaling predictive maintenance and automated inspection, while smart-city traffic and environmental sensors multiply data flows. Edge compute caches time-critical analytics locally, lowering backhaul loads and reducing latency. Private networks are displacing Wi-Fi inside hazardous facilities where deterministic performance and intrinsic security are mandatory. This device surge drives compounding data traffic that underpins sustained spending across radio, transport, and cloud domains in the 5G technology market.
Component-Level Cost Reductions in RF Front-End and SiGe Power Amplifiers
Silicon-germanium power-amplifier innovations have cut manufacturing costs by nearly 30% since 2024, lowering price points for mid-tier 5G smartphones and CPEs. Advanced multi-chip packaging integrates filters, LNAs, and switches, improving yields and shrinking board footprints. As gallium-arsenide alternatives migrate to CMOS processes, Sub-6 GHz radio units balance performance with affordability for emerging-market carriers. Supply-chain diversification away from single-source foundries is spurring competitive bids that further compress equipment capex. Collectively, these efficiencies expand addressable demand and reinforce scale advantages for component suppliers throughout the 5G technology market.
Superior Latency and Bandwidth Performance Versus 4G Networks
Native 5G ultra-reliable low-latency communication (URLLC) profiles reach sub-1 ms delays, enabling precise robotic motion control, cooperative vehicle maneuvers, and remote telesurgery [2]3GPP, “Release 18 URLLC Enhancements,” 3gpp.org. Carrier edge clouds place compute within 10 km of endpoints, trimming round-trip propagation time and supporting 8K mobile streaming and cloud gaming. Network slicing gives operators monetizable service tiers that enforce throughput and jitter guarantees. In dense metros, 5G alleviates congested 4G cells, stabilizing video bitrates during peak periods. As enterprises quantify downtime costs, latency as a service becomes a premium monetization vector for the 5G technology market.
Rise of Virtualized and Cloud-Native 5G Cores
Containerized network functions detach software from proprietary appliances, cutting provisioning cycles from months to days [3]Nokia, “Cloud-Native 5G Core White Paper,” nokia.com. Automated CI/CD pipelines update microservices without disruptive reboots, heightening uptime and security. Hyperscale cloud partnerships let regional carriers elastically burst capacity during events without overbuilding. Edge-native user planes de-tunnel traffic locally, lowering transport costs and improving application responsiveness. These cloud attributes democratize deployment, enabling smaller operators and vertical specialists to enter the 5G technology market with limited capex.
Restraints Impact Analysis*
| Restraint | (~) % Impact on CAGR Forecast | Geographic Relevance | Impact Timeline |
|---|---|---|---|
| Fragmented spectrum allocations | -2.8% | Global, with regional variations | Long term (≥ 4 years) |
| Energy consumption per bit vs sustainability targets | -2.1% | Europe leading, global following | Medium term (2-4 years) |
| Security liabilities in hyper-dense networks | -1.9% | Global, enterprise-focused | Short term (≤ 2 years) |
| Persistent standards delays beyond 3GPP Rel-19 | -1.4% | Global standardization impact | Long term (≥ 4 years) |
| Source: Mordor Intelligence | |||
Fragmented Spectrum Allocations
Incoherent regional band plans oblige OEMs to produce multiband devices, inflate BOM costs, and slow scale economics. Cross-border trucking corridors suffer roaming glitches when user equipment hops between mismatched carriers. Cash-intensive auctions lock spectrum behind incumbents, dampening competitive build-outs in underserved rural pockets. Advanced interference coordination adds planning complexity and pushes small-cell densification costs higher. These friction points temper deployment velocity, although regulatory harmonization initiatives under WRC-23 aim to narrow gaps over the next decade.
Energy Consumption Per Bit Versus Sustainability Targets
A 5G macro site can draw 3-4× the energy of a comparable 4G eNodeB, inflating opex and carbon footprints [4]GSMA, “Energy Efficiency in Future Networks,” gsma.com. Dense urban grids require clusters of micro-cells that stack cooling loads during summer peaks. Renewable micro-grids struggle with power-quality tolerances demanded by radio heads and edge servers. European carriers linking executive compensation to emissions intensity confront difficult trade-offs between coverage ambitions and ESG pledges. Consequently, vendors race to commercialize AI-assisted sleep modes, gallium-nitride PAs, and liquid-cooling enclosures to realign energy budgets within acceptable limits for the 5G technology market.
*Our forecasts treat driver/restraint impacts as directional, not additive. The impact forecasts reflect baseline growth, mix effects, and variable interactions.
Segment Analysis
By Component: Hardware Dominance Faces Services Disruption
Hardware captured 47.55% of the 5G technology market share in 2025 as operators procured radio units, antennas, and transport routers for nationwide roll-outs. High-power massive-MIMO radios and fiber backhaul lines continue to attract capital, yet year-on-year growth is plateauing. Services revenue is expanding 19.55% CAGR as operators outsource orchestration, cloud management, and network-slice monetization. Vendor roadmaps now bundle installation, optimization, and subscription-based analytics that convert one-time hardware deals into annuities. Open-RAN disaggregation lets carriers mix baseband software from one supplier with radios from another, eroding traditional vendor lock-ins. Hyperscalers deliver telco cloud platforms that shift traffic steering and policy control into subscription software, intensifying competition.
The 5G technology market increasingly rewards integrators that bridge heterogeneous gear, manage continuous software releases, and guarantee KPIs under SLAs. Hardware vendors respond by embedding AI accelerators, integrated backhaul, and remote-electrical-tilt controls to defend their share. Meanwhile, regional tower companies layer managed services on neutral host infrastructure, giving enterprises and MVNOs modular entry points. The pivot to services broadens ecosystem participation, but also fragments accountability, raising interoperability testing overhead.


By Spectrum Band: Sub-6 GHz Leadership Challenged by Hybrid Solutions
Sub-6 GHz assets constituted 60.70% of the 5G technology market size in 2025 due to favorable propagation and reuse of existing macro-grid sites. Mid-band delivers a balance of 100-200 MHz contiguous bandwidth with kilometer-scale reach, ideal for nationwide coverage. Operators, however, chase urban capacity through hybrid layering of 400 MHz-wide mmWave channels, propelling a 20.95% CAGR for mixed deployments. Beam-steered mmWave small cells pop up on streetlights and transit shelters to offload stadium crowds and fixed-wireless households.
Dynamic spectrum sharing (DSS) repurposes idle LTE carriers for 5G, mitigating auction sticker shock. U.S. CBRS and European shared-access frameworks unlock enterprise micro-networks inside factories and ports. As regulators harmonize the 6 GHz upper mid-band, device makers are designing triple-band modems to roam seamlessly. The evolutionary roadmap suggests Sub-6 GHz anchors nationwide mobility, while mmWave and future terahertz allocations address hot-spot Gigabit throughput, creating a layered spectrum strategy across the 5G technology market.
By Application: eMBB Dominance Yields to URLLC Innovation
Enhanced mobile broadband accounted for 38.95% of 2025 revenue as video streaming, social media, and cloud gaming flourished on faster downlinks. Yet URLLC workloads are scaling at a 21.60% CAGR, catalyzed by Industry 4.0 robotics, cooperative platooning, and mission-critical healthcare. Operators monetize URLLC through tiered SLAs that guarantee jitter and packet-error rates, commanding enterprise premiums. Massive machine-type communications (mMTC) anchors smart-city lighting, agriculture telemetry, and utility metering, where unit ARPU is low but device counts are immense.
Fixed wireless access fills suburban broadband gaps where fiber economics falter, leveraging outdoor CPE with carrier-grade antenna arrays. Augmented/virtual reality training and remote assistance require both eMBB bandwidth and URLLC latency, blending slices for composite quality of service. Regulators fast-track vehicle-to-everything standards, positioning automotive partners to integrate over-the-air updates and sensor fusion streams. This evolving mix of consumer and industrial traffic diversifies risk and sustains multi-segment revenue within the 5G technology market.
By End-User Industry: Consumer Base Supports Automotive Acceleration
Smartphones and home CPE generated 43.35% of 2025 revenue, reflecting habitual upgrade cycles, bundled data plans, and streaming content partnerships. As device saturation nears, carriers pivot marketing toward cross-bundle value such as cloud storage and edge-accelerated gaming. Automotive connectivity is surging at an 18.65% CAGR: infotainment, predictive maintenance, and over-the-air firmware now ship standard on mid-range vehicles. Highway agency pilots validate V2X safety beacons, while fleet operators adopt 5G-enabled telematics to optimize routing and emissions compliance.
Manufacturing plants deploy private slices for time-sensitive networking and AGV guidance that cannot tolerate Wi-Fi roaming gaps. Healthcare labs' instrument imaging devices with secure uplinks to AI diagnostic clouds, although regulatory clearance slows mass roll-outs. Energy utilities connect smart inverters and distributed storage nodes, aligning with renewables integration targets. The consumer segment still underpins traffic volumes, yet vertical-specific ROI cases are unlocking diversified growth channels throughout the 5G technology market.
By Network Architecture: NSA Pragmatism Transitions to SA Innovation
Non-stand-alone deployments leveraged 4G evolved packet cores to accelerate time-to-market, claiming 62.50% share in 2025. Operators exploited existing spectrum anchors, radios, and OSS/BSS stacks, easing early capex. However, stand-alone cores are growing 20.45% CAGR as enterprises demand deterministic slicing, local breakout, and URLLC profiles. SA enables cloud-native orchestration, dual registration, and in-network edge services that NSA cannot replicate.
Manufacturers select private SA networks to isolate OT traffic from public mobility domains, ensuring security compliance and lifecycle control. Public carriers gradually refarm LTE anchor bands to full NR, freeing spectrum and simplifying radio roadmaps. Migration complexity centers on VoNR roaming, Lawful Intercept, and legacy billing integrations. Vendors offer dual-mode cores that toggle NSA and SA sessions, smoothing transitions across the 5G technology market until critical mass warrants pure SA operation.
Geography Analysis
Asia Pacific held 41.05% of the 5G technology market in 2025, fueled by decisive government policies, operator scale, and vibrant device ecosystems. China added over 1 million 5G base stations in 2024, capturing manufacturing synergies and reducing per-node costs. South Korea leads commercial SA coverage, monetizing cloud gaming passes and VR concerts. Japan’s multi-operator RAN sharing lowers redundancy and accelerates coverage along high-speed rail lines. India’s USD 19 billion spectrum auction in 2024 pushed carriers to optimize capex through neutral-host towers and network-sharing MOUs. ASEAN countries leverage multilateral financing to build export-oriented industrial parks, boosting regional demand across the 5G technology market.
North America ranks second by revenue as early movers exploit mid-band spectrum cleared under the FCC’s 5G FAST Plan. Stadium mmWave overlays deliver multi-gigabit uplinks for live video, while rural fixed wireless substitutes fiber for last-mile broadband. The US enterprises in logistics, petrochemicals, and healthcare pilot private slices with local breakout edge nodes to satisfy data-sovereignty requirements. Canada coordinates spectrum releases and tower-sharing mandates that rationalize build-out costs across sparsely populated territories. Mexico taps cross-border value chains to adopt 5G robotics inside maquiladora plants, illustrating spill-over effects into Latin America’s nascent 5G technology market.
Europe records consistent uptake backed by Digital Decade benchmarks and green-deal energy mandates. Germany’s automotive clusters orchestrate campus networks for precision welding and battery-cell assembly. The Nordics integrate renewable-powered base stations and AI sleep-mode schedulers to shrink energy intensity. Cross-border freight corridors pilot multi-operator edge roaming to maintain continuous URLLC coverage. Data privacy laws such as GDPR drive selective vendor sourcing and encryption policies, elevating compliance overhead. Overall, regulatory predictability and sustainability priorities shape Europe’s differentiated trajectory within the global 5G technology market.

Competitive Landscape
The vendor arena exhibits moderate concentration: three integrated suppliers deliver roughly 60% of global RAN shipments, yet open interfaces and white-box radios invite niche entrants. Traditional OEMs bundle cloud-native cores, AI-driven analytics, and lifecycle services to defend incumbency. Strategic alliances with hyperscalers supply scalable telco cloud backplanes that speed application roll-outs. Patent-licensing revenues from standard-essential portfolios fund next-generation chipset research.
Open-RAN consortia standardize fronthaul and management APIs, lowering barriers for semiconductor start-ups and regional system integrators. Emerging-market operators embrace disaggregation to slash vendor lock-in and spread capex. Radio silicon advances, such as integrated digital beamforming ICs, compress unit costs and encourage multi-band radio adoption. Software-only start-ups focus on RIC xApps that dynamically optimize spectral efficiency, forging a layered competitive field inside the 5G technology market.
Meanwhile, incumbent carriers consolidate volume with multi-year frame contracts that embed upgrade paths from NSA to SA, cementing vendor roadmaps. Equipment suppliers court private-network customers through industrial-certified radios, ruggedized small cells, and OT-centric security packages. Regional policy scrutiny on supply-chain security continues to influence sourcing decisions and reshapes global share allocations over the forecast horizon.
5G Technology Industry Leaders
Huawei Technologies Co., Ltd.
Telefonaktiebolaget LM Ericsson (Ericsson)
Nokia Corporation
Qualcomm Incorporated
Samsung Electronics Co., Ltd.
- *Disclaimer: Major Players sorted in no particular order


Recent Industry Developments
- February 2025: Nokia completed a USD 2.3 billion acquisition of Infinera’s optical networking division to strengthen 5G backhaul and edge transport offerings.
- October 2024: Ericsson secured a USD 14 billion multi-year agreement with Verizon to modernize 5G infrastructure, including Open-RAN-ready radios and cloud-native core functions.
- April 2024: Samsung Electronics committed USD 6.6 billion to expand semiconductor lines dedicated to 5G automotive and industrial chipsets.


Global 5G Technology Market Report Scope
The Global 5G Market Landscape analyzes the overall market landscape of the 5G industry, with detailed coverage on 5G Adoption (Macro cell-Site, Small cell site), 5G Connections (Mobile Broadband, Fixed Wireless Access, M2M&IoT, Mission Critical), 5G Devices (by form factor(smartphone, CPE(indoor, outdoor), modules, hotspot, laptops, industrial grade ), by spectrum support (sub-6 GHz, mmwave), 5G Chipset (by IC type (RFIC, ASIC, mmWave IC, cellular IC), by Deployment (device, CPE, network infrastructure) and by region.
The market sizes and forecasts are provided in terms of value (USD million) for all the above segments.
| Hardware |
| Software |
| Services |
| Sub-6 GHz |
| mmWave |
| Hybrid (Sub-6+mmWave) |
| eMBB |
| FWA |
| mMTC |
| URLLC |
| Consumer |
| Manufacturing |
| Healthcare |
| Automotive |
| Energy and Utilities |
| Media and Entertainment |
| Public Safety and Defense |
| Stand-Alone (SA) |
| Non-Stand-Alone (NSA) |
| North America | United States |
| Canada | |
| Mexico | |
| South America | Brazil |
| Argentina | |
| Rest of South America | |
| Europe | Germany |
| United Kingdom | |
| France | |
| Italy | |
| Spain | |
| Russia | |
| Rest of Europe | |
| Asia Pacific | China |
| Japan | |
| India | |
| South Korea | |
| Australia and New Zealand | |
| Rest of Asia Pacific | |
| Middle East | GCC |
| Turkey | |
| Rest of Middle East | |
| Africa | South Africa |
| Nigeria | |
| Rest of Africa |
| By Component | Hardware | |
| Software | ||
| Services | ||
| By Spectrum Band | Sub-6 GHz | |
| mmWave | ||
| Hybrid (Sub-6+mmWave) | ||
| By Application | eMBB | |
| FWA | ||
| mMTC | ||
| URLLC | ||
| By End-User Industry | Consumer | |
| Manufacturing | ||
| Healthcare | ||
| Automotive | ||
| Energy and Utilities | ||
| Media and Entertainment | ||
| Public Safety and Defense | ||
| By Network Architecture | Stand-Alone (SA) | |
| Non-Stand-Alone (NSA) | ||
| By Geography | North America | United States |
| Canada | ||
| Mexico | ||
| South America | Brazil | |
| Argentina | ||
| Rest of South America | ||
| Europe | Germany | |
| United Kingdom | ||
| France | ||
| Italy | ||
| Spain | ||
| Russia | ||
| Rest of Europe | ||
| Asia Pacific | China | |
| Japan | ||
| India | ||
| South Korea | ||
| Australia and New Zealand | ||
| Rest of Asia Pacific | ||
| Middle East | GCC | |
| Turkey | ||
| Rest of Middle East | ||
| Africa | South Africa | |
| Nigeria | ||
| Rest of Africa | ||


Key Questions Answered in the Report
How large is the 5G technology market in 2026 and how fast is it growing?
The market stands at USD 231.15 billion in 2026 and is projected to reach USD 534.43 billion by 2031, advancing at an 18.26% CAGR.
Which region contributes the highest revenue to 5G deployments?
Asia Pacific leads with 41.05% of global revenue in 2025 and is expanding at a 22.05% CAGR through 2031.
Which 5G application segment is growing the fastest?
Ultra-reliable low-latency communications is expanding at a 21.60% CAGR due to industrial automation and autonomous mobility use cases.
Why are operators transitioning from non-stand-alone to stand-alone architectures?
Stand-alone cores enable network slicing, edge computing, and deterministic latency, unlocking premium enterprise revenue streams.
What is driving strong adoption of 5G in the automotive sector?
Connected infotainment, vehicle-to-everything safety services, and over-the-air updates are pushing automotive deployments at an 18.65% CAGR.
What are the main barriers to faster 5G roll-outs?
Fragmented spectrum allocations and high energy consumption per site remain key obstacles impacting long-term deployment economics.
Page last updated on:


