5G Core Network Market Size and Share
Market Overview
| Study Period | 2023 - 2031 |
|---|---|
| Market Size (2026) | USD 6.32 Billion |
| Market Size (2031) | USD 16.05 Billion |
| Growth Rate (2026 - 2031) | 20.45% CAGR |
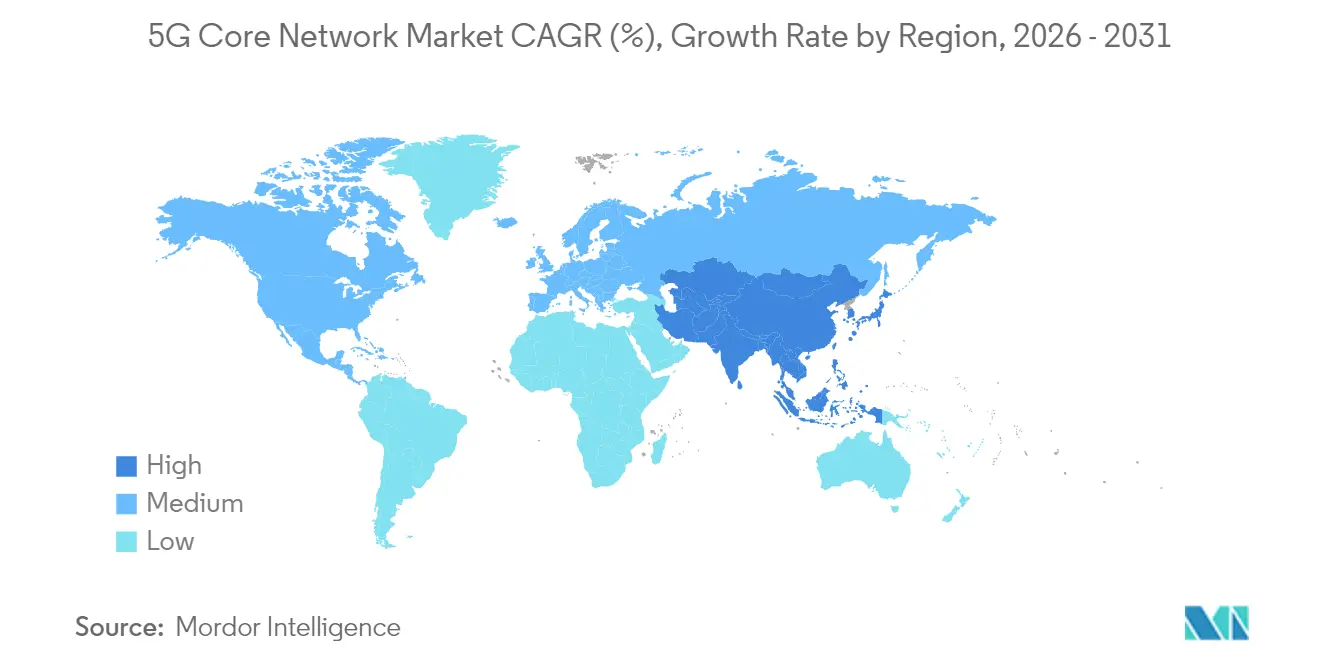
| Fastest Growing Market | Asia Pacific |
| Largest Market | Asia Pacific |
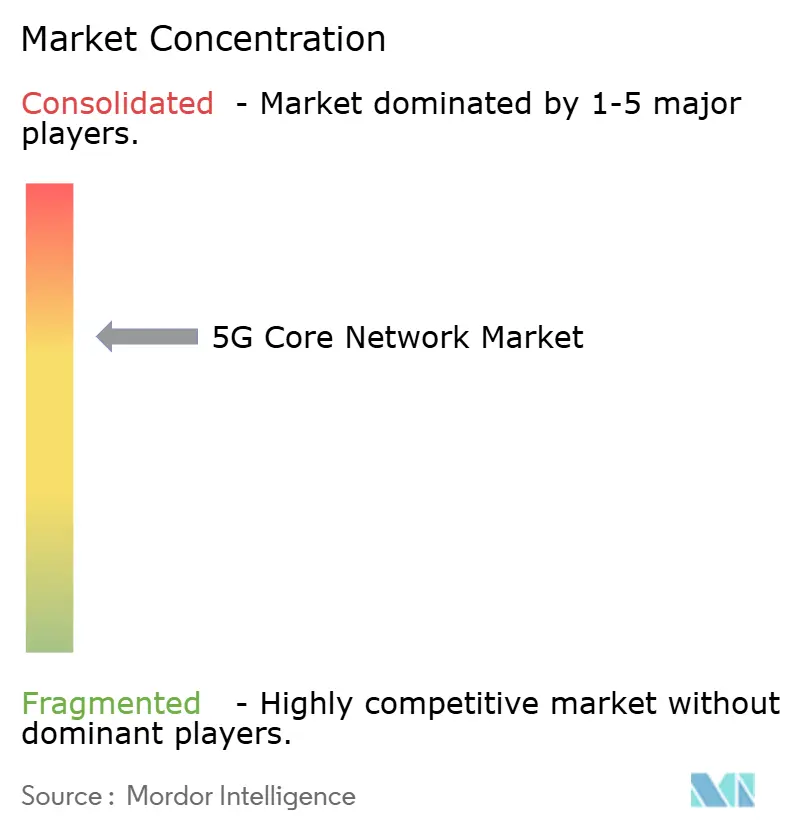
| Market Concentration | Medium |
Major Players *Disclaimer: Major Players sorted in no particular order Image © Mordor Intelligence. Reuse requires attribution under CC BY 4.0. | |

5G Core Network Market Analysis by Mordor Intelligence
The 5G Core Network Market size was valued at USD 5.25 billion in 2025 and estimated to grow from USD 6.32 billion in 2026 to reach USD 16.05 billion by 2031, at a CAGR of 20.45% during the forecast period (2026-2031).
Rapid movement from non-stand-alone toward stand-alone architectures is the key catalyst because operators can then monetize network slicing, ultra-low latency, and API exposure. Cloud-native, service-based design is converging with enterprise digitization, and 86% of operators intend to run common 4G/5G cores to trim operating complexity. Operator-to-hyperscaler alliances such as Ericsson–Google Cloud demonstrate how carrier-grade reliability now coexists with elastic public cloud scale. Meanwhile, Asia Pacific’s early investment in 5G-Advanced and India’s rapid SA expansions highlight how first-mover coverage advantages translate into traffic off-load efficiency and premium service revenues. Vendor competition has intensified as Ericsson secured major replacement wins at Three UK, displacing Nokia and Microsoft, and raising throughput capability to 9 Tbps.
Key Report Takeaways
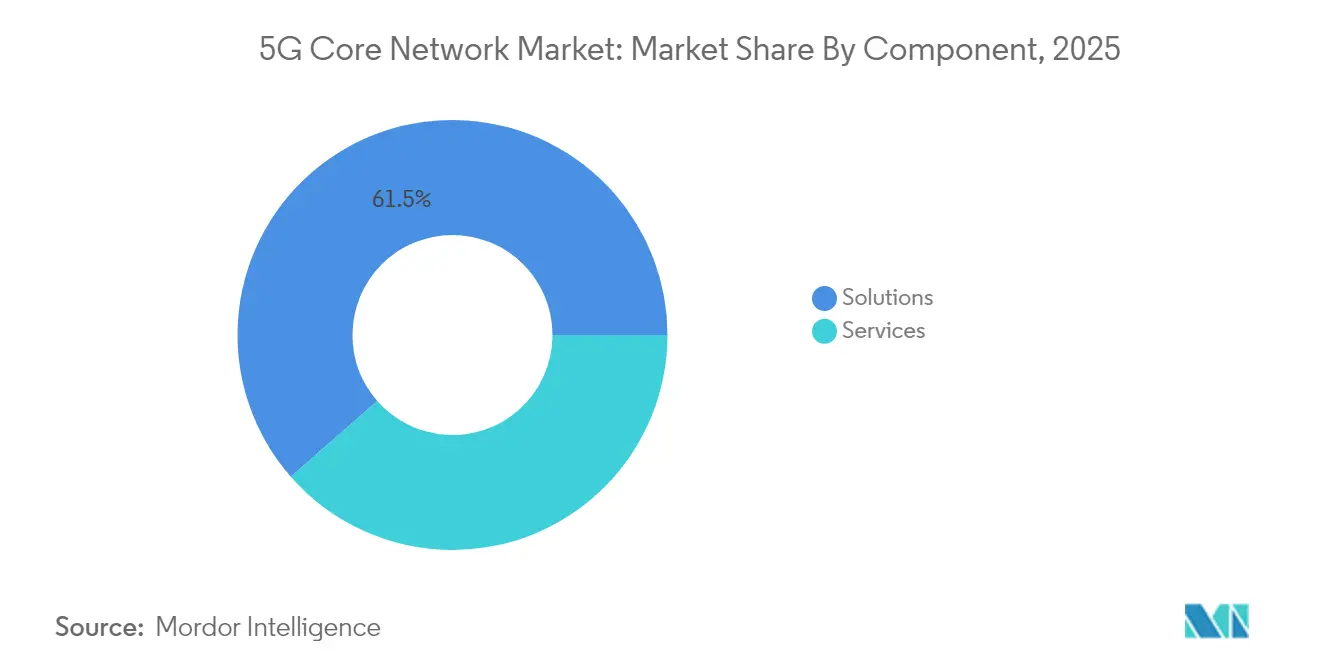
- By component, solutions captured 61.45% of the 5G core network market share in 2025; services are forecast to expand at a 26.58% CAGR through 2031.
- By deployment model, on-premise accounted for 53.65% share of the 5G core network market size in 2025, while public cloud is set to climb at a 31.05% CAGR to 2031.
- By End user, telecom operators held 71.85% share of the 5G core network market size in 2025, whereas the enterprise segment is expected to grow at 27.95% CAGR.
- By Network function, the user plane function led with 20.55% of the 5G core network market share in 2025; the network exposure function shows the fastest 33.6% CAGR outlook.
- By Geography, Asia Pacific dominated with a 39.15% revenue share in 2025 and is also projected to advance at a 18.72% CAGR through 2031.
Note: Market size and forecast figures in this report are generated using Mordor Intelligence’s proprietary estimation framework, updated with the latest available data and insights as of 2026.
Global 5G Core Network Market Trends and Insights
Drivers Impact Analysis*
| Driver | (~) % Impact on CAGR Forecast | Geographic Relevance | Impact Timeline |
|---|---|---|---|
| Accelerated stand-alone 5G roll-outs | 6.20% | Global, APAC leading | Medium term (2–4 years) |
| Explosion of ultra-low-latency apps | 4.80% | North America & Europe enterprise, APAC consumer | Short term (≤2 years) |
| Proliferation of massive IoT connections | 3.50% | Global industrial hubs | Long term (≥4 years) |
| Telco shift to cloud-native SBA | 4.10% | North America & Europe leading, APAC following | Medium term (2–4 years) |
| Source: Mordor Intelligence | |||
Accelerated Stand-Alone 5G Roll-outs
More than 60 service providers had public SA networks live by 2024, and global SA subscriptions are forecast to top 3.6 billion by 2030, equal to nearly 60% of all 5G connections. T-Mobile showed real-world network slicing for police body cameras, while Singtel added consumer cybersecurity slices. Dual-mode cores lower migration risk, and Dell’Oro predicts 15% growth in core shipments for 2025 as virtual functions convert to cloud-native. Early adopters such as China with 77.1% SA reach and India with 51.1% coverage illustrate how SA unlocks competitive service differentiation.
Explosion of Ultra-Low-Latency Apps
Sub-10 ms latency demands push user plane traffic closer to the edge and make the user plane function central. Manufacturing pilots at Midea Thailand showed 15-20% line efficiency gains through AI robots on private 5G networks[1]Mats Granryd, “The Mobile Economy Asia Pacific 2025,” GSMA, gsma.com. T-Mobile’s L4S upgrade improved streaming quality during congestion. The US Department of Defense plans private 5G across 800 bases, underscoring mission-critical demand with open-RAN security requirements. As APIs expose latency classes, network exposure function revenue accelerates in tandem.
Proliferation of Massive IoT Connections
Private LTE/5G networks are forecast to surge from 4,000 in 2022 to beyond 60,000 by 2028 with USD 9.2 billion enterprise spend. China is likely to host 45% of global deployments, leveraging 5G RedCap for cost-effective IoT. Toyota Material Handling and CJ Logistics recorded predictive maintenance and inventory automation gains on Ericsson slices. AI-assisted policy control allocates resources on demand, and network slicing ensures IoT traffic isolation.
Telco Shift to Cloud-Native SBA
3GPP SBA allows micro-services to communicate via open APIs, simplifying multi-vendor integration. Ericsson’s partnership with Google Cloud now offers a carrier-grade, on-demand core with automated Kubernetes life cycle and elastic scaling. AT&T collapsed multiple mobility cores onto Microsoft Azure, cutting cost per terabyte by 70%. O2 Telefónica executed the world’s first in-service core software upgrade without user disruption, demonstrating live network agility.
Restraints Impact Analysis*
| Restraint | (~) % Impact on CAGR Forecast | Geographic Relevance | Impact Timeline |
|---|---|---|---|
| High up-front capex & ROI uncertainty | −2.8% | Global, smaller operators hit hardest | Short term (≤2 years) |
| Integration complexity with legacy EPC | −1.9% | Mature 4G markets | Medium term (2-4 years) |
| Source: Mordor Intelligence | |||
High Up-front Capex and ROI Uncertainty
AT&T’s wireless capex is set to peak in 2025 before tapering as major Ericsson core upgrades conclude in 2027. McKinsey estimates telcos must unlock USD 100–300 billion via network APIs within seven years to justify spend. Only 50-plus SA networks were commercially active despite years of investment, causing a 10% downward revision in five-year core revenue forecasts. Managed core-as-a-service models are therefore gaining traction.
Integration Complexity with Legacy EPC
Operators must preserve 4G services while migrating to 5G, which requires sophisticated orchestration and dual-mode user plane gateways. Cisco’s converged core folds S-GW and SMF logic into one fabric to permit seamless inter-RAT hand-offs. Automation and AI tools that schedule cut-overs outside busy-hour windows are now essential for risk mitigation. Hybrid architectures remain necessary for hard-to-replace long-tail IoT devices.
*Our forecasts treat driver/restraint impacts as directional, not additive. The impact forecasts reflect baseline growth, mix effects, and variable interactions.
Segment Analysis
By Component: Services Accelerate Through Managed Operations
Solutions led the 5G core network market with a 61.45% revenue share in 2025, driven by packet-core software, NFV infrastructure, and orchestration suites. Yet operator preference is shifting to managed operations and consulting, which explains the 26.58% CAGR forecast for services through 2031. Integration specialists help carriers stitch multi-vendor functions across hybrid clouds in weeks rather than quarters, speeding commercial launch of network-slice products.
Support now relies on predictive analytics rather than break-fix. Ericsson’s Service Continuity AI App suite delivered 33% power savings in London cell sites, proving tangible OPEX returns. Smaller operators outsource full lifecycle management to bridge skills gaps, while enterprises increasingly request turnkey private 5G cores bundled with SLAs for uptime and latency. This recurring revenue reshapes vendor business models in the 5G core network market.


By Deployment Model: Public Cloud Gains Despite On-Premises Dominance
On-premises deployments accounted for 53.65% of 5G core network market size in 2025, reflecting compliance and deterministic performance mandates. However, public cloud instances are growing at 31.05% CAGR to 2031 as hyperscalers offer telco-grade latency and availability through dedicated zones. Ericsson and Google Cloud’s on-demand platform lets CSPs spin up an entire SA core in minutes with pay-as-you-scale economics.
Hybrid topologies are emerging where user plane gateways reside at metro edge sites, while control-plane micro-services float in public regions for scale elasticity. AT&T’s converged fiber-plus-5G single-box solution shows how physical footprint reduces even as logical complexity rises. Edge clouds are particularly valued in autonomous driving and factories, where every millisecond counts, reinforcing the overall growth outlook for the 5G core network market.
By End-User: Enterprise Segment Transforms Market Dynamics
Telecom operators still dominate demand with a 71.85% share of the 5G core network market size in 2025. They need massive capacity expansions to support national traffic loads and roaming agreements. In contrast, enterprise uptake is expanding at 27.95% CAGR thanks to private 5G. Manufacturing lines use network slices for real-time quality control, utilities deploy smart-grid telemetry, and smart-city authorities run video analytics for road safety.
The Department of Defense’s 800-base private 5G plan highlights mission-critical adoption, while Saudi Arabia’s Vision 2030 puts public safety and e-government in focus. Turnkey offers bundle spectrum leasing, neutral host infrastructure, and managed core operations, lowering entry barriers for verticals with limited telecom know-how. As enterprise revenue mixes rise, vendor roadmaps prioritize API catalogs and zero-touch slice orchestration within the 5G core network market.
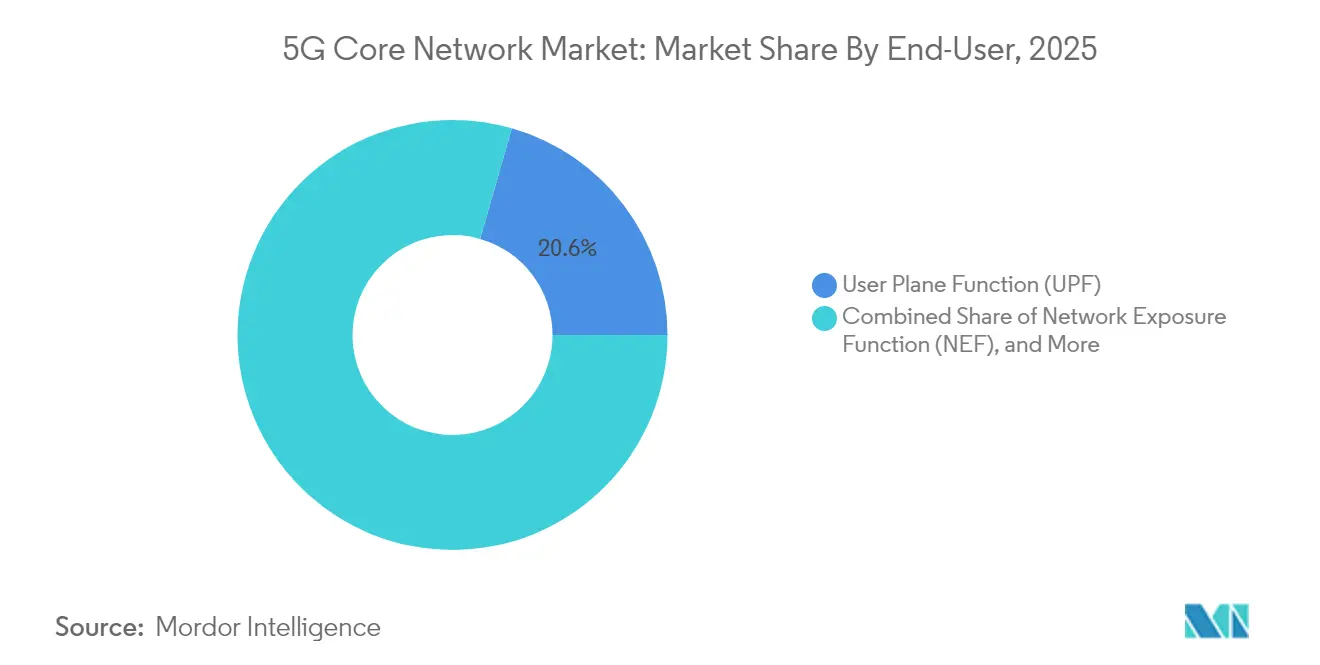
By Network Function: NEF Leads Growth Through API Monetization
User plane function maintained a 20.55% share of the 5G core network market in 2025 because throughput drives immediate customer experience metrics. Network exposure function, however, enjoys a 33.6% CAGR outlook through 2031 as operators chase third-party developer revenue. NEF normalizes authentication, quality, and location APIs so that software firms can pay per call.
Slice selection, session management, and policy functions also evolve toward stateless micro-services to support millions of concurrent IoT sessions. Unified data management provides a single truth source across RATs, simplifying identity federation. Authentication server function enhancements now embed quantum-safe algorithms for long-term data integrity. Together, these cloud-native microservices confirm the architectural pivot underway in the 5G core network industry.
Geography Analysis
Asia Pacific generated 39.15% of global revenue in 2025 and should post a 18.72% CAGR to 2031, aided by China Mobile’s USD 3 billion 5G-Advanced build that covers 300 cities and India’s 51.1% SA coverage milestone. The region’s manufacturing-heavy economies gain early productivity upside from deterministic slicing.
North America retains momentum through AT&T’s mid-band footprint reaching 270 million residents and T-Mobile’s nationwide 5G-Advanced roll-out. Open RAN policies plus national security directives spur competition and introduce sovereign supply chain requirements.
Europe trails with 2% SA penetration because of regulatory fragmentation, yet Germany, the UK, and Spain lead sub-regional investment. Middle East & Africa represent the highest relative upside: Saudi Arabia alone forecasts sector revenue rising from USD 2.1 billion in 2023 to USD 13.41 billion by 2029 through national digital-economy programs. These regional divergences underscore why localized strategies are vital within the global 5G core network market.

Competitive Landscape
Four incumbent vendors, Ericsson, Huawei, Nokia, and ZTE, account for close to 70% of worldwide revenue, giving the sector a moderately concentrated profile. Ericsson’s recent core win at Three UK removed Nokia and Microsoft infrastructure while tripling throughput to 9 Tbps, reinforcing its perceived lead in dual-mode and cloud-native design. It's Google Cloud alliance couples telecom reliability with hyperscale reach, forming a blueprint many tier-one operators plan to replicate.
ZTE capitalizes on China’s 5G-Advanced macro wave, recording 7.8% Q1 2025 top-line growth and racing to supply AI-centric 5.5G features that cut energy per bit. Huawei debuted AI-centric 5.5G at MWC 2025, shifting focus from traffic-based to experience-based monetization, although geopolitical sanctions keep it out of several Western markets. Samsung positions itself as an agile challenger with vRAN commitments exceeding 53,000 sites by 2025 and 35% energy reduction via AI scheduling.
White-space entrants target API marketplaces, AI optimization, and open RAN integration. The Aduna JV, formed by Ericsson plus 12 operators, seeks to standardize commercial API exchange, accelerating third-party ecosystem growth rcrwireless.com. Cisco pairs with NEC for turnkey private 5G bundles aimed at OT buyers, while Microsoft’s exit via Affirmed divestiture underscores the execution hurdles facing cloud-first providers in carrier-grade domains. Scale, proven reliability, and AI-native feature sets therefore remain pivotal differentiators in the 5G core network market.
5G Core Network Industry Leaders
Nokia Corporation
Telefonaktiebolaget LM Ericsson
Samsung Electronics Co. Ltd.
Huawei Technologies Co. Ltd.
Cisco Systems Inc.
- *Disclaimer: Major Players sorted in no particular order

Recent Industry Developments
- April 2025: T-Mobile hit a nationwide 5G-Advanced milestone with 3GPP Release 18 features that boost spectral efficiency and location accuracy.
- April 2025: GCI chose Ericsson for a cloud-native core covering Alaska, relying on AI tools to overcome harsh terrain challenges.
- February 2025: Three UK tapped Ericsson for Europe’s largest cloud-native core, replacing Nokia and Microsoft gear and boosting capacity to 9 Tbps.
- June 2024: O2 Telefónica and Ericsson completed the world’s first in-service core software upgrade covering 45 million lines in Germany .


Research Methodology Framework and Report Scope
Market Definitions and Key Coverage
Our study defines the 5G core network market as all cloud-native and virtualized packet-core software, supportive NFV infrastructure, and related integration and lifecycle services that enable stand-alone (SA) and non-stand-alone (NSA) 5G deployments across public and private networks. According to Mordor Intelligence, revenues include solutions such as UPF, SMF, NEF, NRF, and associated professional and managed services purchased by telecom operators and enterprises worldwide.
Scope Exclusion: Radio access equipment, transport backhaul hardware, and legacy EPC upgrades are not counted.
Segmentation Overview
- By Component
- Solutions
- Packet-Core Software
- NFV Infrastructure
- Orchestration and Management
- Services
- Integration and Deployment
- Consulting and Advisory
- Support and Maintenance
- Solutions
- By Deployment Model
- On-Premise/Dedicated
- Public Cloud
- Hybrid and Telco Edge Cloud
- By End-User
- Telecom Operators
- Enterprises
- Manufacturing
- Energy and Utilities
- Transportation and Logistics
- Public Safety and Emergency
- Smart Cities and Municipalities
- By Network Function
- Network Exposure Function (NEF)
- User Plane Function (UPF)
- Application Function (AF)
- Unified Data Management (UDM)
- Session Management Function (SMF)
- Network Slice Selection Function (NSSF)
- Policy Control Function (PCF)
- Network Repository Function (NRF)
- Authentication Server Function (AUSF)
- Access and Mobility Management (AMF)
- By Geography
- North America
- United States
- Canada
- Mexico
- South America
- Brazil
- Argentina
- Europe
- Germany
- United Kingdom
- France
- Spain
- Asia-Pacific
- China
- India
- Japan
- South Korea
- ASEAN
- Rest of Asia-Pacific
- Middle East
- Saudi Arabia
- United Arab Emirates
- Africa
- South Africa
- North America
Detailed Research Methodology and Data Validation
Primary Research
Mordor interviewed core-network product managers at tier-1 vendors, cloud architects from hyperscalers, and operations leads at mobile operators in Asia-Pacific, North America, and Europe. These discussions tested service price bands, roll-out pacing, and expected migration rates to SA cores, filling gaps left by public statistics and grounding model assumptions.
Desk Research
Mordor analysts began with public datasets from bodies such as the International Telecommunication Union, 3GPP release repositories, GSMA Intelligence, and regional telecom regulators, which map licensed SA launches, spectrum allocations, and subscriber uptakes. Trade associations like 5G Americas and the Next Generation Mobile Networks Alliance provided deployment counts and guidance on cloud-native adoption. Company 10-Ks, quarterly filings, and investor decks helped us anchor vendor revenue splits for core software and services, while press releases on SA milestones gave timing clues. Select paid databases, D&B Hoovers for vendor financials and Dow Jones Factiva for deal news, supplied additional validation. This list is illustrative; many other secondary sources informed data checks and clarifications.
Desk research also sifted through import-export shipment briefs on Volza to estimate NFV hardware flows and reviewed Questel patent trends to gauge innovation intensity in policy-control and network-exposure functions, ensuring the volume assumptions in our model stayed realistic.
Market-Sizing & Forecasting
Top-down modeling starts with live and announced SA network counts, subscriber bases, and average core revenue per subscriber, producing a market value. Results are cross-checked through bottom-up snapshots that roll up sampled vendor shipments and integration contract values, which are then reconciled. Key variables include licensed 5G subscriber additions, enterprise private-5G nodes, average service pricing, NFV hardware ASPs, spectrum-auction timelines, and cloud-migration rates. A multivariate regression links these drivers to annual spend, and ARIMA smoothing adjusts near-term volatility. Where supplier data were partial, ratios from completed operator disclosures bridged gaps before final aggregation.
Data Validation & Update Cycle
Every draft model passes two layers of peer review and anomaly screening; large deltas trigger a re-contact of earlier interviewees. Mordor refreshes the dataset each year and issues mid-cycle updates if spectrum policy shifts, large M&A moves, or material SA launches occur. A final analyst pass occurs just before publication.
Why Mordor's 5G Core Network Baseline Is Widely Trusted
Published figures often diverge because firms choose different component mixes, pricing bases, and refresh cadences. Variation is amplified when some models count only software licenses while others bundle services or private-network cores.
Key gap drivers include narrower regional scope, single-scenario forecasting, or older exchange rates used by other studies, whereas Mordor updates rates quarterly and ties scope strictly to 3GPP-defined core functions.
Benchmark comparison
| Market Size | Anonymized source | Primary gap driver |
|---|---|---|
| USD 5.25 B (2025) | Mordor Intelligence | - |
| USD 3.47 B (2025) | Global Consultancy A | Excludes enterprise private-5G cores and uses 2024 exchange rates |
| USD 3.42 B (2025) | Research Publisher B | Counts only software licenses, omits managed services |
These comparisons show how selective inputs shift totals, while Mordor's disciplined scope, dual-path modeling, and annual refresh give decision-makers a balanced baseline they can trace back to clear variables and repeatable steps.


Key Questions Answered in the Report
What is the current size of the 5G core network market?
The 5G core network market size is USD 6.32 billion in 2026 and is on track to reach USD 16.05 billion by 2031.
Which region leads the 5G core network market today?
Asia Pacific holds a 39.15% revenue share thanks to large-scale stand-alone deployments in China and India.
Why is the network exposure function growing so quickly?
Operators view NEF as the gateway for charging third-party developers per API call, driving a 33.6% CAGR to 2031.
How fast is the services segment expanding?
Services are expected to rise at a 26.58% CAGR as carriers outsource integration, automation and life-cycle management.
What role do hyperscalers play in 5G core deployment?
Public cloud platforms, such as the Ericsson–Google Cloud offering, allow carriers to spin up carrier-grade cores in minutes while preserving telecom reliability.
Are energy-efficiency targets influencing purchasing decisions?
Yes, AI-powered optimization trials like Vodafone UK’s 33% radio power cut prove that sustainability KPIs are now a decisive factor when selecting vendors.
Page last updated on:


