Market Overview
| Study Period | 2020 - 2031 |
|---|---|
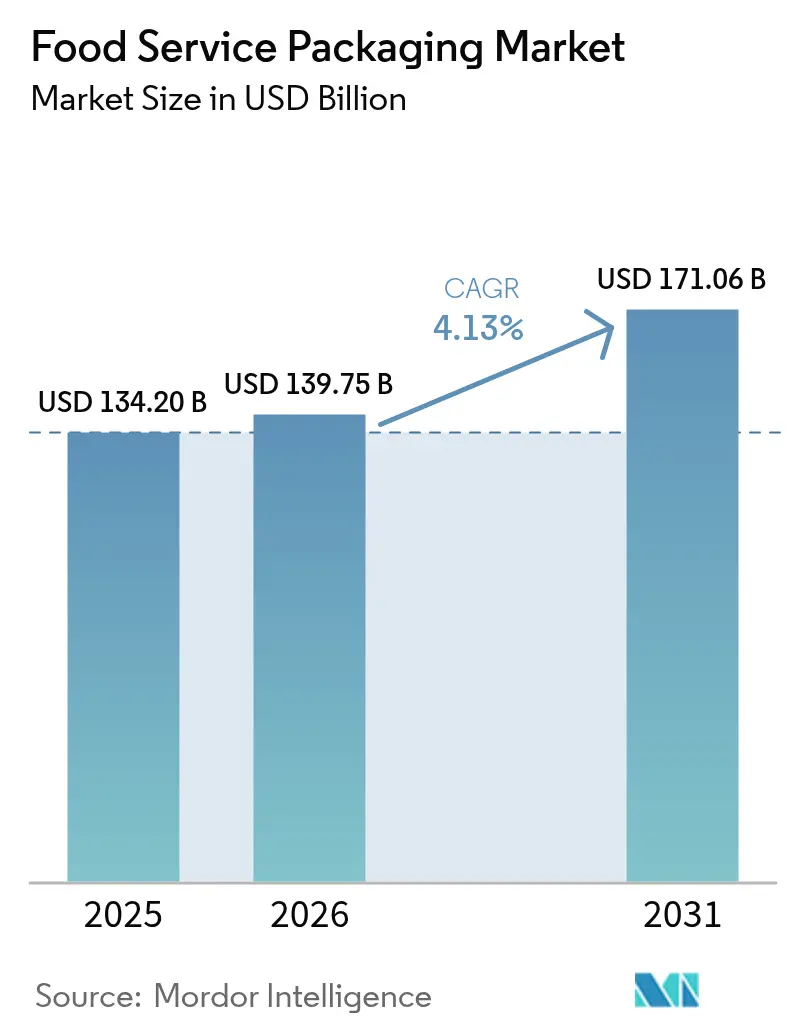
| Market Size (2026) | USD 139.75 Billion |
| Market Size (2031) | USD 171.06 Billion |
| Growth Rate (2026 - 2031) | 4.13% CAGR |
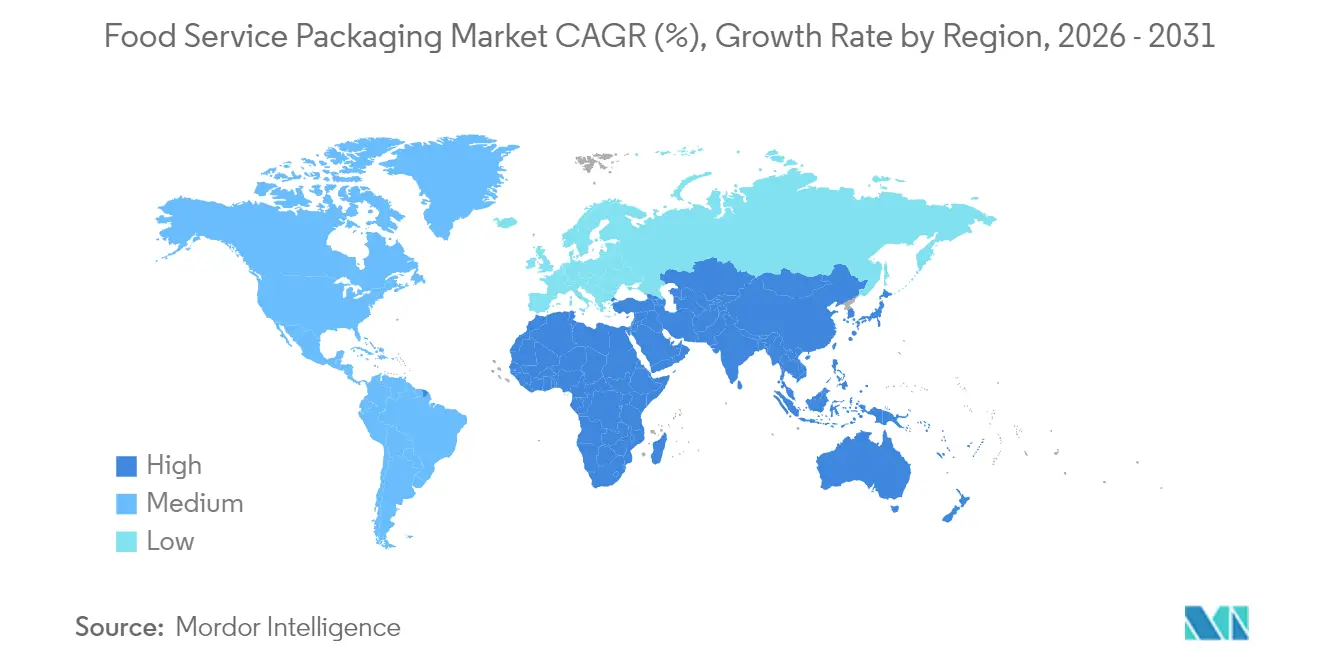
| Fastest Growing Market | Middle East and Africa |
| Largest Market | Asia Pacific |
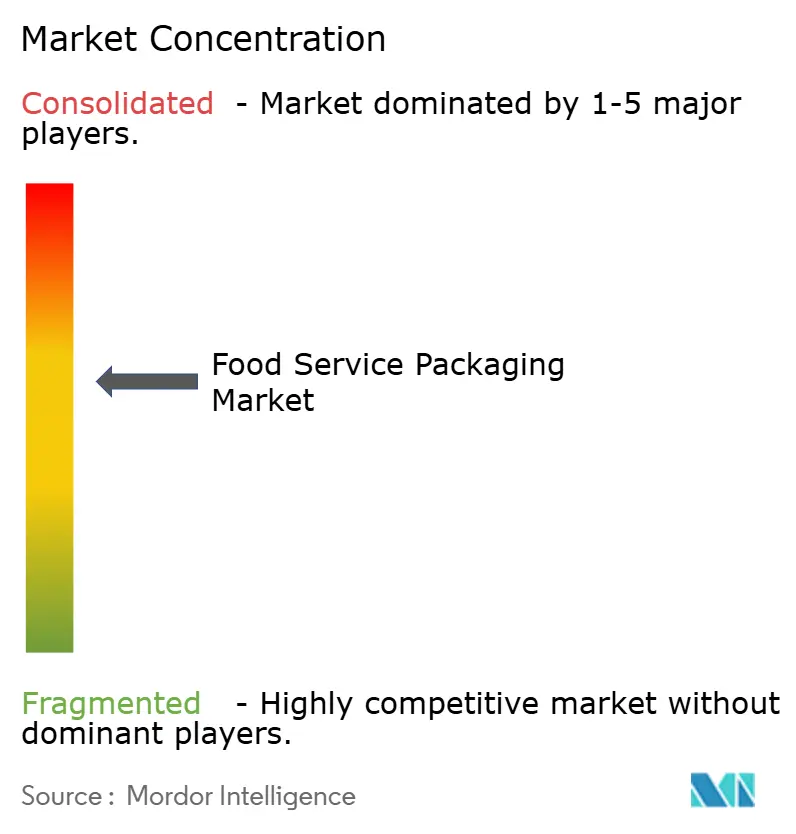
| Market Concentration | Medium |
Major Players *Disclaimer: Major Players sorted in no particular order Image © Mordor Intelligence. Reuse requires attribution under CC BY 4.0. | |
Food Service Packaging Market Analysis by Mordor Intelligence
The food service packaging market size is expected to grow from USD 134.20 billion in 2025 to USD 139.75 billion in 2026 and is forecast to reach USD 171.06 billion by 2031 at 4.13% CAGR over 2026-2031. Growth rests on three reinforcing pillars: escalating regulatory mandates that restrict single-use plastics, steady advances in compostable and recycled-content substrates, and surging demand from ghost kitchens and delivery apps that require tamper-evident, performance-driven packs. Asia-Pacific leads the food service packaging market with a 40.76% revenue share, buoyed by rapid urbanization and rising middle-class consumption. Simultaneously, the Middle East and Africa register the fastest regional pace at a 6.22% CAGR thanks to expanding QSR chains, infrastructure investment, and a young demographic profile. Material dynamics mirror these geographic shifts: plastics retain ubiquity because of cost and barrier advantages, yet biodegradable films and molded-fiber serviceware capture the majority of new specifications as bans on PFAS-treated items sweep across North America and Europe. Across the value chain, incumbents with integrated resin recycling or proprietary fiber-coating lines are positioned to outpace converters tied to virgin polymer supply, while smart-packaging innovators are carving a premium niche by embedding freshness and tamper sensors into lids and delivery clamshells.
Key Report Takeaways
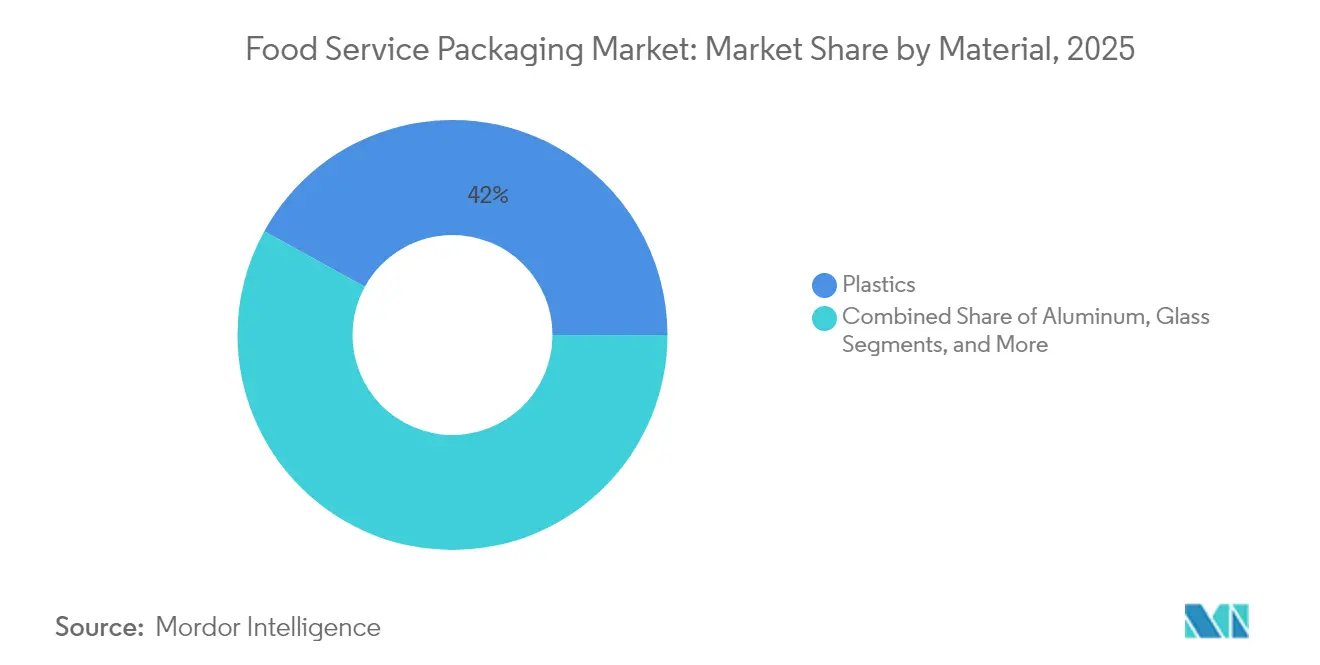
- By material, plastics led with 41.98% of food service packaging market share in 2025, whereas biodegradable and specialty substrates are projected to expand at a 5.42% CAGR through 2031.
- By packaging type, cups and tubs held 37.89% of the 2025 revenue pool, while trays and containers are set to accelerate at a 5.11% CAGR to 2031.
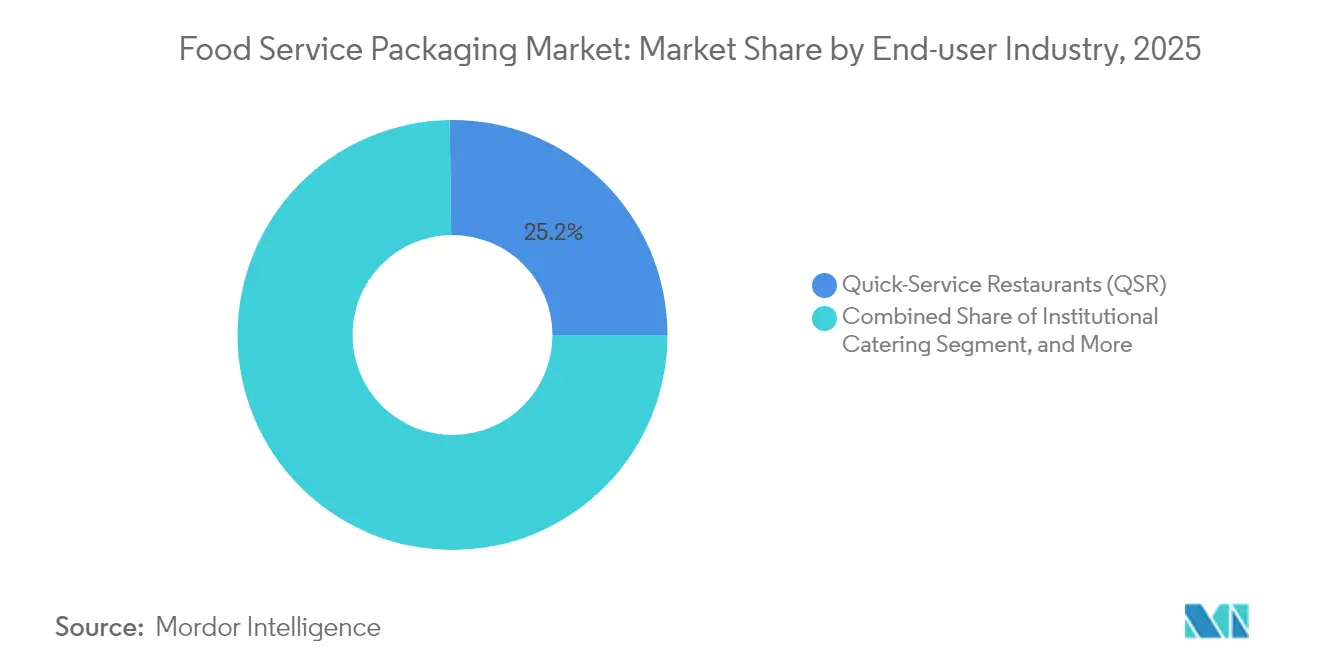
- By end-user industry, quick-service restaurants accounted for 25.21% of sales in 2025, while hospitality and cafés are forecast to post the quickest 6.18% CAGR over the outlook period.
- By sustainability profile, conventional packs still comprise 53.78% of shipments, yet sustainable alternatives are advancing at a 6.55% CAGR on the back of recycled-content mandates.
- By geography, Asia-Pacific’s dominance at 40.32% rests on high-volume urban demand, whereas the Middle East and Africa will chart the swiftest 5.98% CAGR through 2031.
- The Novolex acquisition of Pactiv Evergreen in March 2025 created the largest vertically integrated supplier and intensified competitive rivalry across fiber lids, RPET clamshells, and molded-pulp trays.
Note: Market size and forecast figures in this report are generated using Mordor Intelligence’s proprietary estimation framework, updated with the latest available data and insights as of 2026.
Global Food Service Packaging Market Trends and Insights
Drivers Impact Analysis*
| Driver | (~) % Impact on CAGR Forecast | Geographic Relevance | Impact Timeline |
|---|---|---|---|
| Urban demand for on-the-go, portion-controlled meals | +0.8% | Global with APAC and North America concentration | Medium term (2-4 years) |
| E-commerce meal-kit boom | +0.6% | North America & EU, expanding into APAC | Short term (≤ 2 years) |
| QSR shift to fiber serviceware amid PFAS bans | +0.9% | North America & EU; early adoption in Australia | Medium term (2-4 years) |
| Recycled PET capacity expansions | +0.5% | Global, led by Asia-Pacific hubs | Long term (≥ 4 years) |
| Sensor-enabled smart lids | +0.3% | North America & EU; APAC pilots | Long term (≥ 4 years) |
| Ghost-kitchen franchising surge | +0.7% | Global, concentrated in urban centers | Short term (≤ 2 years) |
| Source: Mordor Intelligence | |||


Growing Demand for On-the-Go, Portion-Controlled Meals in Urban Centers
Portion-specific packs have outpaced bulk formats as younger, city-dwelling consumers favor convenient single-serve meals they can finish during short commutes. Brand owners now specify stackable trays with integrated calorie icons and scannable QR nutrition tags that fit automated vending and micro-fulfillment lockers. McDonald’s pilot of grass-paper burger wraps in Germany illustrates how multinational QSR chains marry convenience with sustainability to satisfy urban diners. Institutional buyers reinforce the trend; the United Kingdom’s National Health Service framework for catering consumables standardizes portion sizes while mandating allergen-compliant labels. As a result, converters that master modular die-cutting and variable-data labeling gain a cost edge while meeting complex urban service requirements.
E-commerce Meal-Kit Boom Accelerating Secondary and Tertiary Packaging Volumes
Meal-kit operators require multi-layered solutions that shield raw proteins, prevent odor transfer, and withstand two-day courier cycles. Demand has spurred investment in customized barrier pouches, corrugated coolers, and molded-fiber inserts designed to curb refrigerant use and shipping weight. Providers increasingly embed NFC freshness tags in outer cartons to signal tamper events and temperature excursions, mirroring Tetra Pak’s sensor-equipped pilot for direct-to-consumer dairy in 2024. Domestic fiber molding lines have been added in the United States and Germany to curb supply risk, and Asia-Pacific manufacturers are retooling to supply water-based ink systems compatible with meal-kit ovens and microwaves.
Quick-Service Restaurants’ Shift to Fiber-Based Serviceware Amid PFAS Bans
Legislation in the EU, several U.S. states, and Australia bans PFAS coatings in food contact articles, forcing QSRs to redesign combo boxes, fry sleeves, and beverage lids. Huhtamäki’s home-compostable fiber lid for McDonald’s Finland eliminates 59 t of plastic annually. J&J Green Paper’s JANUS barrier, adopted by Arcos Dorados in Argentina, shows coatings can equal grease resistance of fluorinated papers while permitting home compost. Operators also redesign storage racks and warming bins to handle thicker fiber profiles, creating ancillary sales for equipment vendors.
Recycled PET Capacity Expansions Lowering Price Premium vs. Virgin Resin
Asia-Pacific resin groups have financed bottle-to-tray lines that flake, depolymerize, and re-extrude food-grade RPET at scale. Vertical integration trims logistics costs, narrowing the delta between recycled and virgin PET. Mandatory recycled-content thresholds in California and the EU guarantee base volumes, anchoring investment economics. Yet collection remains spotty in emerging Asia; therefore, converters hedge with dual-spec SKUs able to run virgin or recycled feedstock without tooling changes.
Restraints Impact Analysis*
| Restraint | (~) % Impact on CAGR Forecast | Geographic Relevance | Impact Timeline |
|---|---|---|---|
| Phase-outs of single-use EPS and PVC | -0.7% | Global, led by EU and North America | Short term (≤ 2 years) |
| Volatility in virgin polymer prices | -0.5% | Global, most acute in price-sensitive markets | Short term (≤ 2 years) |
| Insufficient post-consumer collection in APAC | -0.4% | Emerging Asia; spillover to MEA | Medium term (2-4 years) |
| High capex for reusable systems | -0.3% | North America & EU stadiums and campuses | Long term (≥ 4 years) |
| Source: Mordor Intelligence | |||
Regulatory Phase-Outs of Single-Use EPS and PVC in More Than 60 Countries
Fast-tracked bans compress transition windows to 12–18 months, straining the capacity of alternative substrate suppliers. France’s AGEC law obliged McDonald’s to roll out reusable polypropylene trays in 2024, rewiring front-of-house workflows and piloting silicone-rubber containers for eat-in orders.[1]“McDonald’s Introduces Reusable Packaging to Reduce Waste,” Smileymovement.org Small operators lack the capex to overhaul back-of-house dishwashing or deposit logistics, nudging them to third-party pooling services and reinforcing consolidation toward well-capitalized chains.
Volatility in Virgin Polymer Prices Squeezing Converter Margins
Two-year swings of 30–50 % in PE and PP resin spot prices erode converter margins because annual contract structures with QSR clients limit pass-through speed. Multinational converters diversify into RPET and pulp molding to hedge price cycles, while niche thermoformers without resin leverage seek merger exits. Flexible packagers are most exposed: quarterly raw-material surcharges clash with 12-month food-service bids, accelerating rationalization of SKUs and plant footprints.
*Our forecasts treat driver/restraint impacts as directional, not additive. The impact forecasts reflect baseline growth, mix effects, and variable interactions.
Segment Analysis
By Material: Biodegradable Solutions Activate New Product Pipelines
Plastics kept the largest 41.98% food service packaging market share in 2025, leveraged by cost efficiency, high-clarity display, and seal integrity that remain critical for beverage lids and hot-fill soup tubs. Still, biodegradable and specialty substrates are slated for a 5.42% CAGR, reflecting stronger eco-labeling pull and expanding compost infrastructure in urban Northern Europe. The food service packaging market size for biodegradable films is forecast to reach USD 26.36 billion by 2031, buoyed by starch blends that now tolerate microwave reheating at 100 °C without warpage. In conventional plastics, PFAS removal and chemical-recycle pathways dominate R&D budgets, evidenced by McDonald’s 99.5% fluorinated-compound phase-out milestone in 2024.
Paper and paperboard continue to migrate up-market; aqueous dispersion coatings now achieve 8-hour hot-grease resistance, opening burger clam shells and noodle bowls to fiber conversion. Aluminum cans and trays preserve niche demand for airline catering and high-acid meal components but struggle against lightweight composite cartons. Glass sees negligible penetration because delivery platforms penalize weight and breakage risk. As resin volatility persists, converters hedge with hybrid PP-pulp solutions that trim polymer usage by 50% while safeguarding heat retention, reinforcing biodegradable materials as the prime innovation arena within the food service packaging market.


By Packaging Type: Trays and Containers Capture Delivery Windfall
Cups and tubs retained a 37.89% revenue lead in 2025, anchored by universal beverage and soup applications and mega-volume QSR procurement that lowers unit costs. Nonetheless, trays and containers surge ahead at a 5.11% CAGR, supported by courier-centric menu designs. The food service packaging market size for trays could hit USD 47.30 billion by 2031 as ghost kitchens favor leak-proof, microwavable designs with snap-fit lids and anti-fog windows. Tamper bands and peel-away freshness seals migrate from pharma to food, creating incremental tooling demand for thermoformers.
Clamshells, once synonymous with EPS, reposition toward molded-fiber and post-consumer recycled PET formats to meet bans, while sachets and pouches fill portion-controlled condiment niches. Sabert’s Tray2Go pulp line, introduced in 2024, pairs compostability with shelf stacking strength, giving airlines and hospital caterers a cost-neutral swap from PP trays. Overall, packaging-type diversification indicates that suppliers offering multi-format portfolios will command premium bids in the food service packaging market.
By End-User Industry: Hospitality and Cafés Outpace Legacy Segments
Quick-service restaurants held 25.21% of the 2025 spend through global master agreements and SKU standardization that simplify sourcing and drive scale. Yet hospitality and cafés will expand at a 6.18% CAGR to 2031 as premium coffee, bakery snacking, and lifestyle hotels emphasize branded wraps and Instagram-friendly fiber bowls. The food service packaging industry increasingly tailors high-graphic litho laminate cups and textured kraft sleeves to elevate brand storytelling at indie cafés.
Full-service restaurants experience mid-single-digit growth by introducing delivery lines that require upgraded hot-holding performance. Institutional catering sees steady demand, spurred by hospital network expansion and education sector sustainability pledges; the Hospital Caterers Association’s guidelines on compostable serviceware illustrate rising environmental expectations. Bid volumes from purchasing consortia like TUCO’s GBP 48 million (USD 64.85 million) disposable framework show cafés and campus operators now bundle allergen labeling and deposit-return logistics into packaging contracts. This dynamic fuels segment specialization within the food service packaging market.
By Sustainability Profile: Recycled and Compostable Packs Escalate Procurement Priority
Conventional multi-layer structures still dominate at 53.78% in 2025 but face incremental decline as chain restaurants ratchet minimum recycled-content thresholds and pursue net-zero packaging roadmaps. Sustainable variants will register a 6.55% CAGR, doubling their slice of the food service packaging market by 2031. Recycled PET trays narrowed the price gap with virgin resin by 15 % during 2024, thanks to capacity additions in Asia and Europe, allowing caterers to adopt clear lids without budget override. Compostable molded fiber gains ground where municipal collection exists; Huhtamäki, for example, deploys polymer-free, home-compostable coatings that survive 100 °C beverage fills.
Corporate pledges accelerate pull-through: McDonald’s aims for 100% renewable or recycled guest packaging by 2025, compelling tier-one suppliers to certify chain-of-custody systems and invest in pulping facilities adjacent to QSR distribution centers. Sabert’s r-PRO technology mixes post-consumer PP with calcium carbonate to maintain rigidity at 40 % recycled content, showing how proprietary blends unlock mid-range price points.
Geography Analysis
Asia-Pacific commands the food service packaging market with 40.32% share, fueled by expanding urban consumption in China, India, and Southeast Asian economies. As bricks-and-clicks food aggregators scale, packaging converters relocate extrusion and printing assets closer to megacities to shrink lead times and tailor SKUs to local taste profiles. Vietnam’s draft EPR law signals an impending shift toward mandatory recycled-content quotas, prompting RPET flake exporters to build domestic washing lines. Yet inconsistent municipal collection slows bottle-to-food trials, keeping virgin resin demand resilient across high-temperature noodle applications.
North America displays mature yet innovation-led dynamics. State-level PFAS prohibitions catalyze rapid fiber-lid conversions and push chemical-recycling joint ventures between resin majors and packaging converters. The New York Office of General Services now publishes an annual purchasing specification for compliant fiber containers and wraps, giving public-sector buyers a vetted list of sustainable SKUs. U.S. brands pioneer pilot reuse schemes in stadium concessions, collecting data on wash-cycle durability and consumer acceptance to inform 2030 zero-waste targets.
Europe follows a harmonized regulatory path via the Single-Use Plastics Directive. Deposit-return systems in Germany and the Nordics deliver high PET collection rates, lowering RPET pellet costs. Fiber-coated pizza discs and molded drink carriers gain traction, supported by compost infrastructure integrated with municipal bio-waste streams. Supply, however, is constrained by cellulose pulp availability, spurring investments in sustainable forestry and agricultural-waste fiber pulping.
The Middle East and Africa, though only 6 % of current revenue, present a 5.98% CAGR upside. Fast-food franchisors such as KFC and Burger King deploy standardized packaging kits to support rapid outlet roll-outs in the Gulf and North Africa. UFlex’s USD 200 million Egypt plant positions the firm to serve both African growth markets and European proximity sourcing, shortening lead times and hedging Red Sea shipping risks. Waste infrastructure remains nascent, prompting interest in mono-material PP tubs that facilitate downstream mechanical recycling once collection systems scale.

Regulatory Landscape
Food-service packaging is being reshaped by tighter rules on chemicals of concern, recyclability, and producer responsibility, with the EU and selected US states setting many of the operational deadlines for global suppliers. In the European Union, the Packaging and Packaging Waste Regulation (EU) 2025/40 applies from August 12, 2026, adding requirements around packaging sustainability, labeling, and extended producer responsibility. It also introduces limits affecting food-contact packaging that contains PFAS above specified concentrations.
Food-contact compliance is also being updated through amendments to the plastics FCM regime and related corrections. The European Commission adopted Regulations (EU) 2026/245 and (EU) 2026/250 on February 2, 2026, updating the Union list under Regulation (EU) No 10/2011 and correcting the BPA restriction framework. The updates include a transitional provision allowing certain BPA-based single-use food contact articles made under prior rules to be placed on the market until July 20, 2026. In the United States, the FDA announced a finalized systematic process for post-market assessment of chemicals in food (including food contact substances) on May 12, 2026. Maryland adopted Producer Responsibility regulations for packaging and paper products (COMAR 26.04.14), effective May 25, 2026, adding registration and reporting obligations that packaging producers and importers must operationalize.
Value Chain Analysis
The food service packaging value chain runs from feedstock and chemical inputs (virgin polymers, recycled PET flake/pellets, pulp and coatings, inks and adhesives) to machinery and tooling (thermoforming, fiber molding, extrusion/lamination, printing, and die-cutting), then to converters that manufacture cups, tubs, trays, clamshells, wraps, and lidding solutions. Distribution then flows through foodservice distributors and chain procurement platforms to end users such as QSRs, hospitality and cafes, institutional caterers, and delivery-focused operators. Specification decisions increasingly incorporate food-contact compliance, PFAS-free barriers, and recycled-content documentation.
Upstream constraints and compliance timelines are shifting where value accrues: access to consistent recycled feedstock and validated barrier chemistries has become a differentiator, while multi-year chain contracts favor converters that can support redesign, testing, and documentation across regions. The EU PPWR (Regulation (EU) 2025/40), in force since February 2025 and applying from August 12, 2026, raises the compliance burden across design, labeling, and producer responsibility for any packaging placed on the EU market. That increases the importance of material traceability and end-of-life alignment. Technology and material substitution investments are visible along the chain, including Tetra Pak working with Sterilgarda Alimenti (April 2026) on a paper-based barrier aseptic carton to raise renewable content, and developments in drop-in alternatives for legacy formats such as sugarcane-based PLA foam designed to replace EPS in foodservice applications (TotalEnergies Corbion, July 2026).
Competitive Landscape
The food service packaging market shows moderate concentration, with the top five suppliers controlling roughly 45 % of global revenue. Novolex’s USD 6.7 billion takeover of Pactiv Evergreen in March 2025 forged the largest North American platform spanning RPET lids, fiber trays, and paper carryout bags. Huhtamäki continues to leverage its global molded-fiber capacity to secure multinational QSR contracts, while Dart Container focuses on lightweight PP and PS cups for price-sensitive convenience channels. Sabert differentiates through proprietary recycled blends and design services that tailor trays for premium ready-meal producers.
Strategic moves underscore a pivot toward sustainability scale-ups. SIG’s EUR 90 million aseptic-carton plant in 2024 delivered incremental capacity for shelf-stable foodservice broths. Evertis’s planned USD 100 million U.S. facility announces transatlantic ambitions in high-barrier RPET sheet. Competitive intensity now revolves around access to recycled feedstock, coating chemistries that replace PFAS, and the integration of sensor electronics. Start-ups forging seaweed films or PHA-based stretch wraps often partner with larger groups for scale, evidenced by joint development agreements signed in mid-2025.
Price competition persists in commodity SKUs such as 16-oz cold cups, yet brand owners increasingly award multi-year contracts to converters that bundle sustainability consultancy, graphics management, and post-use recovery services. Consequently, firms with in-house recycling or captive forestry assets lock in cost advantages. The food service packaging market thus rewards capital access, regulatory foresight, and cross-material R&D breadth.
Food Service Packaging Industry Leaders
Dart Container Corporation
Amhil North America
Genpak LLC
Huhtamaki Oyj
Novolex
- *Disclaimer: Major Players sorted in no particular order

Market Opportunities and Future Outlook
Regulatory deadlines and retailer/QSR specifications are creating actionable whitespace in PFAS-free fiber barriers, mono-material designs, and recycled-content compliant structures that can be qualified across multiple jurisdictions with limited SKU proliferation. The EU PPWR applying from August 12, 2026, and the continued rollout of state-level requirements in the United States, are tightening supplier demand for documented compliance (traceability, labeling, and chemical restrictions) while maintaining performance in hot, greasy, and delivery-use conditions. This raises the premium on converters able to support multi-material portfolios (fiber, recycled plastics, and compostables) with validated food-contact performance and consistent sourcing of recycled feedstock.
Capacity localization and nearshoring for foodservice grades is another opportunity area as brand owners and distributors push for shorter lead times and supply assurance for high-run items such as lids, trays, and carryout packaging. Huhtamaki opened an expanded manufacturing facility in Paris, Texas (June 2026) to serve QSR demand in North America, while Amcor commenced an expansion at its flexible packaging facility in Dongguan, China (May 2026), adding automated solvent-free lamination and bag-making capability. On the regulatory-compliance services side, California SB 54 producer responsibility requirements took effect May 1, 2026, with producer participation steps due in 2026, and SB 343 recyclability-claim restrictions take effect October 4, 2026. Together, these steps are increasing demand for packaging designs and on-pack communication that can pass substantiation thresholds and reduce stranded inventory risk.
Recent Industry Developments
- June 2026: Huhtamaki officially opened an expanded manufacturing facility in Paris, Texas, adding capacity aimed at serving quick-service restaurant customers in North America. The expansion supports regional supply continuity for high-volume foodservice items while enabling faster qualification cycles as customers shift specifications toward fiber-based and compliant formats.
- May 2026: Huhtamaki partnered with Hesburger to introduce fibre-based beverage lids, produced at Huhtamaki's foodservice facility in Alf, Germany. The partnership highlights large-operator pull for plastic replacement in beverage components and provides a reference design that can be scaled across similar QSR and fast-casual beverage programs.
- March 2026: Genpak announced the closure of its Cedar City, Utah, manufacturing facility, with shutdown scheduled for May 23, 2026, citing legislative polystyrene bans in neighboring states. This footprint realignment shows how localized material restrictions are changing capacity allocation and speeding portfolio transitions away from PS and EPS-dependent SKUs.


Research Methodology Framework and Report Scope
Market Definition and Coverage
This market covers packaging products used to serve, carry, and protect prepared food and beverages across food service channels, including dine-in, takeaway, and delivery. The sizing is tracked in revenue terms for packaging formats used at the point of food service.
Scope exclusions: We exclude packaging used only for retail grocery and shelf-stable packaged foods that are not primarily sold through food service outlets.
Segmentation Overview
- By Material
- Paper and Paperboard
- Plastics
- Polyethylene Terephthalate (PET)
- Polypropylene (PP)
- Polystyrene (PS) and Expanded Polystyrene (EPS)
- Other Plastics
- Aluminum
- Glass
- Biodegradable and specialty materials
- By Packaging Type
- Clamshells
- Cups and Tubs
- Trays and Containers
- Sachets and Pouches
- Other Packaging Types
- By End-user Industry
- Quick-Service Restaurants (QSR)
- Full-Service Restaurants (FSR)
- Institutional Catering
- Hospitality and Cafes
- Other End-user Industries
- By Sustainability Profile
- Conventional Type
- Sustainable Packaging
- By Geography
- North America
- United States
- Canada
- Mexico
- South America
- Brazil
- Argentina
- Chile
- Rest of South America
- Europe
- United Kingdom
- Germany
- France
- Spain
- Italy
- Rest of Europe
- Asia-Pacific
- China
- India
- Japan
- Australia
- South Korea
- Vietnam
- Rest of Asia-Pacific
- Middle East and Africa
- Middle East
- Saudi Arabia
- United Arab Emirates
- Turkey
- Rest of Middle East
- Africa
- South Africa
- Nigeria
- Egypt
- Rest of Africa
- Middle East
- North America
Data Sources, Market Sizing, and Validation
Desk Research
We started with desk research to set the boundary of food service usage and to build basic demand signals that can be compared across countries. Public sources such as US Census Bureau manufacturing shipments, US Bureau of Labor Statistics price series, Eurostat trade and packaging statistics, UN Comtrade import and export flows, and FAO foodservice and consumption context were used to anchor direction and sanity-check volumes.
Industry associations and regulator pages were also reviewed to understand material rules and labeling shifts that can change pack formats, along with company annual reports, investor presentations, and credible business press to map product mix and channel exposure. Where needed, we used paid subscriptions for company financials and for patent databases to validate capacity expansion themes and innovation activity. The sources listed here are illustrative, and many additional public references were used for data collection, validation, and clarification during the study.
Primary Interviews and Surveys
Primary work was used to pressure-test the desk assumptions, especially the split between dine-in and delivery usage and the typical price range by format and material. We spoke with packaging converters, distributors, food service operators, and material and compliance specialists across major regions so that demand drivers and substitution effects could be confirmed before finalizing the model.
Distribution of primary research fieldwork respondents
| Company type | Respondent position | Region |
|---|---|---|
| Top tier: 39% | CXOs: 13% | APAC: 48% |
| Mid tier: 47% | Functional/Unit leaders: 43% | EMEA: 34% |
| Smaller Players: 14% | Managers: 44% | Americas: 18% |
Market-Sizing & Forecasting
Sizing was built using a top-down approach where food service activity indicators were translated into packaging demand pools, and then reconciled against the value that packaging categories typically capture in each channel. The outputs were then checked with selective bottom-up approximations using sampled supplier revenue splits, channel checks with distributors, and ASP times volume math for common items like cups, clamshells, trays, and cutlery to ensure totals stayed realistic.
Key inputs used in the model included foodservice outlet counts and chain expansion signals, quick service and delivery penetration, average order volumes for beverages and meals (which drive unit intensity), material mix shifts between plastic and fiber, and pricing movement tied to resin and paper trends. Forecasts were prepared using scenario analysis supported by expert views on regulation-driven substitution, reuse pilots, and the pace of adoption for molded fiber and compostable formats. When bottom-up references had gaps by country or format, we used region-level averages and then adjusted them using local channel mix and price levels from interviews.
Data Validation & Update Cycle
Triangulation was done by comparing model outputs against independent signals such as packaging production and trade flows, reported foodservice expansion, and observed price direction in key materials, followed by a variance check at region and format levels. When a number moved outside expected ranges, assumptions were revisited and respondents were re-contacted to confirm whether the shift was real or caused by a boundary or pricing mismatch.
Before sign-off, the model and narrative go through multi-step analyst review so definitions, math, and units are consistent across sections. The report is refreshed annually, and interim updates are triggered when material events occur, such as major regulatory changes, material price shocks, or step-changes in delivery adoption. Right before delivery, we do a final pass to reflect the latest public data releases and relevant announcements.
Mordor Intelligence's Food Service Packaging Market Size Measured Against Other Published Estimates
Published market sizes for food service packaging do not always match because the counted products and the point of measurement can change from one study to another. In this space, the biggest differences usually come from whether delivery-only formats are counted fully, how reusable and sustainable packs are treated, and whether revenue is captured at manufacturer level or through downstream selling prices.
Production and trade signals, together with observed packaging price movement and interview-confirmed channel mix, are the checks that keep Mordor Intelligence tied to food service usage rather than wider food packaging revenue. When other estimates pull in adjacent retail packaging, apply broader product lists, or use aggressive unit growth without re-checking material substitution, the number can move a lot even if the headline category looks similar.
Benchmark comparison
| Source | Market Size | Gaps in Research Methodology |
|---|---|---|
| Mordor Intelligence | USD 139.75 B (2026) | |
| Industry Publisher A | USD 96.20 B (2024) | Uses a different base year and a broader segmentation structure, and the value can be closer to downstream pricing in some categories, which changes the counted revenue pool versus manufacturer-level packaging sales. |
| Industry Publisher B | USD 89.67 B (2023) | Anchors the market on an earlier base year and may apply different inclusion rules for delivery-focused items and sustainable formats, which can reduce unit intensity assumptions and the total value captured. |
Overall, the spread is mainly explained by timing and boundary choices, followed by how ASP progression is applied across materials and formats. By keeping the scope centered on food service usage and re-checking assumptions with practical channel and pricing evidence, the final market value stays transparent and repeatable for planning.


Key Questions Answered in the Report
What was the global value of the food service packaging market in 2026?
It stood at USD 139.75 billion and is projected to reach USD 171.06 billion by 2031.
Which region holds the largest share of demand for food-service packs?
Asia-Pacific leads with 40.32% share thanks to rising urban populations and delivery-food adoption.
Which material category is expanding fastest?
Biodegradable and specialty substrates will grow at a 5.42% CAGR through 2031 as bans on PFAS and single-use plastics take hold.
How are PFAS bans influencing quick-service restaurant packaging?
They are driving a pivot from plastic-coated papers to fully fiber-based lids and wraps compatible with compost or recycling streams.
Why are trays and containers outpacing cups in growth?
Delivery services and ghost kitchens prefer tamper-evident trays that travel better, pushing a 5.11% CAGR for this format.
What impact did Novolex’s acquisition of Pactiv Evergreen have?
The USD 6.7 billion deal created the largest integrated supplier, increasing competitive pressure and accelerating sustainable-material innovation.
Page last updated on:


