3D Printed Prosthetics Market Size and Share
Market Overview
| Study Period | 2020 - 2031 |
|---|---|
| Market Size (2026) | USD 2.99 Billion |
| Market Size (2031) | USD 4.18 Billion |
| Growth Rate (2026 - 2031) | 6.92% CAGR |
| Fastest Growing Market | Asia Pacific |
| Largest Market | North America |
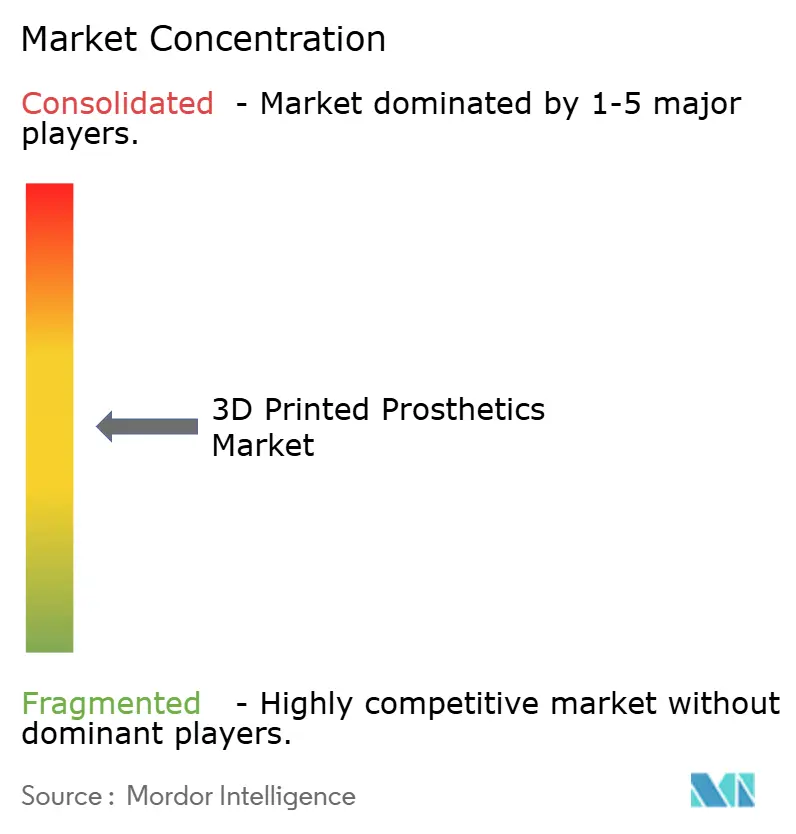
| Market Concentration | Medium |
Major Players *Disclaimer: Major Players sorted in no particular order Image © Mordor Intelligence. Reuse requires attribution under CC BY 4.0. | |
3D Printed Prosthetics Market Analysis by Mordor Intelligence
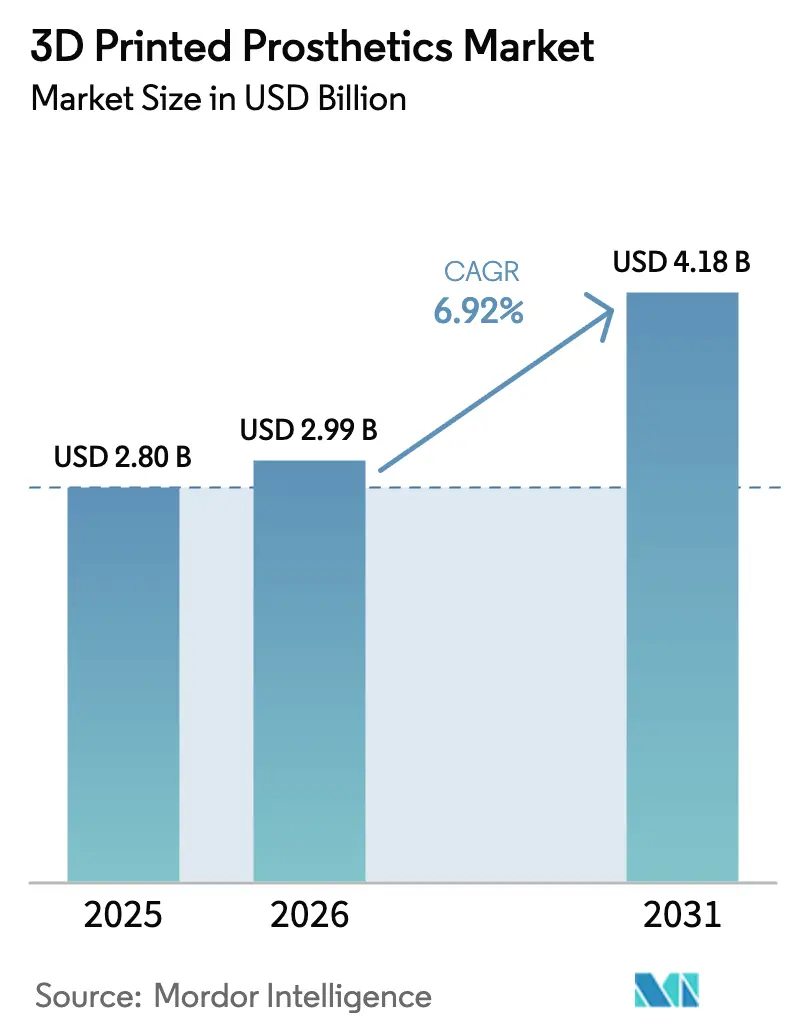
The 3D-printed prosthetics market size is expected to grow from USD 2.80 billion in 2025 to USD 2.99 billion in 2026 and is forecast to reach USD 4.18 billion by 2031 at 6.92% CAGR over 2026-2031. Technology convergence, stronger regulatory alignment with ISO 13485:2016, and wider clinical acceptance keep demand on an upward path[1]U.S. Food and Drug Administration, “Quality Management System Regulation: Amendments to Part 820,” fda.gov. AI-guided generative design helps manufacturers cut material use and weight while matching the functionality of conventionally produced limbs. Growth also benefits from point-of-care printing inside hospitals, which shortens delivery cycles from weeks to hours, and from community workshops that extend access in low-resource regions. The North American market enjoys fast approvals under the FDA’s updated Quality Management System Regulation, while Asia-Pacific accelerates on lower-cost supply models that bring clinically acceptable limbs to under-served users. Competitive activity centers on PEEK and titanium parts, neural-controlled hands, and multi-material builds that combine rigid and flexible zones in one print.
Key Report Takeaways
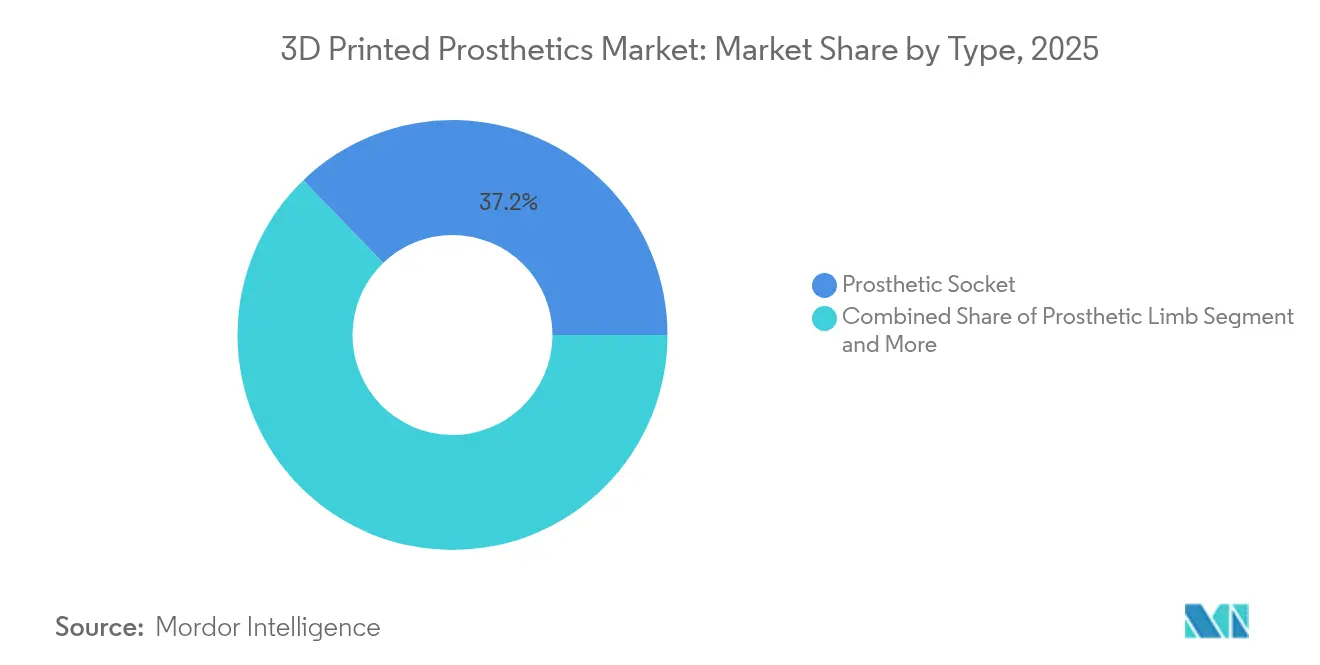
- By type, prosthetic sockets led with 37.21% of 3D-printed prosthetics market share in 2025, while myoelectric components are projected to expand at a 23.71% CAGR through 2031.
- By material, thermoplastics accounted for 42.08% of the 3D-printed prosthetics market size in 2025; biocompatible polymers are expected to post a 24.61% CAGR to 2031.
- By printing technology, Fused Deposition Modeling held 51.92% revenue share in 2025; Direct Metal Laser Sintering is on track for 23.58% CAGR to 2031.
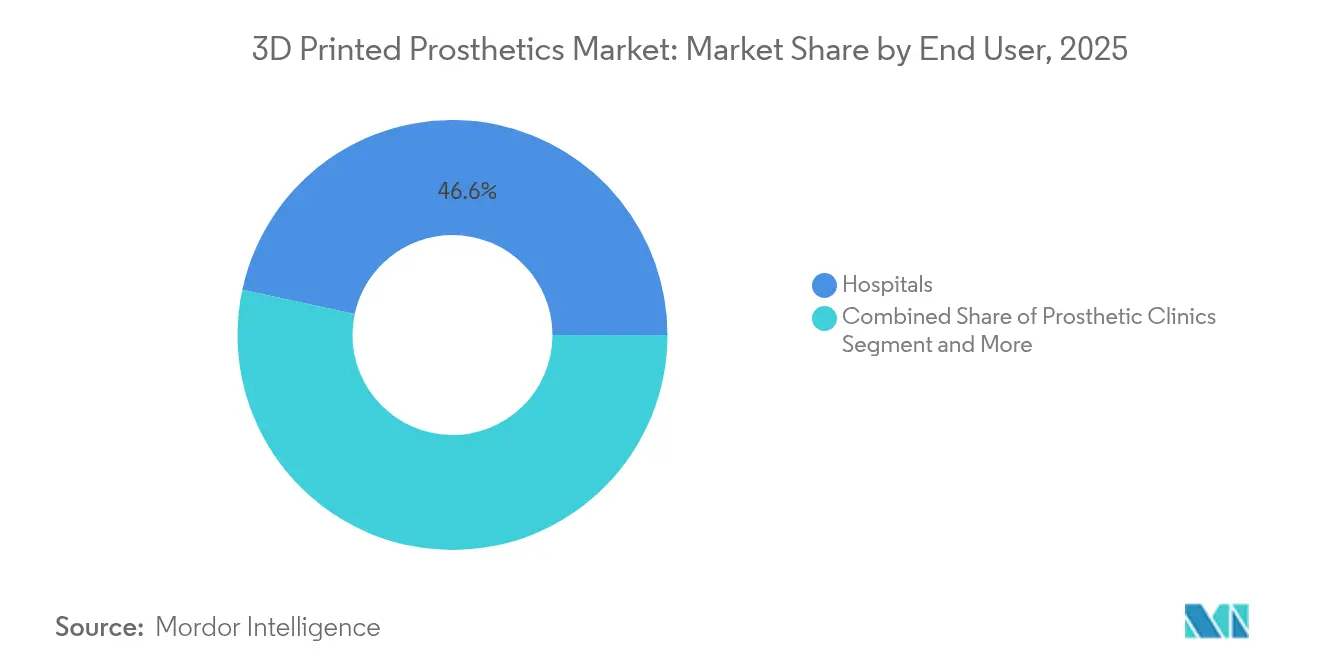
- By end user, hospitals commanded 46.62% revenue share in 2025, while home-care settings are advancing at 16.72% CAGR.
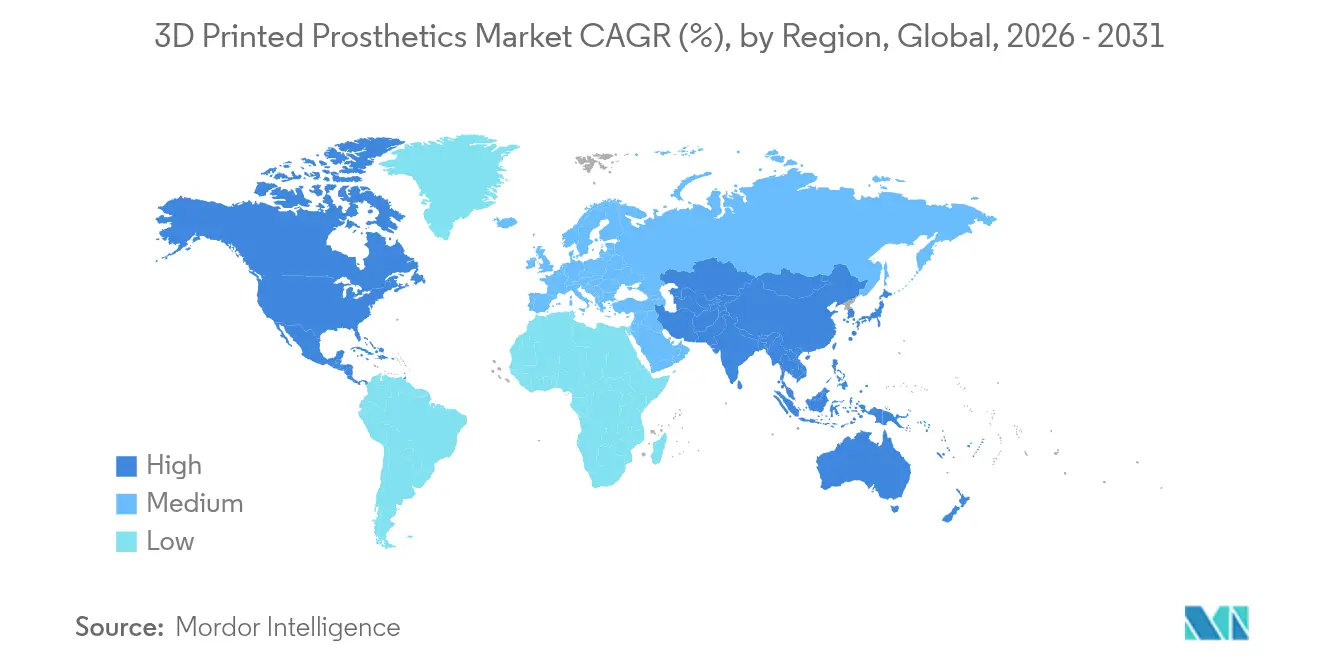
- By geography, North America led with 49.02% of 3D-printed prosthetics market share in 2025; Asia-Pacific is forecast to rise at 21.32% CAGR through 2031.
Note: Market size and forecast figures in this report are generated using Mordor Intelligence’s proprietary estimation framework, updated with the latest available data and insights as of 2026.
Global 3D Printed Prosthetics Market Trends and Insights
Drivers Impact Analysis*
| Driver | (~)% Impact on CAGR Forecast | Geographic Relevance | Impact Timeline |
|---|---|---|---|
| Growing demand for affordable and customizable prosthetics | +2.1% | Global, with strongest impact in Asia-Pacific and Latin America | Medium term (2-4 years) |
| Advancements in 3D-printing technologies | +1.8% | North America and EU leading, Asia-Pacific adoption accelerating | Short term (≤ 2 years) |
| Rising limb-loss incidence (diabetes, trauma) | +1.5% | Global, with higher impact in aging populations | Long term (≥ 4 years) |
| Open-source design communities in LMICs | +1.2% | Asia-Pacific, Africa, Latin America | Medium term (2-4 years) |
| AI-driven generative design for weight optimisation | +0.9% | North America and EU core, spill-over to Asia-Pacific | Short term (≤ 2 years) |
| Source: Mordor Intelligence | |||
Growing Demand for Affordable and Customizable Prosthetics
Traditional myoelectric limbs cost USD 9,000–40,000, yet printed counterparts come in near USD 440, cutting entry prices by 95% and bringing viable devices to low-income users. Volunteer networks such as e-NABLE Brasil now operate 59 printers and deliver limbs across five states, reflecting a scalable grassroots model. Custom scan-to-print workflows improve patient comfort and lower rejection rates. Community sites upload open-source files that local makers iterate for cultural needs, and the resulting decentralised supply shortens waiting lists. These economic and logistic advantages expand the addressable pool of adult and paediatric users and lift the entire 3D-printed prosthetics market.
Advancements in 3D-Printing Technologies
Single-step multi-material builds now combine rigid frames and flexible liners without manual assembly, cutting labour and error rates. 3D Systems gained FDA clearance for PEEK cranial implants and has already documented more than 60 clinical cases[3]3D Systems, “World’s First PEEK Cranial Implant Cleared by FDA,” 3dsystems.com. Titanium parts produced on Direct Metal Laser Sintering printers offer 30% weight reduction and strong osseointegration, while surface-activated PEEK variants improve tissue bonding. Layer resolutions of 50 microns let clinicians achieve smoother interfaces that minimise skin irritation. Development cycles drop from months to hours, letting hospitals fit a limb during the same inpatient visit and raising satisfaction scores.
Rising Limb-Loss Incidence from Diabetes and Trauma
Amputation rates tied to diabetes grow in ageing regions and war zones keep trauma cases high. The FDA’s predetermined change-control plan, effective 2024, lets manufacturers update a cleared device without another lengthy submission, which speeds availability for shifting clinical demands. Rwanda’s ORTHOLAB trains local technicians to design sockets from low-cost PLA, demonstrating how post-conflict nations can scale care. Global epidemiology trends therefore assure persistent need and sustain long-term revenue visibility for the 3D-printed prosthetics market.
AI-Driven Generative Design for Weight Optimisation
Real-time topology optimisation creates gyroid and lattice internals that preserve load paths while shedding mass. Neural networks now classify forearm EMG signals with 78.67% accuracy and respond within 80 milliseconds, giving users near-natural grip transitions mdpi.com. AI tools keep improving fit models by training on anonymised scan archives, lifting first-time-fit rates and cutting follow-up visits. Such self-learning loops lower lifetime service costs and improve device up-time, which further stimulates adoption.
Restraints Impact Analysis*
| Restraint | % Impact on CAGR Forecast | Geographic Relevance | Impact Timeline |
|---|---|---|---|
| Regulatory and quality-assurance complexity | -1.4% | Global, with highest impact in North America and EU | Medium term (2-4 years) |
| High material and printer costs | -1.1% | Global, with strongest impact in emerging markets | Short term (≤ 2 years) |
| Absence of durability test standards for lower-limb prints | -0.8% | Global, with regulatory focus in developed markets | Long term (≥ 4 years) |
| Source: Mordor Intelligence | |||
Regulatory and Quality-Assurance Complexity
Harmonising with ISO 13485:2016 raises documentation loads and validation costs, especially for small labs. The FDA’s draft guidance on chemical characterisation of devices remains under review, so material suppliers must invest in broad spectral and leachate studies before clearance. European MDR rules add clinical-evidence requirements that lengthen approval timelines. Each layer-by-layer build also forces new metrology methods, since hidden voids can affect strength. These hurdles slow market entry for new competitors.
High Material and Printer Costs
Grade-VI titanium powder and implant-grade PEEK carry premium prices, and DMLS systems exceed USD 500,000. Spare powder re-qualification steps and inert-gas handling lift operating costs. Emerging-market clinics face currency risk when importing consumables. Canadian clinicians report that while sockets can be 56–95% cheaper to print than to laminate, laboratory tests still question fatigue life, forcing over-engineering that pushes budgets up again. Rising raw-material prices therefore threaten cost-leadership strategies.
*Our forecasts treat driver/restraint impacts as directional, not additive. The impact forecasts reflect baseline growth, mix effects, and variable interactions.
Segment Analysis
By Type: Demand Shifts Toward Neural-Controlled Components
Prosthetic sockets captured 37.21% of 3D-printed prosthetics market share in 2025, underscoring their role as the primary interface between patient and limb. Automated socket design pipelines use 3D scans to deliver customised shells in under two hours, trimming clinic callbacks. Myoelectric components are the fastest climbers with a 23.71% CAGR and anchor the premium tier of the 3D-printed prosthetics market. EMG-responsive wrists already clock gesture-recognition accuracy near 90% and come in below 450 g, a weight threshold that improves all-day use. Limb and joint assemblies post steady sales because topology-optimised titanium hinges resist fatigue over two million cycles, a requirement for active adults. Cosmesis covers gain modest traction as fashion-centric users request colour-matched shells and embedded artwork.
Hybrid control systems that blend EMG with AI vision algorithms let hands auto-adjust grip force after object detection. Sports-oriented limbs leverage energy-return soles made with nested lattices to widen the sprint gate range. Clinics record lower rejection rates when sockets and electronics are co-designed, since alignment pins and cable exits match the scanned residual limb. These functional upgrades open premium reimbursement brackets where payer schedules support technology surcharges, which further widens market value.


By Material: Biocompatible Polymers Maintain Momentum
Thermoplastics led with 42.08% of revenue in 2025 thanks to low-temperature processing and broad colour options. Biocompatible polymers such as implant-grade PEEK rise at a 24.61% CAGR and command 38–45% price premiums that lift gross margins. First MDR-compliant PEEK facial implants printed at University Hospital Basel validate in-hospital builds and extend the 3D-printed prosthetics market size for polymer parts 3dsystems.com. Titanium remains the metal of choice for high-stress joints, while composite filaments with carbon fibres serve mid-range feet that need spring resilience without full metal cost. Experimental bio-resorbable blends target paediatric limbs that must adapt during growth spurts.
Advanced PEEK formulations incorporate barium sulfate for CT visibility and calcium phosphate for bone interlock, letting surgeons monitor osseointegration. Thermoplastic elastomers fill flexible gait zones and clip onto rigid frames with snap fits. Powder recovery stations recertify 95% of unused titanium, keeping scrap within tolerances set by ASTM standards. Such material choices allow manufacturers to balance performance, regulatory burden, and price points across every therapeutic class.
By End User: Home-Care Adoption Rises
Hospitals accounted for 46.62% of revenue in 2025 as they integrate scan-to-fit labs with existing orthotic services. Desktop printers rated for clinical use let technicians model sockets chair-side, and the resulting shorter discharge times raise hospital throughput. Home-care channels grow at 16.72% CAGR, aided by tutorial platforms that guide users through minor fit tweaks with remote oversight. Prosthetic clinics still dominate complex fitments, particularly for multi-articulating hands that need sensor calibration, while rehabilitation centres focus on gait training.
Distributed manufacturing reshapes service models. Makerspaces ship pre-tested kits that rural therapists assemble on site, and cloud dashboards track usage data to trigger predictive maintenance. Telehealth sessions let certified prosthetists fine-tune limb alignment via augmented-reality markers, lowering travel costs and keeping end users engaged. This decentralised system expands the 3D-printed prosthetics market size by opening access pockets previously served only by visiting missions.
By Printing Technology: Metal Sintering Gains Share
Fused Deposition Modeling retained 51.92% revenue share in 2025, buoyed by inexpensive PLA and PETG spools and printers priced under USD 5,000. Direct Metal Laser Sintering logs a 23.58% CAGR as titanium ankles and pylons move into mainstream care. Stereolithography serves cosmetic shells that need sub-50-micron surfaces, while Selective Laser Sintering provides mid-grade nylon feet with damping properties. Inkjet-based binder jetting finds niche use in colour-matched cosmesis covers.
DMLS enables intricate lattice cores that cut titanium weight by 30% yet pass ISO 10328 cyclic testing for 3 million heel-strike cycles. Build-rate advances now let a full-size tibial shell print in four hours, halving prior schedules. Automatic melt-pool monitoring logs each layer and exports datasets for regulatory audits, which supports the safety case for load-bearing approvals. Such technical gains underpin the projected shift toward metal parts in critical locations and fuel the broader 3D-printed prosthetics market.
Geography Analysis
North America retains leadership with 49.02% revenue share in 2025 because mature reimbursement codes and FDA guidance give providers confidence in supply chains. Point-of-care production gains acceptance at trauma centres where same-day limb replacement is now feasible. Venture investors back neural interface start-ups, and patent filings on AI-driven control algorithms accelerate. Canada’s clinical trials show cost savings of up to 95% versus laminated sockets, although fatigue verification remains a concern mdpi.com.
Asia-Pacific posts a rapid 21.32% CAGR through 2031. Japan’s Instalimb delivers below-knee legs for USD 400 and a 24-hour turnaround, using algorithmic design to offset technician shortages. South Korea’s fast-track route lets hospitals deploy 3D-printed parts for emergency care before full approval, shrinking time-to-market. China combines machine vision and automated carving to scale production while ensuring consistency. India’s cross-disciplinary teams report high comfort ratings on printed transtibial sockets, indicating strong local acceptance.
Europe advances under the Medical Device Regulation framework, which stresses traceability and technical documentation. Germany and the Netherlands emphasise sustainability by using recycled nylon in demo projects. Latin America and Africa expand through open-source networks. Brazil’s e-NABLE hub coordinates 72 volunteers and 59 printers, while Rwanda’s ORTHOLAB supplies free limbs and trains staff in scan-to-fit methods. Tanzania’s Lake Victoria Disability Centre prints sockets locally, ending 500-kilometre supply runs. These programmes illustrate the role of community fabrication in enlarging the 3D-printed prosthetics market across continents.

Competitive Landscape
Industry concentration is moderate. 3D Systems leverages early FDA clearances in PEEK and now installs EXT 220 MED units in hospitals that want onsite builds. Stratasys targets regenerative implants through a CollPlant alliance that prints collagen scaffolds. Materialise raises medical revenue 14% by integrating anatomical planning software with printer fleets. Hanger buys Fillauer to link clinical networks with proprietary feet and hands while maintaining brand autonomy.
Start-ups focus on price disruption. Open Bionics ships myoelectric hands for children at a fraction of historic costs, and Homebrew Bionics uploads parts lists that hobbyists assemble with commodity servos. Phantom Neuro draws USD 19 million in funding for phantom-limb signal capture, aiming to remove electrodes from the control loop. Strategic consolidations revolve around talent for AI design, materials science, and regulatory filing expertise.
Patent landscapes show 2,000-plus filings by Össur in mobility components. Companies race to lock IP on AI-assisted lattice generators, flexible circuit routing, and biocompatible surface treatments. Partnerships with hospital groups accelerate clinical validation, and training programmes certify technicians on ISO 13485 processes. Overall, firms that can combine scalable technology, low cost, and regulatory compliance hold the best prospect for long-term gains in the 3D-printed prosthetics market.
3D Printed Prosthetics Industry Leaders
Ossur hf
Stratasys Ltd.
Materialise NV
Blatchford Group
3D Systems Corporation
- *Disclaimer: Major Players sorted in no particular order

Recent Industry Developments
- June 2025: 3D Systems and University Hospital Basel implanted the world’s first MDR-compliant 3D-printed PEEK facial implant produced at point-of-care.
- June 2025: Restor3d secured USD 70 million in growth funding, lifting total raised capital to USD 93 million and supporting expansion of patient-specific orthopedic implants.
- February 2025: Hanger finalized the Fillauer acquisition to broaden orthotic and prosthetic offerings while preserving brand independence.
- January 2025: Enovis Corporation completed acquisition of LimaCorporate for EUR 800 million, adding 3D-printed Trabecular Titanium implants to its reconstruction portfolio.


Research Methodology Framework and Report Scope
Market Definitions and Key Coverage
Our study defines the 3D-printed prosthetics market as all externally worn limb and joint components, sockets, complete limbs, fingers, and cranio-facial plates, manufactured layer-by-layer from a digital file using additive technologies such as fused deposition modeling, selective laser sintering, and stereolithography. Devices made by traditional subtractive milling or cast-and-fit processes fall outside this scope, so every revenue datapoint traces back to a print-first workflow validated with hospital or clinic invoices.
Scope exclusion: internal orthopedic or dental implants and hobbyist do-it-yourself kits are not counted.
Segmentation Overview
- By Type
- Prosthetic Socket
- Prosthetic Limb
- Prosthetic Joint
- Myoelectric Components
- Other Types
- By Material
- Thermoplastics (PLA, ABS, PETG)
- Biocompatible Polymers (PEEK, PMMA)
- Metals (Titanium, SS)
- Composites (Carbon-fibre, Nylon)
- Bioresorbable Polymers
- By End User
- Hospitals
- Prosthetic Clinics
- Rehabilitation Centers
- Academic and Research Institutes
- Home-care Settings
- By Printing Technology
- Fused Deposition Modelling (FDM)
- Stereolithography (SLA)
- Selective Laser Sintering (SLS)
- Direct Metal Laser Sintering (DMLS)
- Others (Inkjet, MJF)
- By Geography
- North America
- United States
- Canada
- Mexico
- South America
- Brazil
- Argentina
- Rest of South America
- Europe
- United Kingdom
- Germany
- France
- Italy
- Spain
- Nordics
- Rest of Europe
- Middle East and Africa
- Middle East
- Saudi Arabia
- United Arab Emirates
- Turkey
- Rest of Middle East
- Africa
- South Africa
- Egypt
- Nigeria
- Rest of Africa
- Middle East
- Asia-Pacific
- China
- India
- Japan
- South Korea
- ASEAN
- Australia
- New Zealand
- Rest of Asia-Pacific
- North America
Detailed Research Methodology and Data Validation
Primary Research
We interviewed prosthetists, rehabilitation surgeons, printer OEM application engineers, and reimbursement officers across North America, Europe, and five high-growth Asia-Pacific markets. These conversations clarified average print cycles, failure-rate benchmarks, and price sensitivities, letting us adjust secondary numbers and pressure-test material yield assumptions.
Desk Research
Mordor analysts gathered foundational figures from tier-1 public sources such as the World Health Organization's limb-loss epidemiology tables, the U.S. Food and Drug Administration's 510(k) clearance files, customs shipment records for polypropylene and PEEK powders, and annual statistics released by the American Orthotics & Prosthetics Association. Company 10-Ks, investor decks, and press releases gave visibility on printer sales, material ASPs, and install bases across key clinics. Where deeper context was needed, our team drew on paid databases, D&B Hoovers for revenue splits, Dow Jones Factiva for deal flow, and Questel for recent patents on myoelectric sockets.
Additional corroboration came from peer-reviewed papers in journals like Prosthetics & Orthotics International and regional health-ministry procurement dashboards that list per-patient reimbursement ceilings. This desk work established baseline adoption rates, cost curves, and regulatory momentum across 30 countries. The sources cited above are illustrative; many more inputs fed the evidence pool.
Market-Sizing & Forecasting
A top-down prevalence model converts annual amputation incidence, diabetes rates, and trauma statistics into a demand pool, which is then filtered through device utilization, replacement frequency, and 3D-print penetration. Select bottom-up roll-ups, sampled clinic volumes multiplied by verified ASPs, serve as guardrails. Key variables include polypropylene price trends, printer throughput (parts per hour), regulatory approval lead times, average pediatric refit cycles, and insurance reimbursement caps. Forecasts use multivariate regression aligned with primary-research consensus and scenario stress tests; gaps in bottom-up data are bridged with region-specific substitution ratios derived from customs imports.
Data Validation & Update Cycle
Model outputs undergo variance checks against external shipment data and historical prosthetic purchase records. Senior analysts review anomalies, and an annual refresh is standard, with interim updates triggered by material events like major reimbursement code changes.
Why Mordor's 3D Printed Prosthetics Baseline Earns Trust Worldwide
Published estimates often diverge because firms pick different device baskets, assume varying replacement cadences, or lock in a single global ASP before currency conversion.
Key gap drivers center on scope, penetration math, and refresh cadence. Some publishers fold in low-cost hobby prints, others over-extrapolate emerging-market uptake, while a few reuse decade-old incidence ratios. Mordor selects clinically fitted devices only, uses region-tuned penetration models, and refreshes every twelve months, thereby minimizing drift.
Benchmark comparison
| Market Size | Anonymized source | Primary gap driver |
|---|---|---|
| USD 2.80 bn (2025) | Mordor Intelligence | - |
| USD 1.51 bn (2024) | Global Consultancy A | Includes hobbyist devices; limited hospital procurement sampling |
| USD 3.54 bn (2024) | Industry Association B | Uniform global adoption rate and single ASP assumption |
| USD 1.79 bn (2024) | Trade Journal C | Relies on voluntary company disclosures; lacks incidence modeling |
These comparisons show that Mordor's disciplined scope selection, variable tracking, and annual refresh deliver a balanced, transparent baseline that decision-makers can replicate and trust.


Key Questions Answered in the Report
What is the current value of the 3D-printed prosthetics market?
The market is valued at USD 2.99 billion in 2026 and is set to reach USD 4.18 billion by 2031.
Which component segment is expanding the fastest?
Myoelectric components grow at a 23.71% CAGR because AI-enabled control systems raise functionality.
Why is Asia-Pacific the fastest-growing region?
Affordable supply models, supportive regulation, and large unmet demand push regional CAGR to 21.32%.
How do printed limbs cut costs against traditional manufacturing?
Scan-to-print workflows and distributed production trim material waste and remove multiple fitting steps, dropping prices by up to 95%.
What main restraint slows wider adoption?
Regulatory complexity adds validation cost and time, particularly for new materials and load-bearing parts.
Page last updated on:


