Automated 3D Printing Market Size and Share
Market Overview
| Study Period | 2020 - 2031 |
|---|---|
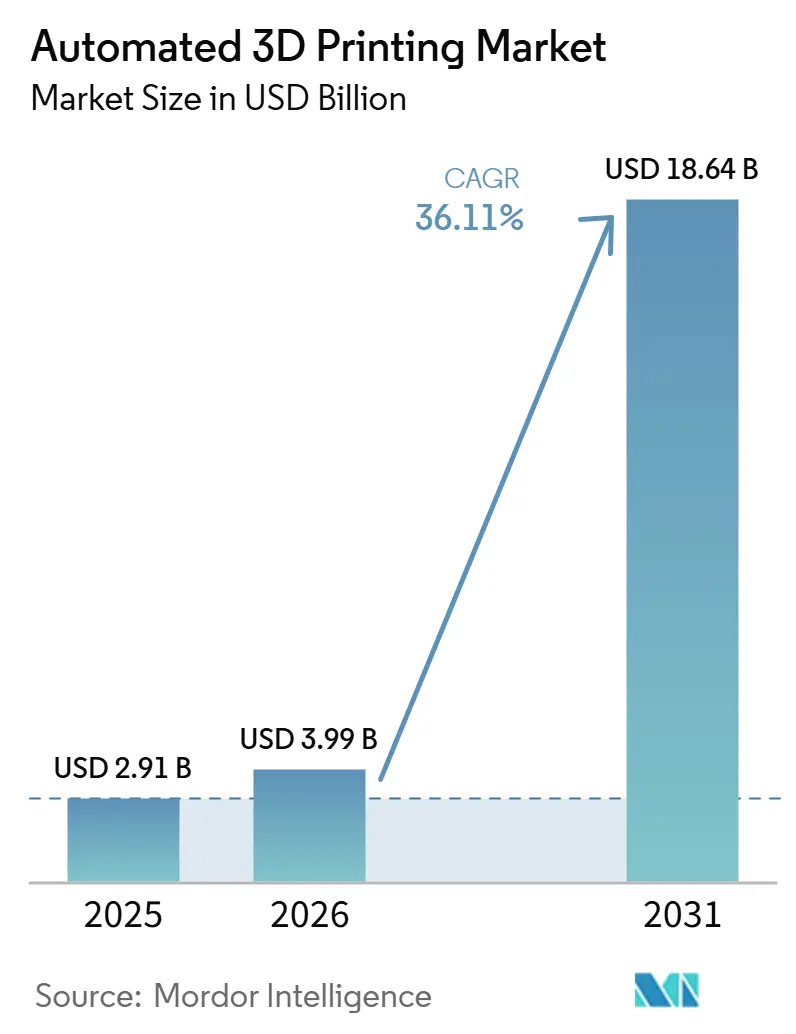
| Market Size (2026) | USD 3.99 Billion |
| Market Size (2031) | USD 18.64 Billion |
| Growth Rate (2026 - 2031) | 36.11% CAGR |
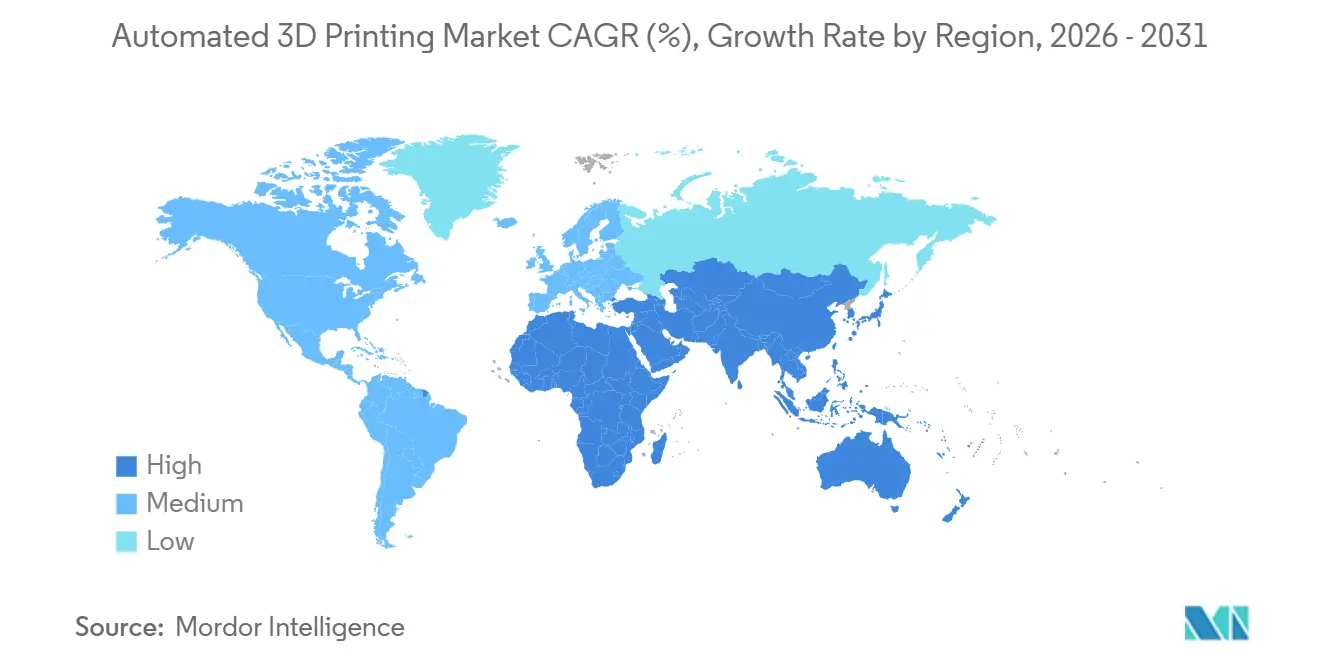
| Fastest Growing Market | Asia-Pacific |
| Largest Market | North America |
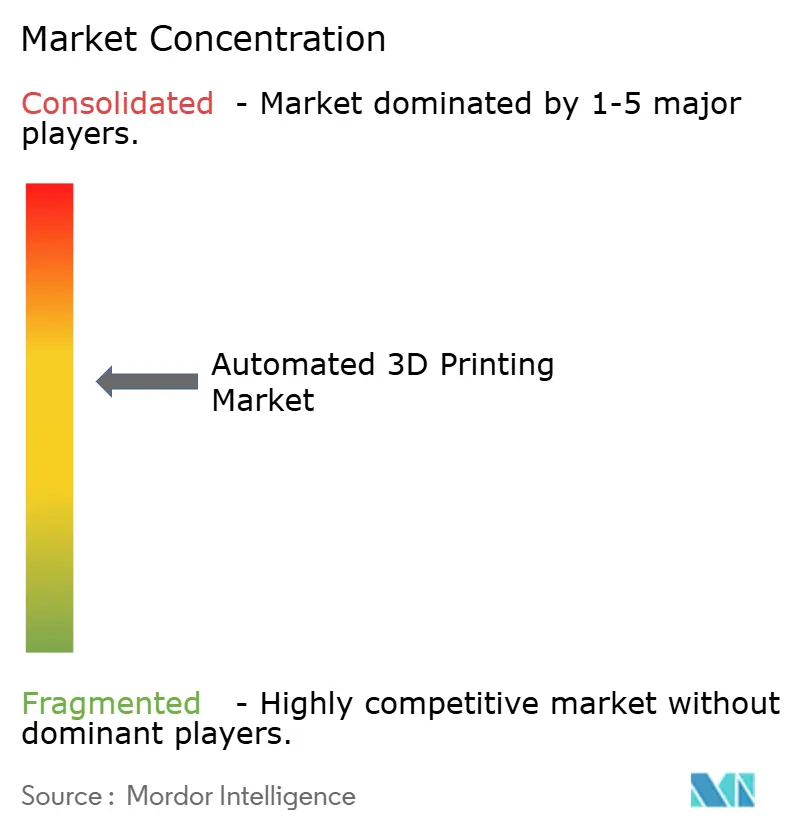
| Market Concentration | Medium |
Major Players *Disclaimer: Major Players sorted in no particular order Image © Mordor Intelligence. Reuse requires attribution under CC BY 4.0. | |
Automated 3D Printing Market Analysis by Mordor Intelligence
The Automated 3D Printing market size is expected to grow from USD 2.91 billion in 2025 to USD 3.99 billion in 2026 and is forecast to reach USD 18.64 billion by 2031 at a 36.11% CAGR over 2026-2031. Demand is accelerating as factories transition from prototype-oriented workcells to fully automated production lines that blend robotic material handling, AI-driven process monitoring, and closed-loop quality control. Enterprises are shifting capital toward hybrid machines that consolidate additive, subtractive, and inspection steps into a single enclosure, while software platforms unify machine telemetry with compliance records to satisfy aerospace and medical audits. Services revenue is expanding rapidly because on-demand bureaus let firms avoid depreciation risk, and national reshoring programs shorten certification lead-times for mission-critical parts. Competitive intensity is rising as hardware vendors integrate upstream into software and downstream into service contracts, compressing margins for standalone machine sales.
Key Report Takeaways
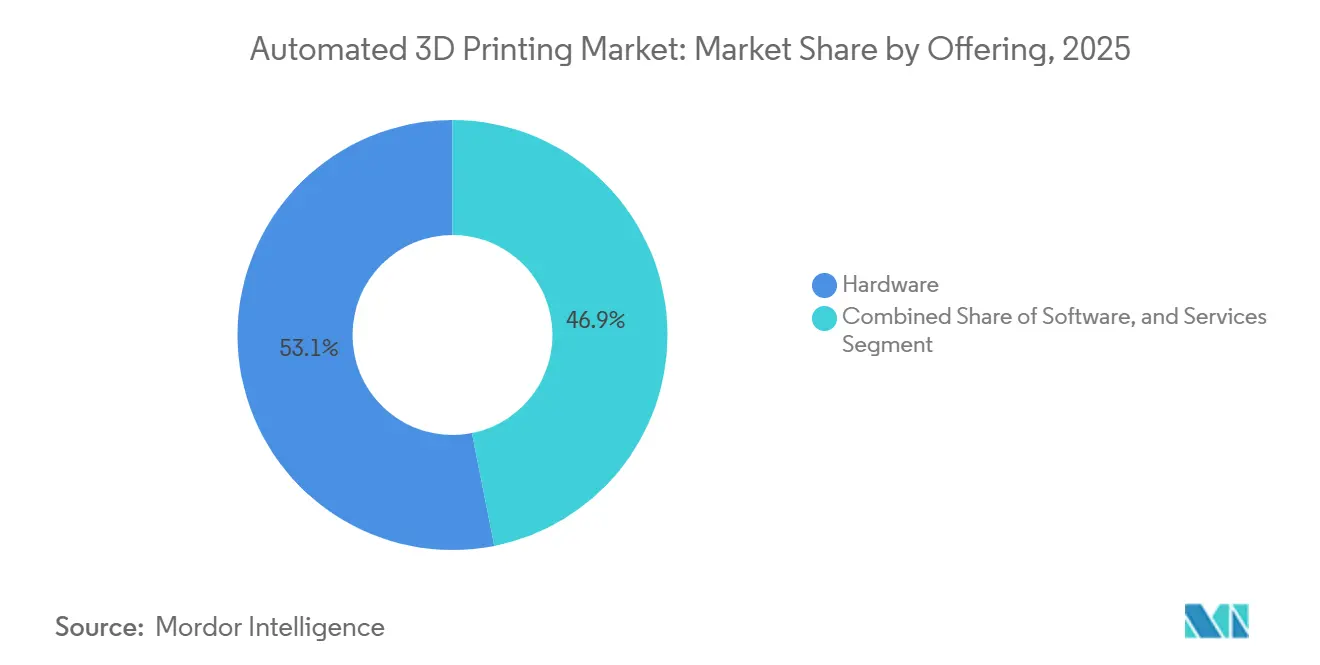
- By offering hardware, it retained a 53.11% share in 2025, whereas services are projected to register a 37.21% CAGR through 2031 as buyers favor variable-cost outsourcing.
- By process, automated production led with 38.49% of the Automated 3D Printing market share in 2025, while multiprocessing is forecast to expand at a 37.35% CAGR through 2031.
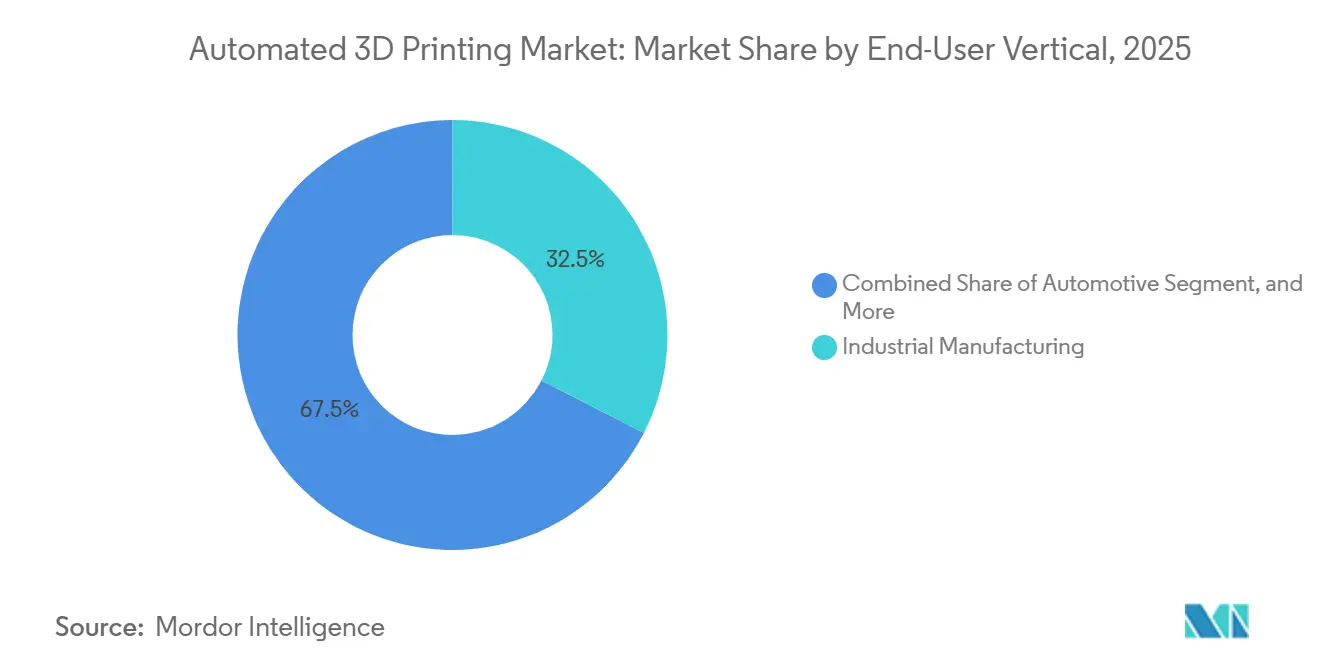
- By end-user vertical, industrial manufacturing accounted for 32.53% of revenue in 2025, yet healthcare is set to grow fastest at a 36.99% CAGR over 2026-2031.
- By application, prototyping accounted for 41.21% of spend in 2025, and manufacturing of end-use parts is advancing at a 36.91% CAGR through 2031.
- By geography, North America accounted for 34.83% revenue in 2025, although Asia-Pacific is projected to rise at a 36.78% CAGR through 2031.
Note: Market size and forecast figures in this report are generated using Mordor Intelligence’s proprietary estimation framework, updated with the latest available data and insights as of January 2026.
Global Automated 3D Printing Market Trends and Insights
Drivers Impact Analysis*
| Driver | (~) % Impact on CAGR Forecast | Geographic Relevance | Impact Timeline |
|---|---|---|---|
| Software, Sensor, and AI Convergence Enabling Lights-Out Factories | +8.2% | Global, early adoption in Germany, the United States, and Japan | Medium term (2-4 years) |
| Rising Demand for Mass Customization at Scale | +7.9% | North America and Europe for consumer goods, Asia-Pacific for industrial tooling | Short term (≤ 2 years) |
| Growth in the Adoption of Robotics for Industrial Automation | +7.5% | Asia-Pacific core, spill-over to North America and Europe | Medium term (2-4 years) |
| Corporate Net-Zero Commitments Driving Lightweight Parts | +6.8% | Europe and North America aerospace and automotive clusters | Long term (≥ 4 years) |
| Government Incentives for Localized Manufacturing and Reshoring | +5.1% | United States, India, South Korea, European Union | Medium term (2-4 years) |
| Increasing Investments in R&D | +4.6% | Global, concentrated in OECD economies | Long term (≥ 4 years) |
| Source: Mordor Intelligence | |||


Software, Sensor and AI Convergence Enabling Lights-Out Factories
Real-time thermal imaging, acoustic monitoring, and layer-wise geometry checks now flag defects before they propagate, cutting scrap in metal powder-bed systems by up to 60%. Manufacturing execution systems link design files with machine telemetry and quality records, generating audit trails that satisfy AS9100 and ISO 13485 without manual logbooks. Collaborative robots equipped with force-torque sensors swap build plates in under 90 seconds, eliminating the need for two operators per shift. Large U.S. defense contractors already mandate digital-thread compliance under CMMC 2.0, accelerating the adoption of integrated software stacks.[1]International Electrotechnical Commission, “IEC 62443 Cybersecurity for Industrial Automation,” webstore.iec.chGermany and Japan lead hybrid machine design that embeds additive heads into multi-axis platforms, while IEC 62443 provides a security baseline for small and medium enterprises.
Rising Demand for Mass Customization at Scale
Consumer brands exploit lattice geometries that injection molding cannot match, compressing product cycles from 18 months to six weeks. Fully 3D-printed footwear eliminates assembly labor, letting micro-factories respond to regional trends within days. In healthcare, AI platforms generate patient-specific spinal cages from CT scans in 15 minutes, thereby shortening surgical planning time. Cosmetic firms print lattice applicators that reduce material waste by 30% while delivering a tailored tactile feel. Fewer regulatory hurdles in sporting goods speed adoption, whereas medical devices navigate ISO 10993 and FDA 510(k), but still benefit from the flexibility of additive workflows.
Growth in Adoption of Robotics for Industrial Automation
Adaptive robotic arms tune grip force to avoid damaging thin-walled parts during depowdering. Heavy-payload robots move 300-kilogram build plates between additive, heat-treatment, and machining stations without manual lifts. Deloitte’s 2025 survey showed that 47% of manufacturers are budgeting for additive-robotic integration within 2 years. South Korea’s K-AM Initiative earmarks USD 150 million for robotic post-processing modules that aim to halve per-part handling cost. Compliance frameworks such as ISO/TS 15066 guide collaborative-robot safety, while ANSI/RIA R15.08 governs industrial manipulators, ensuring global rollouts progress smoothly.
Corporate Net-Zero Commitments Driving Lightweight Parts
Aerospace and automotive OEMs replace castings with topology-optimized parts that slash mass by up to 50%, directly lowering fuel burn. Airbus has more than 800 printed brackets, ducts, and hinges flying on the A350, aligning with its ZEROe sustainability roadmap. Boeing operates 60,000 additive components across its fleets, including a 787 air-duct fitting that saves USD 3 million in materials and labor each year. Volkswagen integrates metal powder-bed systems to trim the weight of battery housings by 35%. Gas-turbine burner tips produced by laser fusion have logged 1.7 million operating hours with no field failures, boosting thermal efficiency for decarbonization goals. Science-based targets and ISO 14064 supply measurement protocols, though, still leave attributing emissions cuts to individual processes complex.
Restraints Impact Analysis*
| Restraint | (~) % Impact on CAGR Forecast | Geographic Relevance | Impact Timeline |
|---|---|---|---|
| High Initial Capital Expenditure | -5.3% | Global, acute in emerging markets with limited credit access | Short term (≤ 2 years) |
| Limited Qualified Materials Catalog | -3.7% | Global, especially aerospace and medical sectors | Medium term (2-4 years) |
| Cyber-Physical Security Risks in Fully Automated Cells | -2.9% | North America, Europe, developed Asia-Pacific markets | Short term (≤ 2 years) |
| Interoperability Issues Across Proprietary Platforms | -2.4% | Global, most acute in multi-vendor environments | Medium term (2-4 years) |
| Source: Mordor Intelligence | |||
High Initial Capital Expenditure
Industrial metal printers cost USD 0.5-5 million, a hurdle for small enterprises that lack affordable leases. EY’s 2024 survey found that 62% of manufacturers cited capital constraints as the top barrier to adoption. Service bureaus alleviate balance-sheet pressure; one leading provider booked USD 127.5 million in additional revenue in Q3 2024 on a pay-per-part model. Online marketplaces offering instant quotes posted 18.9% year-over-year sales growth, signaling demand for asset-light procurement. Lending programs from the U.S. Small Business Administration and the European Investment Bank reduce interest rates, yet many firms remain unaware of these options.
Limited Qualified Materials Catalogue
Fewer than 50 metal powder grades meet aerospace and medical certification requirements, and generating full mechanical datasets can cost up to USD 500,000 per alloy.[2]National Aeronautics and Space Administration, “MSFC-STD-3716,” nasa.gov ASTM F42 and ISO/ASTM 52900 published 14 new standards between 2023 and 2025, but certification backlogs stretch 18 months. The 2024 MMPDS-17 handbook added Ti-6Al-4V and Inconel 718 allowables, giving designers trusted values. America Makes pooled data from 12 OEMs to accelerate Department of Defense qualification, trimming timelines by 40%. Powder recipes often need retuning across different machines, fragmenting supply chains and inflating inventory costs.
*Our forecasts treat driver/restraint impacts as directional, not additive. The impact forecasts reflect baseline growth, mix effects, and variable interactions.
Segment Analysis
By Offering: Services Accelerate as Firms Favor Variable-Cost Models
Hardware captured the largest slice of the Automated 3D Printing market revenue at 53.11% in 2025, reflecting investment in multi-laser powder-bed systems and hybrid machines. However, demand now tilts toward service bureaus that convert capex into opex, letting clients avoid technology obsolescence. A leading on-demand provider posted USD 127.5 million in additive sales in Q3 2024, highlighting growing demand for quick-turn parts. Marketplaces that match 7,000 qualified suppliers with buyers process quotes in seconds, shrinking procurement cycles and widening access to capacity.
Services are projected to outpace hardware at a 37.21% CAGR to 2031, underpinned by subscription bundles that wrap software, consumables, and predictive maintenance into multiyear contracts. Simulation suites automate support generation and build orientation, cutting pre-production labor by 50%. Machine vendors increasingly embed remote diagnostics and real-time monitoring, satisfying ISO 9001 and AS9100 audits with minimal paperwork. The Automated 3D Printing market size for services, therefore, expands steadily as firms scale part volumes without heavy balance-sheet exposure.


By Process: Multiprocessing Compresses Lead Times
Automated production dominated in 2025 with a 38.49% share, yet multiprocessing is projected to expand at a robust 37.35% annually as hybrid cells integrate multiple manufacturing processes, including additive, subtractive, heat treatment, and inspection tasks. For instance, a five-axis laser deposition platform is now capable of repairing turbine blades in a single setup, effectively eliminating inter-operation queues and reducing aerospace tooling lead times by up to 60%.[3]Mazak Corp., “VARIAXIS i-300 AM,” mazakusa.com Additionally, compact hybrid machines are increasingly combining powder-bed modules with 12,000-rpm spindles, enabling the machining of conformal cooling channels in injection molds with greater efficiency.
As manufacturers strive to achieve one-day tool delivery, robotic part-handling systems are being deployed to autonomously swap 300-kilogram plates, significantly enhancing operational efficiency. Automated depowdering systems have also emerged as a critical innovation, cutting manual touch time by up to 70% in high-mix production environments. Furthermore, Hermle’s modular pallet pools now seamlessly interface with hybrid additive-subtractive cells, thereby increasing unmanned operational hours. Consequently, the Automated 3D Printing market is witnessing a shift, with multiprocessing gaining traction as factories aim to boost throughput without expanding their physical footprint.
By End-User Vertical: Healthcare Surges on Patient-Specific Workflows
Industrial manufacturing held 32.53% of the Automated 3D Printing market revenue in 2025, supplying jigs, fixtures, and custom tooling across discrete sectors. Yet healthcare now posts the highest growth, expected to climb at 36.99% CAGR as surgeons adopt patient-matched implants and guides. University surgeons achieved fusion rates comparable to those with off-the-shelf cages while reducing operating-room time by 20%. Ceramic hip cups with superior wear resistance earned the CE mark in 2024, widening orthopedic portfolios.
Medical adoption is accelerating as AI planning tools rapidly convert CT scans into build files in minutes, enabling faster, more efficient workflows. Automotive OEMs are also scaling up production volumes, aiming to manufacture 400,000 structural parts annually by 2027 to meet growing demand. Aerospace primes are actively planning to reshore additive components by 2026, a strategic move to reduce geopolitical risks and enhance supply chain resilience. As qualification pathways continue to mature, the Automated 3D Printing market size for healthcare is steadily narrowing the gap with industrial manufacturing, driven by technological advancements and increasing adoption across sectors.
By Application: End-Use Parts Move Toward Serial Production
Prototyping still accounted for 41.21% of spending in 2025, but the manufacturing of end-use parts is scaling at a 36.91% CAGR as qualification frameworks unlock serial production. For instance, a single airframe incorporates 60,000 additive parts, including a duct fitting that generates annual savings of USD 3 million. Additionally, more than 800 printed components are already operational on a twin-aisle jet, with plans to incorporate 50% sustainable materials by 2035, reflecting the industry's commitment to environmental sustainability.
Tooling applications are also witnessing significant advancements, with conformal cooling technology reducing cycle times by 30%, thereby enhancing production efficiency. Meanwhile, field-repair printers are revolutionizing military logistics by cutting associated costs by 90%. The adoption of standards such as NASA MSFC-STD-3716 and FDA 510(k) has further bolstered confidence in the structural integrity and biocompatibility of additive manufacturing processes. As the cost per part continues to decline, the Automated 3D Printing market share for end-use manufacturing is steadily increasing, driven by these technological and regulatory advancements.
Geography Analysis
North America accounted for 34.83% of the Automated 3D Printing market revenue in 2025. Federal grants worth USD 500 million accelerate aerospace qualification, compressing certification cycles from three years to 18 months. Boeing and Lockheed Martin expanded in-house metal powder-bed fleets to ensure 70% domestic sourcing by 2027. Canada invested CAD 50 million (USD 37 million) in a Montreal cluster, while Mexico’s nearshoring push installs hybrid cells that deliver automotive tooling within 48 hours.
Asia-Pacific is forecast to grow at 36.78% CAGR through 2031. India’s National Strategy funds titanium and nickel powder hubs at IITs, South Korea’s K-AM Initiative directs USD 150 million to shipbuilding hybrids, and Chinese OEMs captured 40% of regional hardware sales in 2025 despite aerospace material bottlenecks. Japan’s machine-tool giants integrate directed energy deposition with multi-axis machining, and Australian defense units deploy field printers for on-site repairs, illustrating diverse adoption drivers across the region.
Europe maintains a strong footprint through Horizon Europe grants and national programs. German Fraunhofer institutes collaborate with Siemens, EOS, and Trumpf on digital-twin monitoring, while EOS invested USD 3 million in Texas to serve U.S. clients. French joint venture AddUp supplies turbine components, and the United Kingdom’s Catapult centers accelerate medical and energy applications. The Middle East and Africa focus on energy and defense spare-parts localization, and South America remains nascent but grows in automotive and oil sectors as powder supply chains mature.

Competitive Landscape
The top five hardware vendors, Stratasys, 3D Systems, EOS, HP, and GE Additive, collectively accounted for approximately 35% of the automated 3D printing market revenue in 2025. This leaves significant opportunities for mid-tier challengers to capture market share. Nikon’s EUR 622 million (USD 703 million) acquisition of SLM Solutions in 2025 highlights cross-sector convergence, combining precision-optics metrology with advanced metal fusion capabilities. Similarly, Desktop Metal’s earlier acquisition of ExOne consolidated binder-jetting expertise under one organization, enabling streamlined cradle-to-grave workflows and enhancing operational efficiency.
Opportunities remain in hybrid repair cells for oversized energy and marine components, where wire-arc technology providers such as SPEE3D and AML3D stand out by offering low material costs and rapid deposition rates. These companies are carving out a niche by addressing specific needs in industries that require large-scale, cost-effective solutions.[4]Renishaw plc, “InfiniAM Central,” renishaw.com Competitive differentiation is increasingly driven by software ecosystems, with platforms like Renishaw’s InfiniAM Central and Authentise MES delivering real-time analytics that reduce operator skill requirements and improve production efficiency.
Strategic initiatives in the automated 3D printing market include vertical integration, geographic expansion, and partnerships with robotics specialists. For instance, Desktop Metal’s collaboration with Flexiv aims to halve depowdering labor, showcasing the importance of alliances in driving innovation and cost reduction. The market exhibits moderate concentration, with continuous repositioning as established players and new entrants compete to secure recurring revenue streams. This dynamic environment underscores the importance of adaptability and strategic foresight in maintaining a competitive edge.
Automated 3D Printing Industry Leaders
Stratasys, Ltd.
3D Systems Corporation
EOS GmbH
HP Inc.
General Electric Company
- *Disclaimer: Major Players sorted in no particular order

Recent Industry Developments
- March 2026: Stratasys Ltd announced advancements in its automated additive manufacturing platforms, focusing on software-driven workflow automation and scalable production systems.
- February 2026: HP Inc. expanded its Multi Jet Fusion ecosystem with new automation and material handling capabilities for high-volume production.
- January 2026: Siemens AG enhanced its additive manufacturing software portfolio to enable fully integrated, automated digital manufacturing workflows.
- December 2025: Desktop Metal Inc. introduced upgraded binder jetting systems designed for automated mass production of end-use metal parts.


Global Automated 3D Printing Market Report Scope
The automated 3D printing market is the global industry focused on integrating additive manufacturing technologies with automation systems to enable end-to-end, minimal-intervention production workflows. This includes the use of robotics, artificial intelligence (AI), advanced software, and interconnected hardware to streamline the entire 3D printing process, from design and material handling to printing, post-processing, and quality inspection.
The Automated 3D Printing Market Report is Segmented by Offering (Hardware, Software, and Services), Process (Automated Production, Material Handling, Part Handling, Post-Processing, and Multiprocessing), End-User Vertical (Industrial Manufacturing, Automotive, Aerospace and Defense, Consumer Products, Healthcare, Energy, and More), Application (Prototyping, Manufacturing of End-use Parts, Tooling, and More), and Geography (North America, South America, Europe, Asia-Pacific, Middle East, and Africa). The Market Forecasts are Provided in Terms of Value (USD).
| Hardware |
| Software |
| Services |
| Automated Production |
| Material Handling |
| Part Handling |
| Post-Processing |
| Multiprocessing |
| Industrial Manufacturing |
| Automotive |
| Aerospace and Defense |
| Consumer Products |
| Healthcare |
| Energy |
| Rest of End-user Verticals |
| Prototyping |
| Manufacturing of End-use Parts |
| Tooling |
| Rest of Applications |
| North America | United States |
| Canada | |
| Mexico | |
| South America | Brazil |
| Argentina | |
| Rest of South America | |
| Europe | Germany |
| United Kingdom | |
| France | |
| Italy | |
| Spain | |
| Russia | |
| Rest of Europe | |
| Asia-Pacific | China |
| Japan | |
| India | |
| South Korea | |
| Australia and New Zealand | |
| Rest of Asia-Pacific | |
| Middle East | Saudi Arabia |
| United Arab Emirates | |
| Turkey | |
| Rest of Middle East | |
| Africa | South Africa |
| Nigeria | |
| Rest of Africa |
| By Offering | Hardware | |
| Software | ||
| Services | ||
| By Process | Automated Production | |
| Material Handling | ||
| Part Handling | ||
| Post-Processing | ||
| Multiprocessing | ||
| By End-user Vertical | Industrial Manufacturing | |
| Automotive | ||
| Aerospace and Defense | ||
| Consumer Products | ||
| Healthcare | ||
| Energy | ||
| Rest of End-user Verticals | ||
| By Application | Prototyping | |
| Manufacturing of End-use Parts | ||
| Tooling | ||
| Rest of Applications | ||
| By Geography | North America | United States |
| Canada | ||
| Mexico | ||
| South America | Brazil | |
| Argentina | ||
| Rest of South America | ||
| Europe | Germany | |
| United Kingdom | ||
| France | ||
| Italy | ||
| Spain | ||
| Russia | ||
| Rest of Europe | ||
| Asia-Pacific | China | |
| Japan | ||
| India | ||
| South Korea | ||
| Australia and New Zealand | ||
| Rest of Asia-Pacific | ||
| Middle East | Saudi Arabia | |
| United Arab Emirates | ||
| Turkey | ||
| Rest of Middle East | ||
| Africa | South Africa | |
| Nigeria | ||
| Rest of Africa | ||


Key Questions Answered in the Report
How fast is the Automated 3D Printing market projected to expand?
The Automated 3D Printing market is forecast to rise from USD 3.99 billion in 2026 to USD 18.64 billion by 2031 at a 36.11% CAGR.
Which segment is growing quickest within automated 3D printing?
Services, covering on-demand production and post-processing, is expected to post a 37.21% CAGR through 2031 as firms favor variable-cost outsourcing.
Why is healthcare adoption accelerating?
Patient-specific implants and surgical guides shorten operating-room time and align with regulatory approvals, propelling healthcare at a 36.99% CAGR.
What role do hybrid machines play in adoption?
Multiprocessing cells that merge additive, subtractive, and inspection steps cut lead times by up to 60% and are forecast to grow at a 37.35% CAGR.
How are governments influencing regional growth?
Programs such as the U.S. Future of Defense Manufacturing Act and India's National Strategy on Additive Manufacturing fund qualification centers and powder hubs, spurring local uptake.
What is the primary barrier for small firms entering this space?
High initial capital expenditure of USD 0.5-5 million per metal system limits adoption, pushing many businesses toward service bureaus and leasing models.
Page last updated on:


