3D Printing Materials And Services Market Size and Share
Market Overview
| Study Period | 2020 - 2031 |
|---|---|
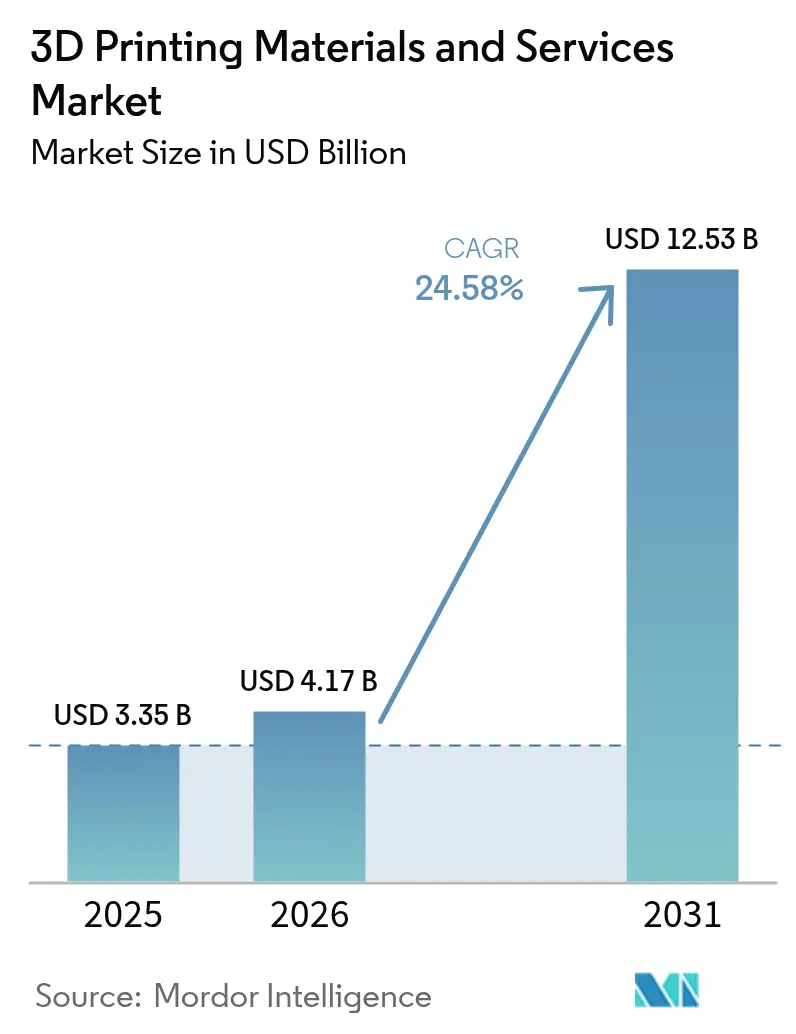
| Market Size (2026) | USD 4.17 Billion |
| Market Size (2031) | USD 12.53 Billion |
| Growth Rate (2026 - 2031) | 24.58% CAGR |
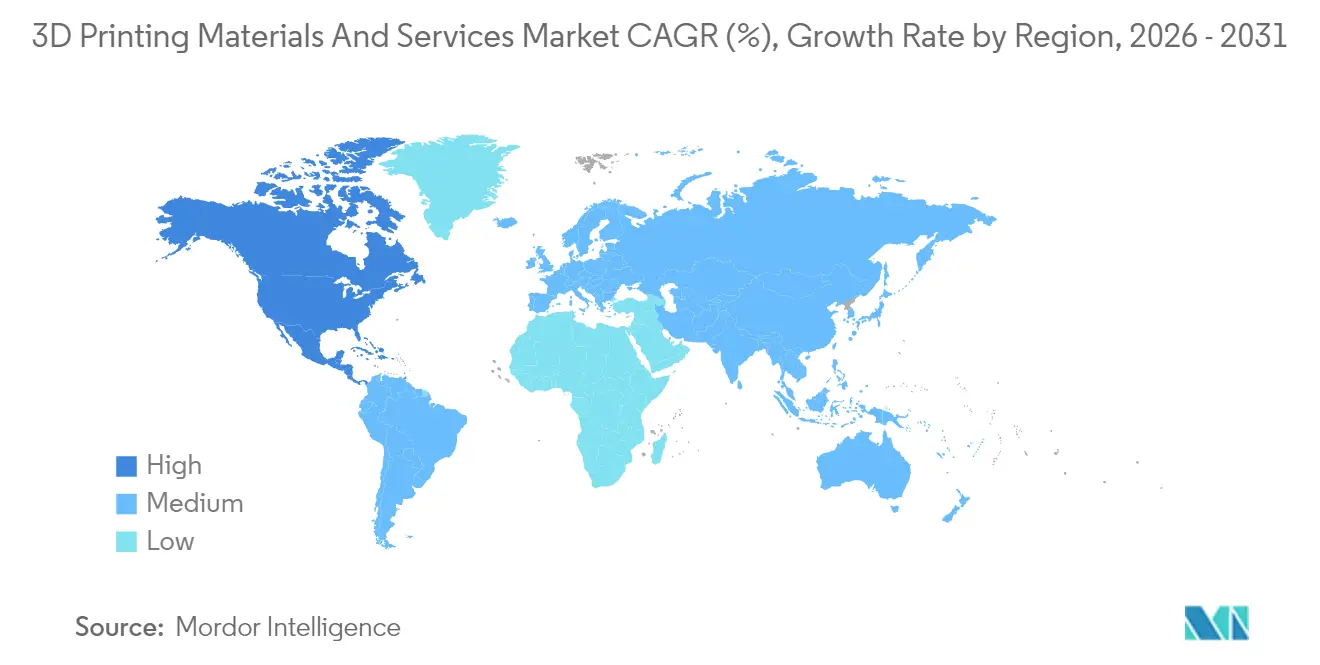
| Fastest Growing Market | Asia-Pacific |
| Largest Market | North America |
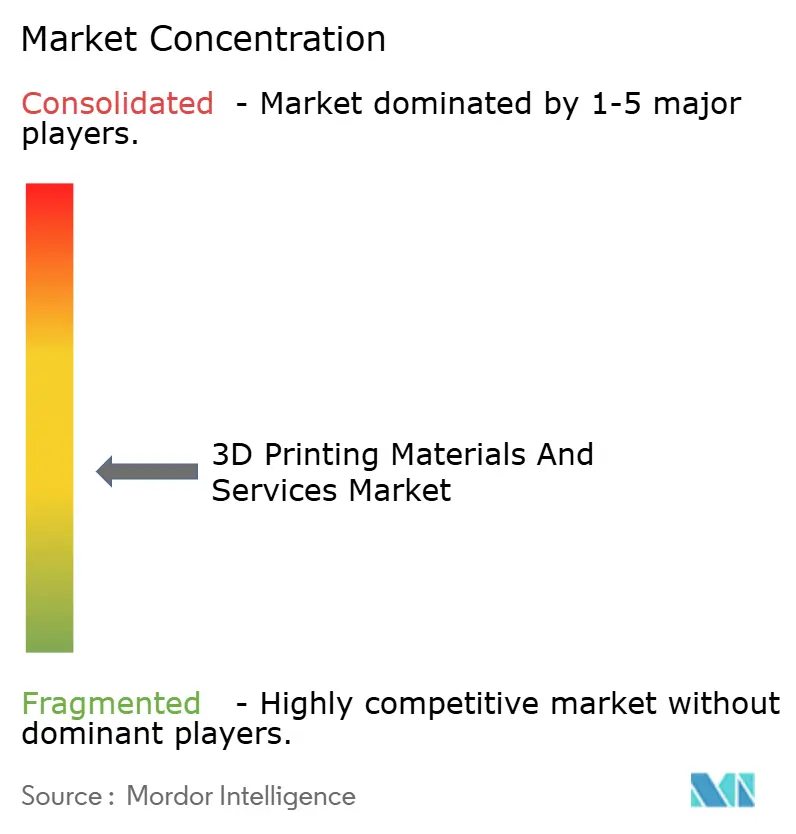
| Market Concentration | Medium |
Major Players *Disclaimer: Major Players sorted in no particular order Image © Mordor Intelligence. Reuse requires attribution under CC BY 4.0. | |
3D Printing Materials And Services Market Analysis by Mordor Intelligence
The 3D Printing Materials And Services Market size market is expected to grow from USD 3.35 billion in 2025 to USD 4.17 billion in 2026 and is forecast to reach USD 12.53 billion by 2031 at 24.58% CAGR over 2026-2031.
This growth reflects the steady shift from rapid prototyping to certified, production-grade uses in aerospace, healthcare and e-mobility. Demand is amplified by Print-as-a-Service subscriptions that let small and medium enterprises avoid large capital outlays, as well as by regulatory acceptance of metal additive manufacturing (AM) in flight-critical parts. Hybrid extrusion, bio-compatible polymers and recyclable filaments are widening the material palette, while cost-down pressures push manufacturers toward distributed, on-demand builds.
Momentum is supported by North American defense funding, EU Green Deal incentives and Asia Pacific’s digital manufacturing push. Services hold leadership with 58% revenue share in 2024 and also post the fastest 14% CAGR to 2030. FDM/FFF keeps the largest installed base, yet Multi Jet Fusion (MJF) and Binder Jetting are scaling 15% annually as their throughput and isotropic properties suit low-to-mid-volume production. Filament remains the dominant format, but powder usage is advancing 14% per year on the back of titanium and aluminum alloy adoption. Prototyping still commands 42% of revenue, though functional parts are increasing at 15% CAGR, particularly in aerospace where lightweight, consolidated structures shorten supply chains. Overall, the 3D printing materials and services market is entering a phase where certified production, sustainability and service models intersect to unlock new profit pools across industrial verticals.
Key Report Takeaways
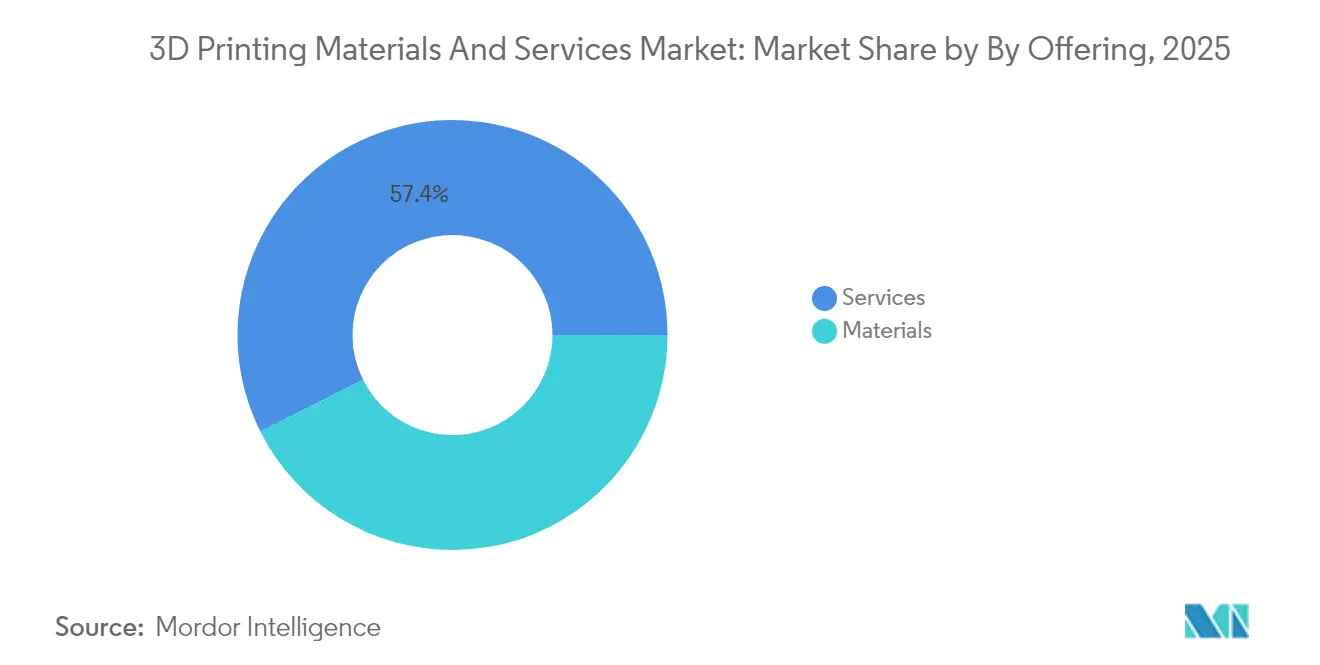
- By offering services, thecompanys captured 57.40% of the 3D printing materials and services market share in 2025; the segment is growing at a 13.55% CAGR through 2031.
- By technology, FDM/FFF led with 37.20% revenue share in 2025, while MJF and Binder Jetting are forecast to advance at a 13.20% CAGR between 2026-2031.
- By material form, filament commanded 47.10% of the 3D printing materials and services market size in 2025; powder formats are set to expand at a 12.90% CAGR to 2031.
- By application, prototyping held 41.30% revenue share in 2025; functional parts are the fastest-growing use at 13.40% CAGR through 2031.
- By end-user, aerospace and defense represented 29.30% revenue share in 2025; healthcare is projected to grow at 13.30% CAGR from 2026-2031.
- Geographically, North America led with 39.20% revenue in 2025, while Asia Pacific is on track for a 14.45% CAGR during 2026-2031.
Note: Market size and forecast figures in this report are generated using Mordor Intelligence’s proprietary estimation framework, updated with the latest available data and insights as of 2026.
Global 3D Printing Materials And Services Market Trends and Insights
Drivers Impact Analysis*
| Driver | (~) % Impact on CAGR Forecast | Geographic Relevance | Impact Timeline |
|---|---|---|---|
| Rapid adoption of metal AM in aerospace | +7.20% | North America, Europe | Medium term (2-4 years) |
| Cost-down pressure fueling on-demand services | +5.80% | North America, Europe | Short term (≤ 2 years) |
| Bio-compatible polymers for point-of-care | +4.50% | Asia Pacific, North America | Medium term (2-4 years) |
| Hybrid extrusion for lightweight e-mobility | +3.10% | Europe, Asia Pacific | Medium term (2-4 years) |
| Source: Mordor Intelligence | |||
Rapid adoption of metal AM in aerospace
Regulators now accept certified metal AM parts for flight use. Materialise obtained EN 9100 accreditation in 2025, unlocking the supply of structural titanium and aluminum components that meet aerospace quality standards. Parallel U.S. defense programs with America Makes are standardizing qualification pathways, and 3D Systems has already delivered over 2,000 mission-critical titanium or aluminum components for space missions.[2]3D Systems Corporation, “3D Systems Produces Over 2,000 Flight Components,” 3dsystems.comThese milestones validate AM for safety-critical parts, accelerating procurement away from legacy castings.
Cost-down pressure fueling on-demand services
Inventory inflation and tooling costs have led manufacturers to outsource builds to distributed service bureaus. MX3D raised EUR 7 million in 2025 to scale Wire Arc AM on a Print-on-Demand model that cuts raw-material waste by up to 90%. Protolabs reported USD 83 million in 2024 3D-printing revenue, illustrating commercial traction for service-first models that compress lead time and free cash flow.
Bio-compatible polymers for point-of-care
Hospitals in Asia now print surgical guides and implants on site using validated resins and PEEK blends. Stratasys offers BoneMatrix and GelMatrix on its J850 platform to fabricate realistic anatomical models that reduce operating-room time. The healthcare segment is forecast to expand 17.5% annually, reflecting rising acceptance of patient-specific AM solutions across orthopedics and dentistry.
Hybrid extrusion for lightweight e-mobility
Combining carbon fiber PA with elastomers in a single build yields brackets and battery housings with higher stiffness-to-weight ratios. BMW produced 300,000 printed parts in 2023, including grippers that are 25% lighter, which lowered cycle times and CO₂ output. Such multi-material deposition supports drivetrain and interior applications where mass reduction translates directly to extended vehicle range.
Restraints Impact Analysis*
| Restraint | (~) % Impact on CAGR Forecast | Geographic Relevance | Impact Timeline |
|---|---|---|---|
| Volatility of high-purity metal powder prices | -3.20% | Global, higher in Europe and North America | Medium term (2-4 years) |
| Limited qualification standards for critical parts | -2.80% | North America, Europe | Medium term (2-4 years) |
| Source: Mordor Intelligence | |||
Volatility of high-purity metal powder prices
Prices for titanium and copper powders swing with ore shortages and regulatory curbs, inflating bill-of-material costs for aerospace and medical builds. The titanium AM market is expected to reach USD 1.4 billion by 2032, yet supply instability forces OEMs to stockpile feedstock and recycle scrap to maintain margins, especially in Europe, where energy tariffs are high.
Energy-intensive post-processing inflating TCO
Support removal, heat treatment and surface finishing can account for one-third of energy use. Studies note that optimizing FFF parameters can cut consumption by up to 72%, but small firms often lack the capital for closed-loop systems, restraining wider adoption of the technology.
*Our forecasts treat driver/restraint impacts as directional, not additive. The impact forecasts reflect baseline growth, mix effects, and variable interactions.
Segment Analysis
By Offering: Services Sustain Dual Leadership
Services generated 57.40% of 2025 revenue and are expanding at a 13.55% CAGR as enterprises outsource design validation and low-volume production. The 3D printing materials and services market size for services stood at USD 1.92 billion in 2025 and is forecast to exceed USD 4.12 billion by 2031. Subscription packages from providers like 3Dock lower entry barriers for intermittent users. Materials, while smaller, fuel service innovation through higher-margin specialty powders and bio-polymers. The materials segment is growing 11.40% per year, propelled by powders for powder-bed fusion. Filament held the largest 47.10% share in 2025. HP’s halogen-free PA 12 FR illustrates how engineered polymers trim operating costs by 20% while meeting strict flame-retardancy norms. Advancements in recycled filament and composite pellets appeal to customers seeking lower environmental impact, reinforcing material-driven differentiation within service offerings.


By Technology: Emerging Methods Challenge FDM
FDM/FFF retained a 37.20% revenue share in 2025 through its vast installed base and accessible price point. The segment still registers 10.40% growth, but MJF and Binder Jetting are outpacing it at a 13.20% CAGR. These powder-based technologies deliver near-isotropic properties that suit jigs, fixtures, and low-to-mid-volume production runs. HP and INDO-MIM’s binder-jet partnership is scaling metal parts that pass aerospace validation, indicating readiness for serial output.
SLA, DLP, and SLS retain relevance for precision dental models and medical devices. EOS systems fabricate patient-specific cranial implants within days, enhancing hospital throughput. Wire Arc AM, currently niche, is gaining traction for large titanium structures in energy and maritime sectors, as demonstrated by MX3D’s funded expansion.
By Form (Materials): Powder Ascends
Filament dominated with 47.10% share in 2025, but powder formats are advancing 12.90% annually, reaching 33.20% share by 2031. The 3D printing materials and services market size for powders is projected to cross USD 3.55 billion by 2031 on the back of turbine blades, orthopedic implants and lightweight lattices produced via powder-bed fusion. Resin adoption is accelerating in dental and audiology niches, aided by bio-compatible, sterilizable chemistries that comply with ISO 10993. Resin system suppliers are also formulating plant-based feedstocks that answer EU directives on recyclability, demonstrating how sustainability imperatives steer material R&D.
By Application: Functional Parts Close the Gap
Prototyping preserved 41.30% of revenue in 2025, but functional parts printed in production-grade polymers and metals are rising at 13.40% CAGR. The 3D printing materials and services market share linked to functional parts is expected to reach 39.10% by 2031. Heat exchangers, satellite brackets and surgical implants illustrate the migration to end-use output. Tooling follows, with conformal-cooled injection molds and robot grippers saving lead time and weight. BMW cut 25% mass from grippers, lowering CO₂ per cycle and validating the ROI of printed tooling . Dental aligners and orthopedic inserts form another fast-growing niche, benefiting from rapid patient-specific design iterations.
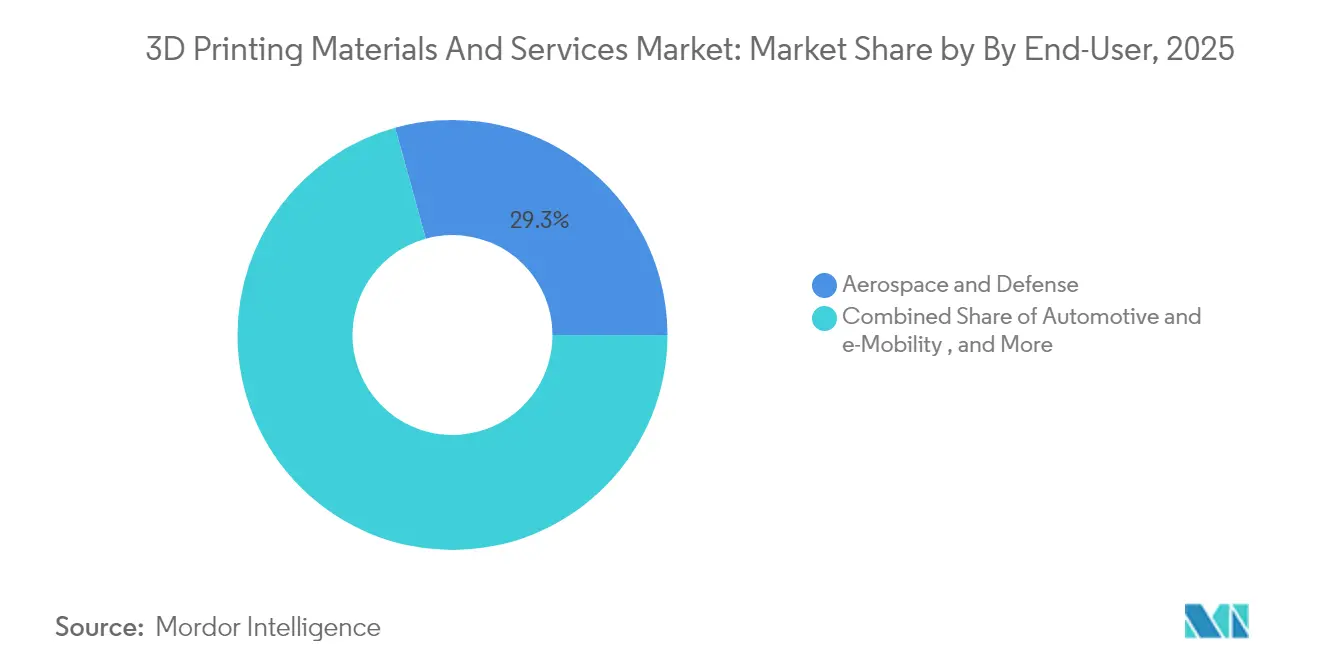
By End-User: Healthcare Gains Momentum
Aerospace and defense led with 29.30% revenue in 2025, supported by GE Aerospace and Airbus investments. Certified metal AM shortens spare-part lead time and cuts buy-to-fly ratios. Healthcare, however, exhibits the quickest 13.30% CAGR as hospitals embrace point-of-care printing for anatomical models and implants. The 3D printing materials and services market size allocated to healthcare is set to climb from USD 0.46 billion in 2025 to USD 1.24 billion by 2031. Automotive and e-mobility customers leverage hybrid extrusion and MJF for brackets, housings and interior personalization. Consumer products, industrial equipment and construction represent smaller shares but are scaling as retailers test mass customization and builders deploy printed formwork for complex concrete pours.
Geography Analysis
North America accounted for 39.20% of 2025 revenue. Defense programs accelerate metal AM qualification, and GE Aerospace’s USD 1 billion capacity expansion will strengthen domestic AM supply chains. Hospitals adopt printed anatomical models that cut surgical time by up to 30%, adding healthcare pull. Europe holds the second-largest position, bolstered by Germany’s installed base and EU incentives for recyclable materials. Fraunhofer’s project that converts polypropylene waste to filament illustrates policy-driven innovation. Spain’s designation as Formnext 2025 partner country underscores the region’s manufacturing renaissance and export orientation. Asia Pacific is the fastest-growing region at 14.45% CAGR. China deploys AM for automotive, electronics, and hip implants, while Japan emphasizes precision tooling. Government grants, a deep manufacturing ecosystem, and rising healthcare spending underpin demand. Emerging markets in South America and the Middle East use AM for oil-and-gas spares and aerospace parts, providing additional, though smaller, growth nodes.

Competitive Landscape
The field remains moderately fragmented. Top platforms include HP, Stratasys, 3D Systems, EOS, and Desktop Metal, yet consolidation is evident. Nano Dimension’s acquisition of Desktop Metal and Markforged combines complementary printer portfolios and material science competencies, signaling a pivot toward scale and standardization.
Differentiation depends on proprietary powders, recyclable polymers, and AI-driven print-parameter optimization. HP’s PA 12 FR exhibits 60% powder reusability and 20% lower TCO, reflecting the dual push for cost savings and sustainability. Service bureaus invest in simulation and automated post-processing to cut labor and guarantee repeatability. Start-ups focus on niche applications such as silicone bio-printing and large-format continuous-fiber composites, challenging incumbents on agility and domain expertise.
Innovation pipelines increasingly integrate sensor-based monitoring and machine-learning algorithms that predict part quality in real time. Vendors that combine hardware, qualified materials, software, and service ecosystems are best placed to capture subscription revenue across verticals.
3D Printing Materials And Services Industry Leaders
Ultimaker BV
3D Systems, Inc.
Höganäs AB
Arkema SA
Royal DSM (Covestro)
- *Disclaimer: Major Players sorted in no particular order

Recent Industry Developments
- May 2025: MX3D raised EUR 7 million to scale Wire Arc Additive Manufacturing capacity
- April 2025: 3D Systems debuted Figure 4 Tough 75C FR Black and efficiency upgrades to its EXT Titan printers.
- April 2025: HP launched halogen-free PA 12 FR and expanded automotive collaboration with Blazin Rodz
- February 2025: Spain named partner country for Formnext 2025, highlighting its expanding AM sector


Global 3D Printing Materials And Services Market Report Scope
The scope of the market studied is characterized by Technology Types such as Stereo Lithography (SLA), Fused Deposition Modeling (FDM), Electron Beam Melting, Digital Light Processing, Selective Laser Sintering (SLS), and Other Technologies, by Material Types such as Metal, Plastic, Ceramics, and Other Material Types, by End-user Industry Types such as Automotive, Aerospace and Defense, Healthcare, Construction and Architecture, Energy, Food, and Other End-user Industries and by Geography.
| Materials | Plastics (PLA, ABS/ASA, PETG, Photopolymers) |
| Metals (Ti-6Al-4V, Inconel, AlSi10Mg, SS 316L) | |
| Ceramics (Alumina, Zirconia, Silicon Nitride) | |
| CompositesandOthers (Carbon-Fiber, Bio-Polymers) | |
| Services | Rapid Prototyping |
| ToolingandFixtures | |
| Production / Bridge Manufacturing | |
| DesignandEngineering Services |
| FDM / FFF |
| SLS / SLA / DLP |
| MJFandBinder Jetting |
| DMLS / EBM / L-PBF |
| Other Emerging (LCD, CLIP, WAAM) |
| Filament |
| Powder |
| Liquid / Resin |
| Prototyping |
| Functional Parts |
| ToolingandMolds |
| DentalandOrthopedic Implants |
| AerospaceandDefense |
| Automotiveande-Mobility |
| HealthcareandLife Sciences |
| Industrial Machinery |
| Consumer ProductsandElectronics |
| ConstructionandArchitecture |
| North America | US |
| Canada | |
| Europe | Germany |
| France | |
| UK | |
| Rest of Europe | |
| Asia Pacific | China |
| Japan | |
| South Korea | |
| Rest of Asia Pacific | |
| South America | Brazil |
| Rest of South America | |
| Middle East and Africa | GCC |
| South Africa | |
| Rest of Middle East and Africa |
| By Offering | Materials | Plastics (PLA, ABS/ASA, PETG, Photopolymers) |
| Metals (Ti-6Al-4V, Inconel, AlSi10Mg, SS 316L) | ||
| Ceramics (Alumina, Zirconia, Silicon Nitride) | ||
| CompositesandOthers (Carbon-Fiber, Bio-Polymers) | ||
| Services | Rapid Prototyping | |
| ToolingandFixtures | ||
| Production / Bridge Manufacturing | ||
| DesignandEngineering Services | ||
| By Technology | FDM / FFF | |
| SLS / SLA / DLP | ||
| MJFandBinder Jetting | ||
| DMLS / EBM / L-PBF | ||
| Other Emerging (LCD, CLIP, WAAM) | ||
| By Form (Materials) | Filament | |
| Powder | ||
| Liquid / Resin | ||
| By Application | Prototyping | |
| Functional Parts | ||
| ToolingandMolds | ||
| DentalandOrthopedic Implants | ||
| By End-user | AerospaceandDefense | |
| Automotiveande-Mobility | ||
| HealthcareandLife Sciences | ||
| Industrial Machinery | ||
| Consumer ProductsandElectronics | ||
| ConstructionandArchitecture | ||
| By Geography | North America | US |
| Canada | ||
| Europe | Germany | |
| France | ||
| UK | ||
| Rest of Europe | ||
| Asia Pacific | China | |
| Japan | ||
| South Korea | ||
| Rest of Asia Pacific | ||
| South America | Brazil | |
| Rest of South America | ||
| Middle East and Africa | GCC | |
| South Africa | ||
| Rest of Middle East and Africa | ||


Key Questions Answered in the Report
What is the current value of the 3D printing materials and services market?
The market stands at USD 4.17 billion in 2026 and is forecast to reach USD 12.53 billion by 2031.
Which segment grows fastest within the market?
Services expand at 13.55% CAGR because Print-as-a-Service models remove large upfront equipment costs.
Why are MJF and Binder Jetting gaining share?
They deliver higher throughput and near-isotropic properties, supporting serialized production in automotive and consumer goods.
How are healthcare providers using 3D printing?
Hospitals use bio-compatible polymers to print patient-specific implants and anatomical models that can cut operating-room time by up to 30%.
What restrains wider AM adoption among small firms
High-purity metal powder price swings and the energy intensity of post-processing inflate total cost of ownership.
Page last updated on:


