Desktop 3D Printing Market Size and Share
Market Overview
| Study Period | 2020 - 2031 |
|---|---|
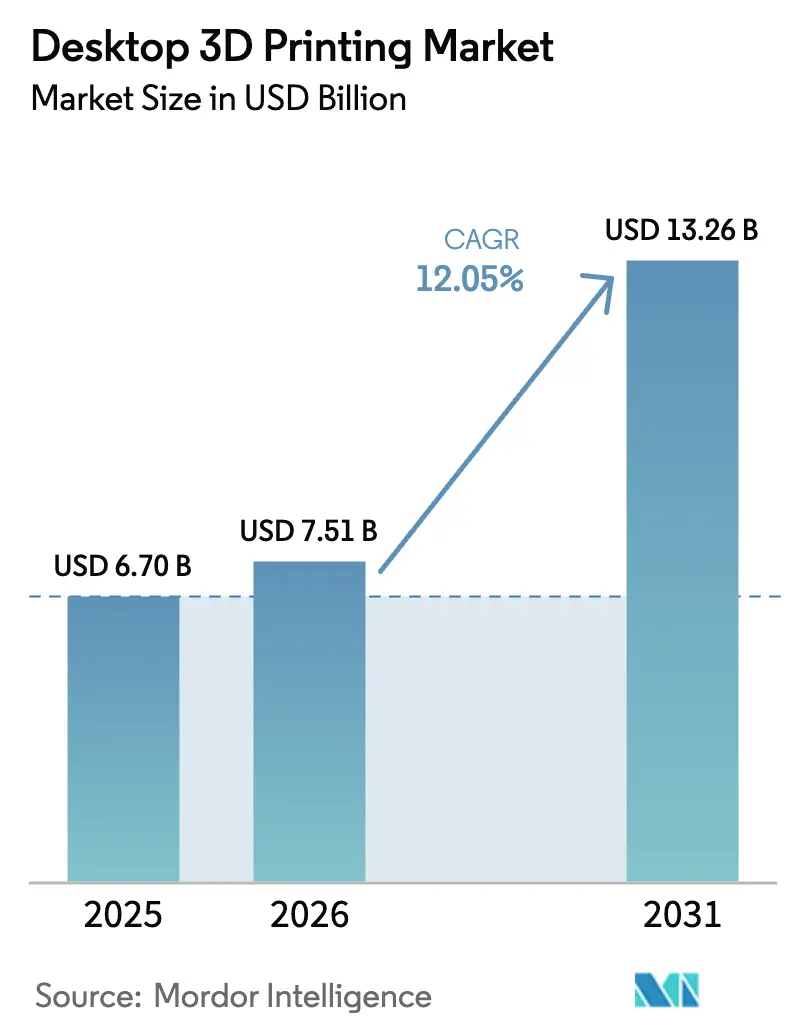
| Market Size (2026) | USD 7.51 Billion |
| Market Size (2031) | USD 13.26 Billion |
| Growth Rate (2026 - 2031) | 12.05% CAGR |
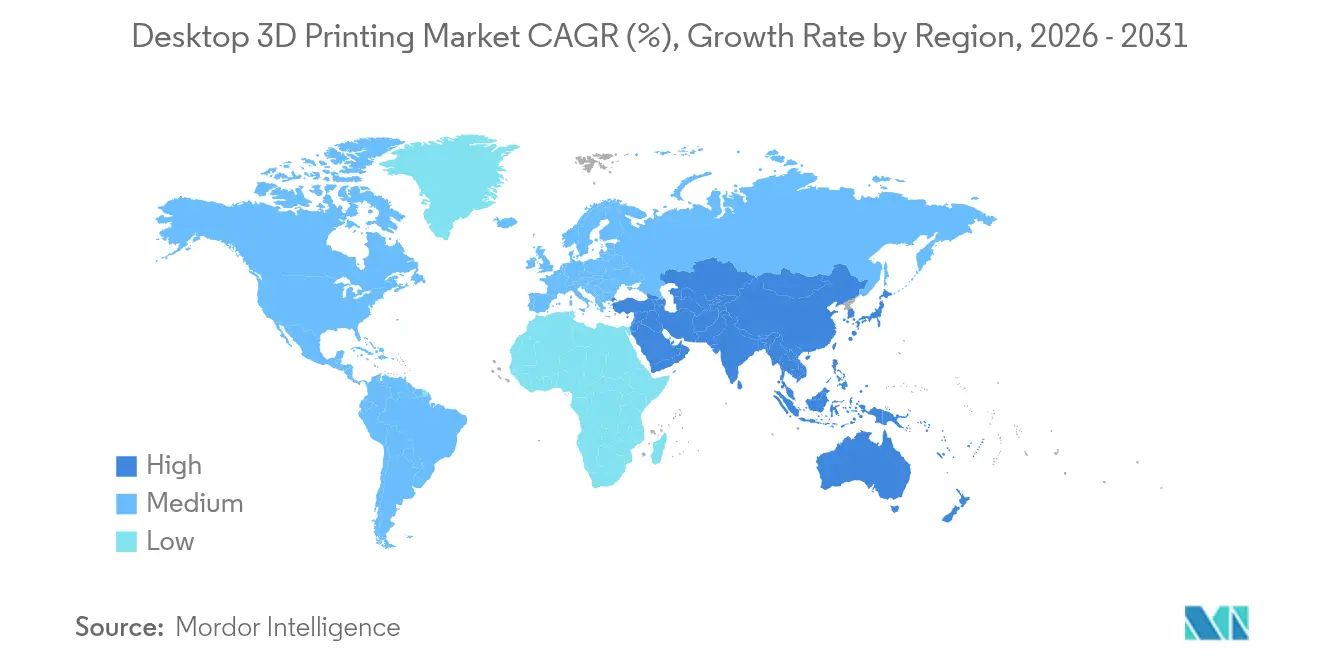
| Fastest Growing Market | Asia Pacific |
| Largest Market | North America |
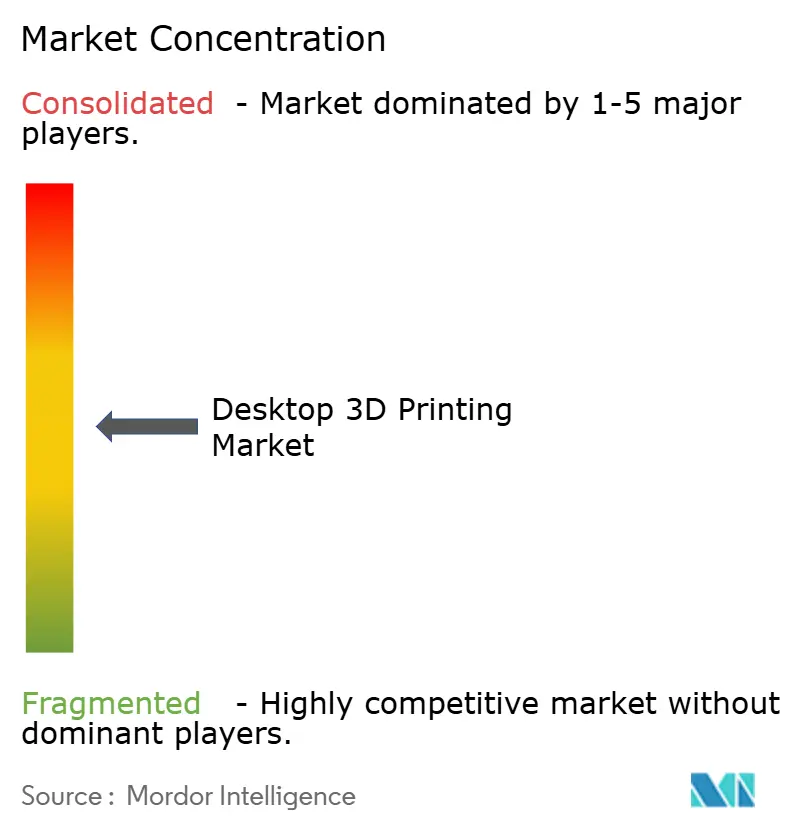
| Market Concentration | Medium |
Major Players *Disclaimer: Major Players sorted in no particular order Image © Mordor Intelligence. Reuse requires attribution under CC BY 4.0. | |
Desktop 3D Printing Market Analysis by Mordor Intelligence
The desktop 3D printing market size is expected to grow from USD 6.7 billion in 2025 to USD 7.51 billion in 2026 and is forecast to reach USD 13.26 billion by 2031 at 12.05% CAGR over 2026-2031. Cost-efficient printers under USD 5,000 already account for more than USD 1 billion in annual revenue, underscoring the technology’s affordability advantage.[1]Germany Trade & Invest, “3D Printing Industry – Additive Manufacturing in Germany,” gtai.de Market momentum rests on open-source firmware, plug-and-play software, and faster print speeds that lift productivity for designers and educators alike. Healthcare applications ranging from dental aligners to surgical models add a high-value revenue stream, while rapid prototyping keeps demand resilient in consumer electronics and automotive hubs. Geographically, North America leads yet Asia–Pacific records the steepest climb, helped by Chinese government funding and local supplier ecosystems.
Key Report Takeaways
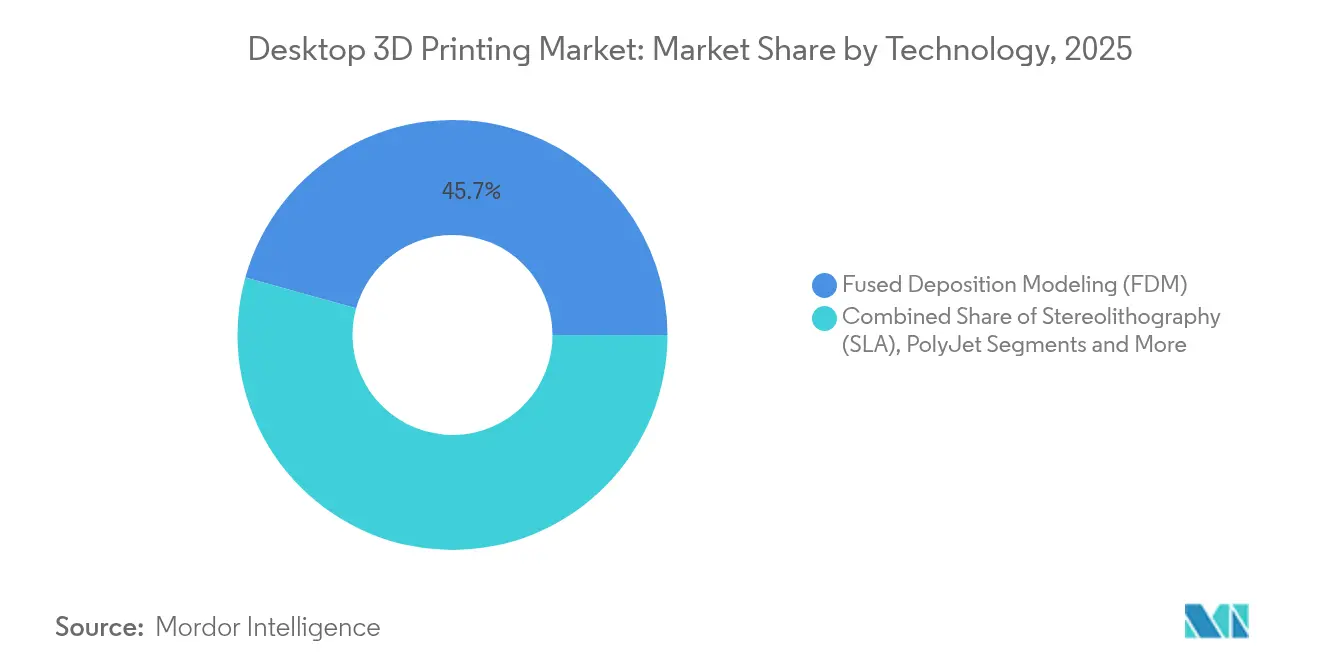
- By technology, FDM held a 45.70% revenue share in 2025, whereas Multi Jet Fusion is forecast to rise at 19.2% CAGR through 2031.
- By application, prototyping led with 39.20% of the desktop 3D printing market share in 2025, while dental implants and aligners are advancing at a 16.98% CAGR to 2031.
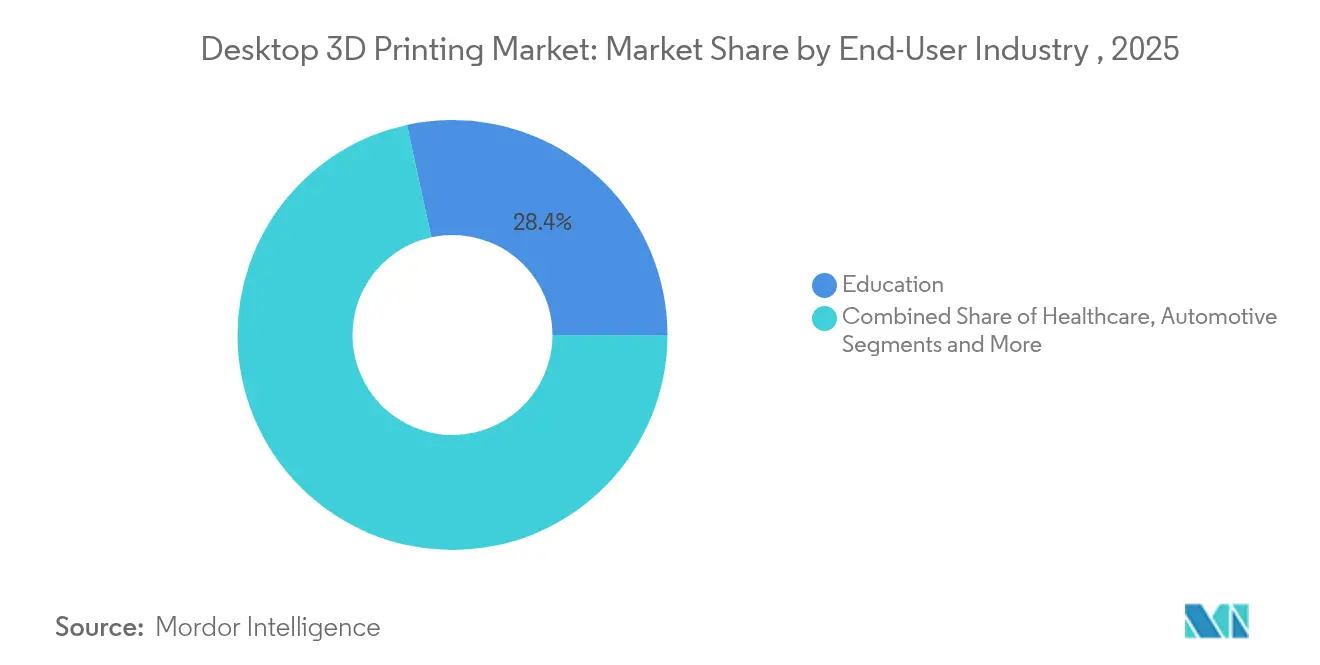
- By end-user, education captured 28.40% share of the desktop 3D printing market size in 2025; healthcare is poised for an 18.24% CAGR between 2026 and 2031.
- By material, thermoplastics accounted for 52.10% of revenue in 2025, but metals are projected to expand at 20.31% CAGR to 2031.
- By region, North America commanded 35.10% of sales in 2025, whereas Asia–Pacific is growing at a 14.31% CAGR, the fastest worldwide.
Note: Market size and forecast figures in this report are generated using Mordor Intelligence’s proprietary estimation framework, updated with the latest available data and insights as of 2026.
Global Desktop 3D Printing Market Trends and Insights
Drivers Impact Analysis*
| Driver | (~) % Impact on CAGR Forecast | Geographic Relevance | Impact Timeline |
|---|---|---|---|
| Continuous cost decline of desktop printers | +2.1% | Global, strongest in APAC and emerging markets | Medium term (2-4 years) |
| Growing adoption in education for STEAM | +1.8% | North America & EU, expanding to APAC | Long term (≥ 4 years) |
| Rapid prototyping demand in agile design | +2.3% | Global, concentrated in automotive and electronics hubs | Short term (≤ 2 years) |
| Advancements in desktop resin and metal tech | +1.9% | North America & EU, with technology transfer to APAC | Medium term (2-4 years) |
| Plug-and-play software ecosystems | +1.4% | Global, with emphasis on SME adoption | Short term (≤ 2 years) |
| Open-source firmware community upgrades | +1.2% | Global, strongest in maker spaces and developing markets | Long term (≥ 4 years) |
| Source: Mordor Intelligence | |||
Continuous Cost Decline of Desktop Printers
Hardware prices keep falling as component sourcing broadens and manufacturing scales. Creality launched a 16-filament machine priced at USD 469 in 2025, a level once reserved for hobbyist single-extruder units. Large-format models such as Elegoo’s 800 × 800 × 1000 mm printer sell for USD 2,900, giving SMEs build volumes once classed as industrial. Bulk PLA sourced from Asian vendors costs USD 5 per kg, an 83% reduction versus branded counterparts, further lowering barriers. Schools respond by purchasing fleets that fit capital-equipment budgets, reinforcing a virtuous cycle of higher volumes and lower prices. German firms invest more than 30% of annual turnover in R&D, maintaining Europe’s leadership in production efficiency
Growing Adoption in Education for STEAM Curricula
Schools embed printers in science and arts labs to translate digital models into physical parts. Qatar Science and Technology Secondary School uses fabrication labs combining 3D printers, CNC machines, and laser cutters for project-based learning. Educators value desktop units over metal lathes given simpler maintenance and the absence of cutting fluids. France’s ‘Industry of the Future’ initiative co-funds equipment purchases, propelling national market value to USD 600 million in 2023. Artistic courses also benefit, as students prototype sculptural forms that traditional machining cannot replicate. Long term, these graduates enter the workforce with hands-on additive skills, sustaining growth in the desktop 3D printing market.
Rapid Prototyping Demand in Agile Product Design
Auto, electronics, and medical device firms shorten design cycles by printing functioning samples overnight. HP’s Jet Fusion 5420W produces production-grade white parts suitable for consumer goods and healthcare models.[2]HP Inc., “HP Jet Fusion 5420W Industrial Printer,” hp.com Daimler Buses cut spare-part lead times by 75% through distributed printer networks. Lattice structures optimized for weight and airflow emerge within hours rather than weeks, letting engineers iterate more freely. Software now auto-generates internal channels once considered impossible to machine. As a result, rapid prototyping is firmly established as a core workflow in the desktop 3D printing market.
Advancements in Desktop Resin and Metal Printing
Plant-based photopolymers now match or exceed oil-derived resins in strength while offering a reduced carbon footprint. Desktop Metal’s TurboFuse binder lets SMEs print stainless steel and titanium parts without a factory-scale furnace. Carbon-fiber-infused PLA delivers aerospace-grade strength for drone components. Bio-composites grown from mycelium present biodegradable alternatives for temporary fixtures. These innovations shift the perception of desktop printers from hobbyist toys to tools capable of end-use production.
Restraints Impact Analysis*
| Restraint | (–) Impact on CAGR | Key Regions Affected | Expected Timeline |
|---|---|---|---|
| Limited material performance for functional parts | -1.6% | Global, most critical in high-performance applications | Medium term (2–4 years) |
| Intellectual-property concerns in distributed printing | -1.3% | Global, strongest in markets with rigorous IP enforcement | Long term (≥ 4 years) |
| Electronics-component supply bottlenecks | -1.1% | Global, with pronounced effects in APAC manufacturing hubs | Short term (≤ 2 years) |
| E-waste regulations targeting polymer waste | -0.9% | EU and North America, with emerging adoption across Asia–Pacific | Medium term (2–4 years) |
| Source: Mordor Intelligence | |||
Limited Material Performance for Functional Parts
Mechanical anisotropy in layer-by-layer builds still limits critical load cases. Thermoplastic polyurethane shows brittle failure in vertical orientations, complicating use in pressure-bearing components. Powder-based metal systems require controlled atmospheres and post-processing, raising costs for SMEs. Surface roughness often needs machining or vapor smoothing to meet tolerance targets. Cross-linking lignin and cellulose helps close performance gaps, yet adoption remains early stage. Until materials consistently meet industrial standards, some manufacturers will stay cautious.
Intellectual-Property Concerns in Distributed Manufacturing
Easy file sharing can sidestep patents when designs circulate through maker forums. Stratasys’s lawsuit against Bambu Lab over coated build plates and auto-leveling highlights tension between incumbents and newcomers. Patent filings for additive processes outpace the tech sector eightfold, signaling an arms race that could slow open innovation. Digital rights systems try to lock files, but blockchain-based exchanges find workarounds. Regulators grapple with defining liability when end-users print replacement parts. Unresolved IP issues may suppress cross-border expansion in the desktop 3D printing market.
*Our forecasts treat driver/restraint impacts as directional, not additive. The impact forecasts reflect baseline growth, mix effects, and variable interactions.
Segment Analysis
By Technology: Multi Jet Fusion Disrupts FDM Dominance
FDM generated 45.70% of 2025 revenue thanks to low printer prices and an abundant filament ecosystem. In the same year, the desktop 3D printing market size for Multi Jet Fusion remained smaller yet is projected to expand at 19.2% CAGR through 2031, narrowing the gap. HP’s architecture reuses 85% of powder, cutting operating costs and easing environmental audits. FDM continues to improve through higher nozzle temperatures and closed-loop sensors that trim print failures. Meanwhile, Stereolithography and DLP keep niche traction in jewelry and dental labs where glossy finishes command premiums. Selective Laser Sintering gains adopters among service bureaus that handle small-batch nylon components. PolyJet thrives in color-critical design studios, while Binder Jetting secures orders for powder-metal parts that do not require high tooling investments.
Emerging entrants bundle Klipper firmware to push FDM speeds past 500 mm/s, reducing print times for prototype casings. Electron Beam Melting remains limited to aerospace titanium parts because of vacuum-chamber costs. Laminated Object Manufacturing appeals to architects needing fast, large maquette production. Over the forecast window, each process aligns with specific material and part requirements rather than chasing general-purpose appeal, reinforcing specialization inside the desktop 3D printing market.


By Application: Dental Revolution Accelerates Beyond Prototyping
Prototyping maintained 39.20% share in 2025, anchoring the desktop 3D printing market. Dental solutions, however, are set for 16.98% CAGR, lifting the desktop 3D printing market size for medical devices in clinics worldwide. Aligners, crowns, and surgical guides ship on the same day a scan is captured, providing chair-side efficiencies and improved patient comfort. Tooling joins the adoption curve as factories insert printed jigs into assembly lines for low-volume launches. Spare-part printing safeguards against supply chain shocks and trims warehouse spend. Educational models depicting anatomy or mechanical assemblies enrich classroom engagement.
Design studios also print end-use art pieces, supporting creative entrepreneurship. Replacement of injection-molded fixtures occurs in motorsports where development cycles cannot wait for tooling. Entertainment firms craft props at previously unthinkable speeds, and architects print building-component molds to test structural fit. The expanding role of functional parts signals a shift from concept validation toward revenue-generating production within the desktop 3D printing market.
By End-User Industry: Healthcare Surge Challenges Education Leadership
Education possessed 28.40% of 2025 revenue because schools and universities integrated printers across STEAM curricula. Healthcare eyes 18.24% CAGR as the fastest riser, widening the desktop 3D printing market share for personalized medicine. Anatomy models improve surgical planning accuracy, while biocompatible resins unlock intraoral guides cleared under updated FDA pathways. Automotive programs remain active, printing lightweight ducts and dashboard prototypes for EV platforms. Electronics brands rely on desktop units to iterate ergonomic housings before high-volume tooling.
Fashion and jewelry craft bespoke forms that reduce stone-setting time. Film studios print intricate costumes impossible with thermoplastics alone. Architecture teams build scaled site models to secure planning approvals. Research labs fabricate custom fixtures on the fly, reserving budget for experimental iterations. Cross-sector versatility gives the desktop 3D printing industry a defensible value proposition against single-function equipment.
By Material Type: Sustainable Innovation Drives Metal Adoption
Thermoplastics kept 52.10% revenue share in 2025 due to PLA’s low learning curve. Desktop metal powders, however, are forecast to post 20.31% CAGR, raising the desktop 3D printing market size for metals as binder-jet and single-pass jetting mature. Engineering polymers like PEEK serve under-hood parts that withstand 200 °C, expanding functional part use. Photopolymer resins capture dental and jewelry jobs demanding high detail. Carbon-fiber-reinforced filaments deliver 3-5× higher stiffness for drone frames. Biobased resins, including wood composites such as Sulapac Flow 1.7, introduce compostable alternatives to ABS and PP.
As printer hot-ends reach 500 °C, ultra-high-temperature polymers become accessible without industrial ovens. Hybrid pellets combine metal and polymer for green-part extrusion before sintering. Mycelium-based filaments appear in eco-friendly packaging. The material roadmap suggests the desktop 3D printing market will split between commodity feedstocks for education and advanced mixes for specialist end-use parts.
Geography Analysis
North America captured 35.10% of global revenue in 2025, benefiting from a mature venture-capital network, an early adopter community, and FDA guidance that clarifies additive medical device pathways. Large original-equipment makers such as Stratasys and 3D Systems anchor regional R&D clusters. Yet steep US tariffs of up to 145% on Chinese printers forced several brands to raise prices by 23–40%, clouding cost-sensitive demand. Canada expands through educational grants, while Mexico leverages USMCA trade rules to import components duty-free. Regulatory updates on general product safety and ecodesign from Europe influence North American manufacturers that sell into EU markets.
Asia–Pacific posts the fastest 14.31% CAGR through 2031, propelled by China’s research subsidies and a vibrant startup scene. Bambu Lab expects CNY 1.5 billion (USD 210 million) in annual sales, signaling local demand and export success. Japan emphasizes precision tooling, and government roadmaps target a domestic market topping JPY 1 trillion by mid-decade. South Korea applies desktop printers to electronics casings, while India’s academic labs incorporate additive modules into engineering degrees. Australia pilots remote-site printing for mining spares, reducing lead times to isolated operations.
Europe enjoys steady growth due to Germany’s patent leadership and robust industrial user base. Firms devote 30.6% of turnover to product development, reinforcing export competitiveness. France’s USD 600 million market emphasises aerospace and healthcare verticals under the ‘Industry of the Future’ umbrella. The United Kingdom funds national Catapult centers focusing on powder-bed fusion process controls. Southern Europe sees uptake in dental labs that bundle printers with intraoral scanners. Emerging regions across South America, the Middle East, and Africa prioritise education pilots and small-batch manufacturing, planting seeds for broader industrial adoption of the desktop 3D printing market.

Competitive Landscape
The competitive field remains moderately fragmented. Top incumbents Stratasys and 3D Systems protect more than 2,600 patents combined, giving them leverage in material and hardware negotiations. Nano Dimension acquired Markforged for USD 115 million, merging composite, metal, and electronics printing portfolios and signalling a push toward platform consolidation. Desktop Metal shareholders approved a merger that strengthens coverage from binder-jet powders to end-to-end software, illustrating scale-driven defensive strategies.
Litigation is rising. Stratasys sued Bambu Lab over ten desktop patents, reflecting incumbent concern about fast-moving Chinese rivals that pair open-source firmware with aggressive price points. Patent filings for additive methods outpace broader tech by eightfold, showing the growing importance of IP portfolios. At the same time, open-source projects such as Klipper democratise performance gains, eroding vendor lock-in for firmware.
Strategic moves increasingly focus on software and materials rather than raw hardware speeds. Prusa’s EasyPrint mobile app lowers onboarding friction by generating G-code in the cloud. HP teams with Arkema to release PA 12 S, an 85%-reusable powder that cuts part cost and improves surface quality for Jet Fusion systems. Photocentric showcases plant-based resins surpassing petroleum peers, hinting at eco-centric differentiation. Collectively, these initiatives reinforce that ecosystem strength, material breadth, and seamless user experience define competitive advantage in the desktop 3D printing market.
Desktop 3D Printing Industry Leaders
Stratasys
3D Systems, Inc.
EOS GmbH
ELEGOO
Markforged
- *Disclaimer: Major Players sorted in no particular order

Recent Industry Developments
- May 2025: Prusa Research launched EasyPrint mobile app to enable cloud-based G-code generation
- April 2025: Nano Dimension finalized its USD 115 million acquisition of Markforged
- March 2025: Bambu Lab unveiled H2D printer with independent dual-extruder system priced at USD 1,899
- January 2025: American Axle & Manufacturing acquired GKN Powder Metallurgy and GKN Automotive for USD 1.44 billion


Research Methodology Framework and Report Scope
Market Definitions and Key Coverage
Our study treats the desktop 3-D printing market as revenue generated from the sale of ready-to-use additive-manufacturing printers with build volumes typically below 30 × 30 × 30 cm, together with the embedded controller software delivered in the box. It tracks units sold through direct and channel routes to hobbyists, educators, design studios, dentists, and small workshops worldwide.
Scope exclusion: Large-format industrial printers, standalone consumables, and printing services are analyzed in separate Mordor Intelligence titles.
Segmentation Overview
- By Technology
- Stereolithography (SLA)
- Digital Light Processing (DLP)
- Fused Deposition Modeling (FDM)
- Selective Laser Sintering (SLS)
- Multi Jet Fusion (MJF)
- Direct Metal Laser Sintering (DMLS)
- Electron Beam Melting (EBM)
- PolyJet
- Binder Jetting
- Laminated Object Manufacturing (LOM)
- By Application
- Prototyping
- Tooling
- Replacement Parts
- Educational Models
- Artistic and Hobbyist Objects
- Dental Implants and Aligners
- By End-User Industry
- Education
- Healthcare
- Automotive
- Consumer Electronics
- Fashion and Jewellery
- Entertainment and Media
- Architecture and Construction
- RandD Laboratories
- By Material Type
- Photopolymer Resins
- Thermoplastics (PLA, ABS, PETG)
- Engineering-grade Polymers (Nylon, PEEK, PEI)
- Metals and Metal Powders
- Composites and Fiber-reinforced Filaments
- Bio-based and Sustainable Materials
- By Geography
- North America
- United States
- Canada
- Mexico
- South America
- Brazil
- Argentina
- Rest of South America
- Europe
- Germany
- United Kingdom
- France
- Italy
- Spain
- Russia
- Rest of Europe
- Asia-Pacific
- China
- Japan
- South Korea
- India
- Australia and New Zealand
- Rest of Asia-Pacific
- Middle East
- United Arab Emirates
- Saudi Arabia
- Turkey
- Rest of Middle East
- Africa
- South Africa
- Nigeria
- Egypt
- Rest of Africa
- North America
Detailed Research Methodology and Data Validation
Primary Research
Mordor analysts interview printer OEM engineers, filament suppliers, STEAM program directors in the United States, Germany, and China, plus dental-lab owners across India and Brazil. These conversations clarify average duty cycles, replacement rates, and likely curriculum adoption windows, letting us tighten assumptions drawn from desk work.
Desk Research
We screen high-credibility public sources, such as US Census Harmonized System export codes for desktop FDM machines, Eurostat PRODCOM data on 'Other office machines,' China Customs HS 8477 shipment trends, ASTM F42 committee minutes on desktop safety standards, and OECD R&D intensity tables, to size demand drivers and price shifts. Corporate 10-Ks, SEC filings, Kickstarter campaign disclosures, and patent filings retrieved via Questel add device counts and ASP benchmarks. D&B Hoovers aids in validating top vendor revenues, while Dow Jones Factiva tracks quarterly channel inventory signals. The sources listed are illustrative; many additional datasets are consulted while building and checking the model.
Market-Sizing & Forecasting
We start with a top-down construct, reconciling reported desktop printer import-export volumes and household education spending to derive a global demand pool, which is then stress-tested through sampled bottom-up roll-ups of leading vendors' hardware shipments and median ASPs. Key variables like average printer ASP decline, annual unit penetration per secondary school, desktop metal adoption rate, resin price trajectory, and regional maker-space density drive the model. Multivariate regression and scenario analysis project their influence through 2030; gaps in supplier data are bridged using channel checks and normalized ASP curves.
Data Validation & Update Cycle
Outputs pass a three-layer review: automated variance flags, peer analyst cross-checks, and a senior sign-off. Models refresh annually, with interim updates if tariff shifts, component shortages, or material breakthroughs alter baseline trends. Before publication, an analyst reruns the latest quarter's data.
Why Mordor's Desktop 3d Printing Baseline Commands Reliability
Published estimates often diverge because firms pick different mixes of goods, price bases, and refresh cadences.
Key gap drivers include whether software and services are bundled, how hobbyist kits are classified, and the currency-conversion date applied. Mordor reports only fully assembled sub-$10 k printers, uses current-year average exchange rates, and is refreshed every twelve months, giving decision-makers a stable yet timely anchor.
Benchmark comparison
| Market Size | Anonymized source | Primary gap driver |
|---|---|---|
| USD 6.70 B | Mordor Intelligence | - |
| USD 7.21 B | Global Consultancy A | Bundles aftermarket materials and spare parts with printer revenue |
| USD 4.86 B | Trade Journal B | Excludes education sales; counts hardware shipments only |
| USD 12.29 B | Industry Analytics C | Adds entry-level industrial units; applies aggressive 21% ASP drop |
These comparisons show that when scope creep is removed and assumptions are cross-validated with field insights, Mordor's balanced baseline stands as the dependable reference for planners.


Key Questions Answered in the Report
What is the current valuation of the desktop 3D printing market?
The market reached USD 7.51 billion in 2026 and is projected to grow to USD 13.26 billion by 2031 at a 12.05% CAGR.
Which region leads the desktop 3D printing market?
North America holds 35.10% of global revenue, although Asia–Pacific is expanding faster with a 14.31% CAGR through 2031.
Who are the key players in Desktop 3D Printing Market?
Stratasys, 3D Systems, Inc., EOS GmbH, ELEGOO and Markforged are the major companies operating in the Desktop 3D Printing Market.
Which application segment is growing the fastest?
Dental implants and aligners are advancing at a 16.98% CAGR as digital dentistry digitizes orthodontic workflows.
What technology dominates the desktop 3D printing market today?
FDM captured 45.70% of 2025 revenue due to low-cost hardware and broad material availability.
How are material trends shifting in desktop 3D printing?
Metals and metal powders are forecast to post a 20.31% CAGR, while sustainable plant-based resins now deliver mechanical properties that rival petroleum-based alternatives.
What are key restraints that could slow market growth?
Material performance limitations for demanding functional parts and unresolved intellectual-property disputes may temper adoption over the medium term.
Page last updated on:


