
Diesel As Fuel Market Size and Share
Diesel As Fuel Market Analysis by Mordor Intelligence
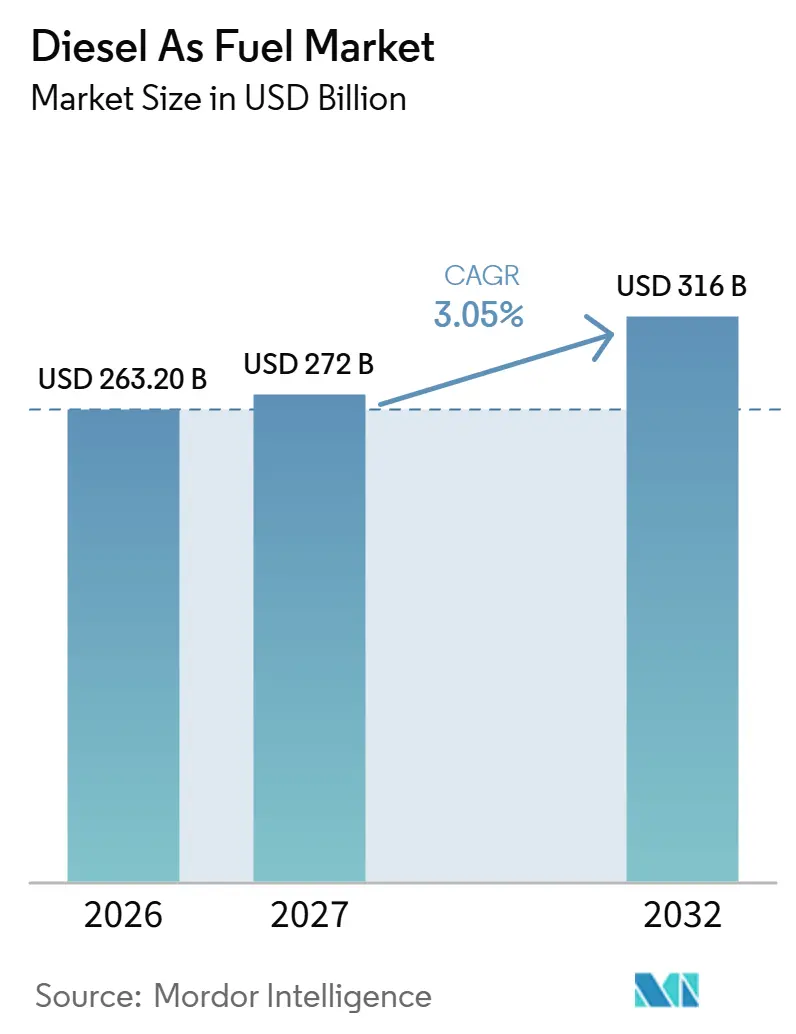
The diesel as fuel market size is estimated at USD 263.2 billion in 2026 and is projected to be USD 272 billion in 2027, reaching USD 316 billion by 2032, growing at a CAGR of 3.05% from 2027 to 2032.
India's diesel-heavy bus base and data-center backup needs support fuel sales, while sulfur requirements direct spending toward compliant grades. Refinery upgrading and renewable-diesel production give suppliers different ways to address fuel-quality and supply requirements. City-bus electrification limits diesel demand from bus operations, while carbon-related fuel taxes, as in Lithuania, constrain road-diesel volumes. The US-Iran conflict beginning in February 2026 disrupted Persian Gulf oil supply through a Strait of Hormuz closure, raising diesel prices across five major EU markets and weighing on consumption.
Key Report Takeaways
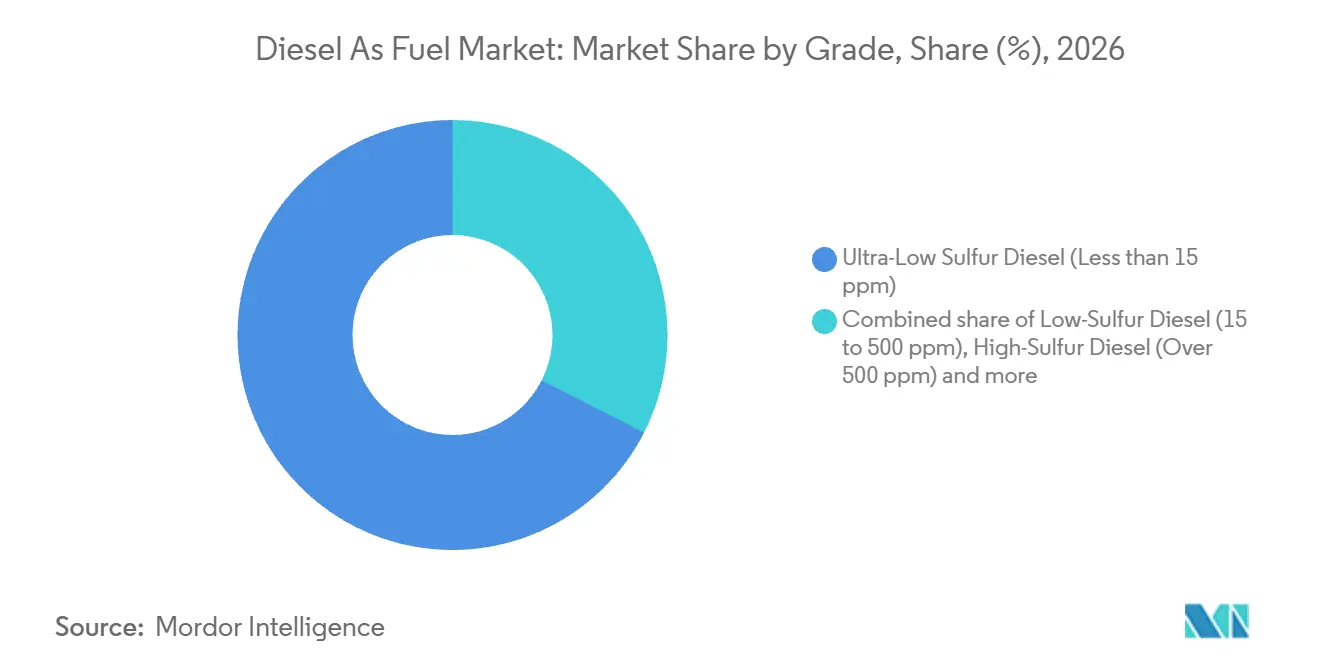
- By grade, ultra-low sulfur diesel held a 67.5% share of the diesel as fuel market size in 2026, while biodiesel blends from B5 to B20 are forecast to grow fastest at a CAGR of 7.2% from 2027 to 2032.
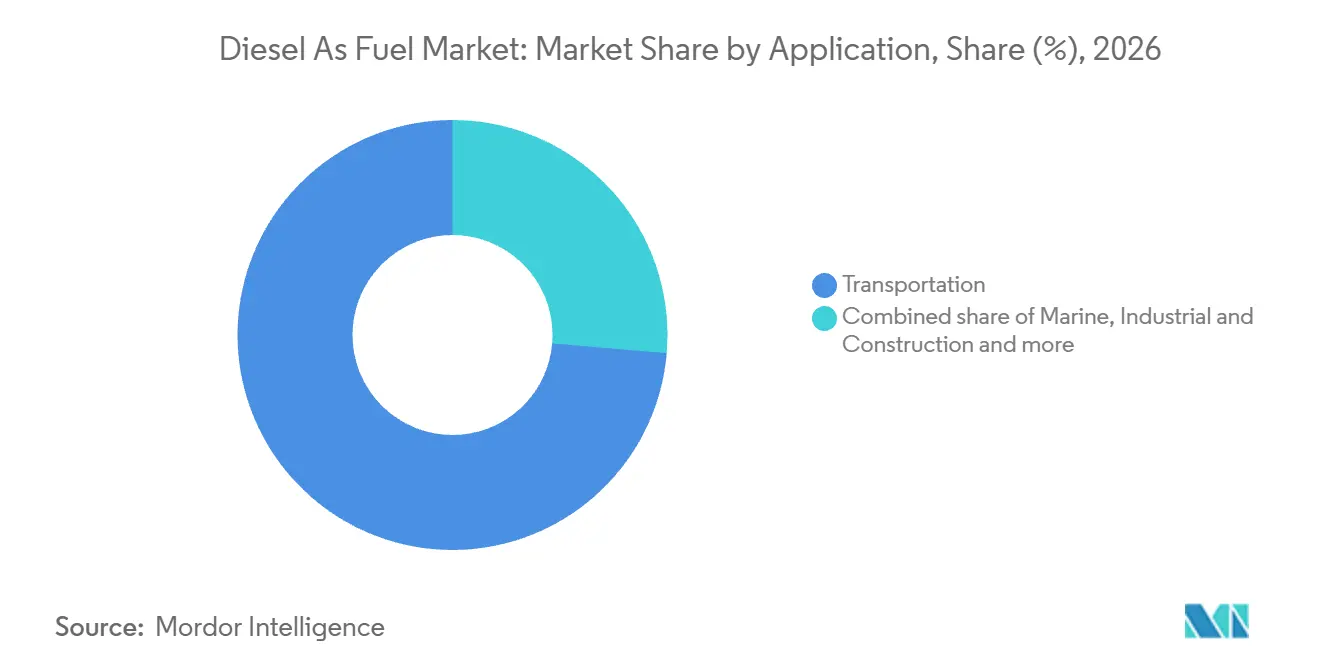
- Transportation led applications with a 73.65% diesel as fuel market share in 2026, and marine is projected to be the fastest-growing segment with a CAGR of 5% from 2027 to 2032.
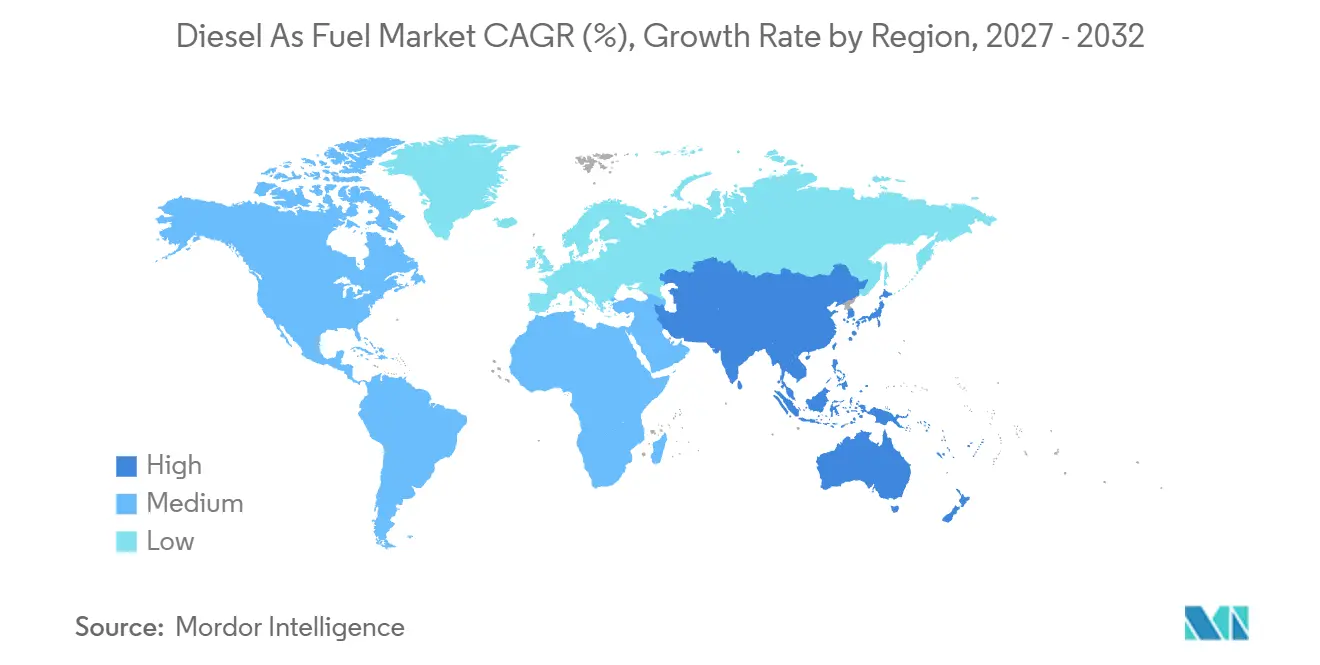
- Across geographies, Asia-Pacific led with a 42.58% share of global diesel fuel spending in 2026 and is forecast to grow fastest at a CAGR of 3.8% from 2027 to 2032.
Note: Market numbers in this report are based on Mordor Intelligence's proprietary estimation framework, which combines nine months of actuals with Q4 projections for base year 2026.
Market Trends and Insights
Drivers Impact Analysis of Diesel As Fuel Market*
| Driver | (~) % Impact on CAGR Forecast | Geographic Relevance | Impact Timeline |
|---|---|---|---|
| Rapid truck & bus fleet growth in emerging Asia | +1.8% | India | Medium term (2-4 years) |
| Surging demand for backup power in data-center buildouts | +0.9% | United States | Short term (≤ 2 years) |
| Post-pandemic rebound in global marine freight ton-miles | +0.8% | Panama Canal shipping corridor | Short term (≤ 2 years) |
| Government-mandated ultra-low-sulfur diesel (ULSD) adoption | +0.7% | India and European Union countries | Medium term (2-4 years) |
| Rise of synthetic e-diesel pilots in Europe | +0.15% | Germany | Long term (≥ 4 years) |
| Mining sector's shift from coal to high-cetane diesel blends | +0.2% | Utah | Medium term (2-4 years) |
| Source: Mordor Intelligence | |||
Rapid truck & bus fleet growth in emerging Asia
India's diesel-bus base gives fuel suppliers substantial demand exposure alongside the opportunity from additional commercial vehicles. As of March 2025, India had 2,086,103 diesel buses among 2,464,287 registered buses, an 84.65% share of its registered bus fleet. The Society of Indian Automobile Manufacturers (SIAM) reported domestic commercial-vehicle sales of 1.03 million units in 2025, up 7.7% from 2024. For diesel suppliers, bus operators represent a defined customer population, while additional diesel-powered vehicles can create further recurring consumption when operated. The demand mechanism is vehicle use, making access to working bus and truck fleets commercially more consequential than exposure to vehicle sales alone.
Surging demand for backup power in data-center buildouts
Data-center expansion creates a fuel opportunity through backup capability rather than electricity consumption alone. Rolls-Royce reported growing demand for data-center backup-power solutions in 2025, driven by cloud computing, data processing, and AI. Oregon's Department of Environmental Quality described existing data centers as using diesel-powered backup engines, while the 2025 facility pipeline included more than 40 permitted or proposed centers. For diesel-powered installations, additional backup capacity enlarges the equipment base that can require fuel during an electrical outage. Fuel suppliers consequently gain exposure to continuity requirements, but the commercial value depends on diesel adoption and operating hours rather than the full electricity load of each new facility.
Post-pandemic rebound in global marine freight ton-miles
Clarksons Research reported that global seaborne trade metric ton-miles grew 1.7% in 2025.[1] Panama Canal low-sulfur marine gasoil sales reached 521,847 metric tons in 2025, about 109,000 metric tons above 2024 and the highest reported annual level. The Canal also reported 7,466 ships bunkered in 2025, 770 more than in 2024. More vessels buying fuel can broaden the customer flow at a bunkering location even when fuel demand per vessel varies. For suppliers, freight expansion becomes commercially valuable when additional voyage activity creates refueling purchases, connecting transport work to an identifiable fuel-sales channel.
Government-mandated ultra-low-sulfur diesel (ULSD) adoption
Sulfur requirements support demand for compliant diesel by restricting the grades that can serve regulated users. India mandated nationwide BS-VI vehicle standards from April 1, 2020, with BS-VI fuel containing 10 ppm sulfur. EU Member States must limit sulfur in gas oils for non-road machinery, including inland waterway vessels, agricultural and forestry tractors, and recreational craft, to 10 mg/kg. These requirements favor suppliers able to deliver the specified low-sulfur fuel across the affected applications, without requiring an increase in transport activity. The commercial gain comes from directing fuel expenditure toward compliant grades, making product quality a condition of serving these buyers rather than a discretionary distinction.
Restraints Impact Analysis of Diesel As Fuel Market*
| Restraint | (~) % Impact on CAGR Forecast | Geographic Relevance | Impact Timeline |
|---|---|---|---|
| Rapid electrification of city bus fleets | -0.7% | Canada | Medium term (2-4 years) |
| Stringent carbon-pricing schemes in OECD economies | -0.45% | Lithuania | Short term (≤ 2 years) |
| AI-optimized route planning cutting long-haul diesel usage | -0.2% | SF Holding's land-transport network | Medium term (2-4 years) |
| Growing investor divestment from fossil-fuel refining | -0.15% | United States | Long term (≥ 4 years) |
| Source: Mordor Intelligence | |||
Rapid electrification of city bus fleets
City-bus electrification constrains diesel demand by transferring passenger service to vehicles that do not require diesel propulsion. Toronto Transit Commission reported in April 2026 that 337 of 340 battery-electric buses had been delivered, with 259 in service. The operating vehicles establish a commercial alternative, while the difference between delivery and service shows why procurement totals alone overstate its immediate reach. For fuel suppliers, the relevant exposure is the bus activity actually electrified, rather than the full announced purchase. Additional transit service can therefore expand without creating a corresponding diesel requirement, limiting the fuel sales available from this customer category.
Stringent carbon-pricing schemes in OECD economies
Carbon-related taxation raises the cost of diesel use even when an operator's underlying transport requirement is unchanged. Lithuania added a CO2 component to diesel excise in 2025, creating an additional carbon-related tax cost. ORLEN reported that Lithuanian diesel oil consumption fell around 13% in 2025, mainly because a January excise increase raised end-user prices and prompted consumers to seek lower-cost alternatives.[2] That response to the wider excise increase illustrates how tax-driven price differences can redirect purchases, alongside the carbon component's own cost burden. Suppliers exposed to such jurisdictions face pressure on fuel volumes when buyers can reduce diesel use or obtain less costly alternatives.
*Our forecasts treat driver/restraint impacts as directional, not additive. The impact forecasts reflect baseline growth, mix effects, and variable interactions.
Diesel As Fuel Market Segment Analysis
By Grade:
Compliant Refining Capacity and Blend Mandates Shape DemandUltra-low sulfur diesel accounted for a 67.5% share of the diesel as fuel market size in 2026, making it the largest segment. In May 2025, Petrobras began operating a new diesel hydrotreating unit at REPLAN, increasing the refinery's ULSD production capacity by up to 63,000 barrels per day. This expansion illustrates how investment in a specific treatment capability supports the availability of the leading grade.
Biodiesel blends (B5 to B20) are forecast to be the fastest-growing segment, with a CAGR of 7.2% from 2027 to 2032. Brazil raised its mandatory biodiesel blend in diesel from 14% to 15% in August 2025.[3] The higher mandatory share requires more biodiesel in each liter of the regulated diesel blend, tying component demand to Brazil's diesel pool. Synthetic diesel has a distinct cross-border supply base, with EU hydrotreated vegetable oil imports totaling about 1.76 million metric tons in 2025. High-sulfur diesel is forecast to contract, and the US 15 ppm sulfur limit, subject to exceptions in 40 CFR 1090.300(a), narrows its eligible outlets.

By Application:
Transport Consumption Anchors Scale as Marine Demand ExpandsTransportation represented a 73.65% diesel as fuel market share in 2026, making it the largest segment. In 2025, US transportation-sector distillate fuel consumption, excluding biodiesel and renewable diesel, averaged about 2.94 million barrels per day. That volume accounted for about 75% of total US distillate consumption in 2025.
Marine is forecast to be the fastest-growing segment, with a CAGR of 5% from 2027 to 2032. International-voyage ships of 5,000 gross tonnage and above covered by the IMO Data Collection System reported 13.3% higher combined diesel and gas oil use in 2025 than in 2024. The reporting data also showed lower light fuel oil use in 2025. Preliminary Panama Maritime Authority data recorded 53,354 metric tons of marine gas oil barge sales in January to June 2026, 33.01% above January to June 2025. Serving vessels' distillate requirements can therefore create a fuel-sales opportunity even when another reported bunker-fuel category weakens.
Geography Analysis
Asia-Pacific Diesel As Fuel Market
Asia-Pacific held a 42.58% diesel as fuel market share in 2026 and is forecast to be the fastest-growing geography, with a CAGR of 3.8% from 2027 to 2032. India's provisional high-speed diesel consumption growth was +5.6% in September 2026 versus September 2025, according to the Petroleum Planning & Analysis Cell (PPAC). PPAC linked India's provisional June 2026 diesel consumption growth to agriculture and infrastructure activity, including diesel-powered equipment and road freight. Elsewhere in Asia-Pacific, Oil Companies Advisory Council member-company high-speed diesel sales to Pakistan's road transport totaled 938,264 metric tons from July 2025 to June 2026. PPAC's June attribution names agriculture, mining, highway construction, railway projects and urban development, so India's growth rests on equipment-heavy sectors, whereas the Pakistan figure measures road transport only.
Europe is forecast to contract, and EU road-diesel deliveries were 3.4% lower in January to June 2026 than in January to June 2025. The US-Iran military conflict began on February 28, 2026, and the resulting Strait of Hormuz closure disrupted Persian Gulf oil access. Kpler identified elevated diesel prices and a strong prior-year comparison as contributors to second-quarter 2026 demand weakness. The commercial pressure combines reduced road-fuel volumes with affordability constraints, leaving suppliers exposed to fewer physical sales even when higher prices raise buyers' fuel bills.
In North America, US distillate exports to Mexico, chiefly diesel, averaged about 220,000 barrels per day in 2025. In South America, Brazil's energy research agency projected national diesel demand at 72.4 billion liters in 2026, citing positive grain-harvest projections among its supporting indicators. In South Africa, Eskom reported 152.41 gigawatt-hours of diesel-fired open-cycle gas turbine generation from April 1 to October 15, 2026, about 85.05% below the corresponding 2025 period. These examples distinguish cross-border fuel supply, crop-linked transport requirements, and the Middle East and Africa's exposure to utility operating needs. Reduced operation of diesel-fired turbines weakens this grid-support sales channel, even as grain-harvest expectations support Brazil's broader diesel outlook.
Regulatory Framework and Outlook
This comparison examines selected jurisdictions' fuel-quality duties from the perspective of a conventional diesel supplier that manufactures or blends fuel. The US framework imposes manufacturer batch-record duties, while Brazil's blending rules require recurring product-quality testing. Both sets of duties fall on the party that manufactures or blends the fuel, which is the perspective used for the ratings below.
Regulatory Table of Diesel As Fuel Market
| Decision factor | United States | Brazil |
|---|---|---|
| Primary authority | Environmental Protection Agency (EPA) | National Agency of Petroleum, Natural Gas and Biofuels (ANP) |
| Key instruments or direction | 40 CFR 1090.1215 | Resolution 968/2024, Article 14 |
| Commercial effect | Manufacturers retain facility and covered fuel-batch records, including volume, number, date, and designation | Authorized blenders sample diesel B and test oxidation stability at least monthly |
| Current policy attractiveness | Medium | Medium |
| Future direction of policy attractiveness | No change | No change |
| Source: Mordor Intelligence | ||
The US Medium rating reflects batch-record duties, while EPA's April 2026 Part 1090 clarifications for biodiesel and renewable diesel support No change by clarifying application of existing requirements. Brazil's Medium rating weighs monthly oxidation-stability testing and the mandatory 15% blend against a statutory path to 20% on March 1, 2030, subject to CNPE feasibility review and rate setting. The No change direction reflects continuity in quality-control duties for suppliers, while higher mandatory blends require technical-feasibility assessment before implementation. ANP's September 2025 decision to monitor S-500 and S-1800 substitution with S10 without a mandatory phase-out schedule also limits forced product-withdrawal exposure.
Value Chain Stages
Refining, bulk transportation, and terminal handling create different sources of supplier earnings in diesel supply. Exxon Mobil reported worldwide refinery throughput of 3.98 million barrels per day and combined heating-oil, kerosene, and diesel sales of 1.79 million barrels per day in 2025. The manufacturing and sales roles connect processing capacity to commercial outlets, while logistics operators earn from moving and handling products between them. Competitive strength therefore depends on matching the fuel available at a refinery with the routes and handling capacity needed to reach consuming locations.
Value Chain Analysis Table of Diesel As Fuel Market
| Primary activity | Key participants | Value capture | Bottleneck | Resilience response |
|---|---|---|---|---|
| Refining | Integrated refiners such as Exxon Mobil | Refined-product sales | Dependence on suitable processing capacity | Maintain access to alternative qualified refinery supply |
| Bulk transportation | Refined-product pipeline operators such as Kinder Morgan | Transportation service revenue | Dependence on connected transport routes | Arrange barge or rail alternatives where available |
| Terminal storage and blending | Fuel terminal operators such as Kinder Morgan | Storage and blending service revenue | Mismatch between receipts, storage availability, and dispatch | Coordinate tank allocation with incoming flows and truck dispatch |
| Source: Mordor Intelligence | ||||
In the United States, diesel moves from refineries and ports to terminals by pipeline, barge, or train, then by truck to retail stations and large-volume consumers. Alternative transport modes can reduce dependence on a single route, although terminal access still determines where those alternatives connect with final delivery. Changes in blend composition can also increase the importance of terminal handling, giving logistics providers a service opportunity distinct from the refiner's product sales.
Competitive Landscape
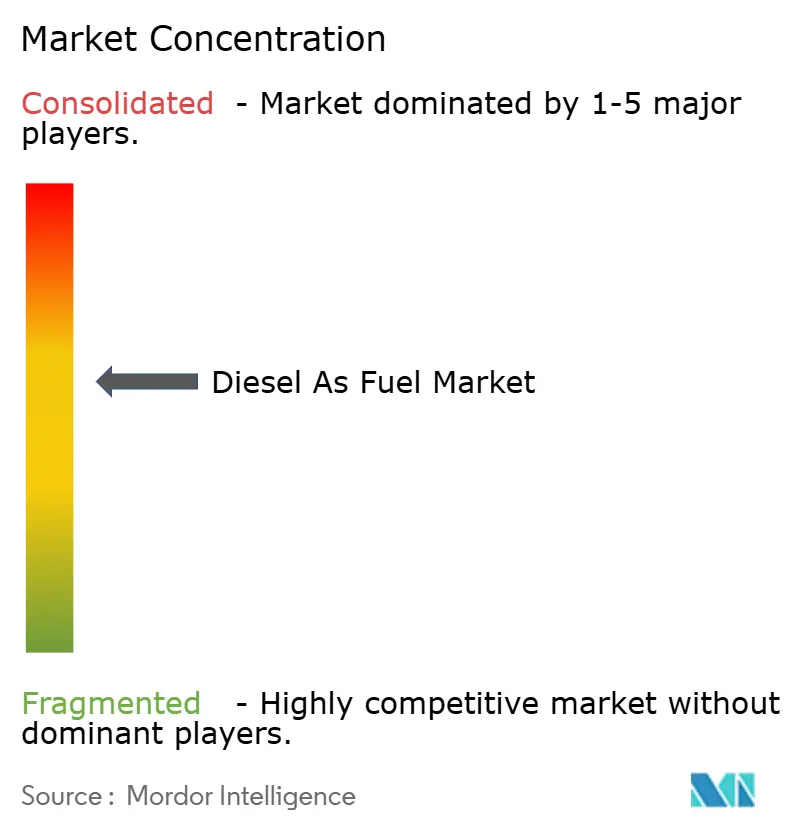
Competition is moderately concentrated around established fuel suppliers, with manufacturing scale and national supply positions shaping access to buyers. Major participants include Chevron, Exxon Mobil, Shell, BP, and Saudi Aramco. Chevron's consolidated refineries and bio-refineries produced 271,000 barrels per day of diesel/gas oil worldwide in 2025, including renewable diesel and biodiesel in that product category. The 2025 total was up from 250,000 barrels per day in 2024.
Conventional diesel strategies can improve the product mix available from existing refining operations. Exxon Mobil started up the Fawley Hydrofiner in the United Kingdom in 2025 to increase ultra-low-sulfur diesel production and reduce other products, including high-sulfur distillates. The unit converts lower-value distillates into higher-value diesel for the UK market. For diesel buyers, that can expand relevant supply without requiring a parallel increase in every product manufactured at the site. Challengers need processing capabilities that produce the required diesel quality, making control over the saleable product mix a source of competitive advantage.
Renewable diesel creates another competitive route through the inputs and technologies used to manufacture fuel. Exxon Mobil started up the Strathcona Renewable Diesel project in Alberta in 2025, designed to use low-carbon hydrogen, locally sourced and grown feedstocks, and its proprietary catalyst. That design links the fuel offering to a coordinated input chain, adding execution requirements beyond bringing a refinery project into operation. Chevron's renewable diesel and biodiesel output within its diesel and gas oil total fell from 25,000 barrels per day in 2024 to 21,000 in 2025. Because that renewable component fell while Chevron's overall diesel and gas oil total rose, the 2025 increase came from conventional diesel and gas oil.
Diesel As Fuel Industry Leaders
-
Chevron
-
Exxon Mobil
-
Shell
-
BP
-
Saudi Aramco
- *Disclaimer: Major Players sorted in no particular order
Diesel As Fuel Market Companies Covered in this Report
- Exxon Mobil
- Chevron
- Shell
- BP
- TotalEnergies
- Saudi Aramco
- Sinopec
- PetroChina
- Rosneft
- Lukoil
- ENI
- Petrobras
- Kuwait Petroleum
- QatarEnergy
- Indian Oil Corp
- Bharat Petroleum
- Reliance Industries
- Valero Energy
- Marathon Petroleum
- SK Energy
Key Opportunities for Market Participants
This comparison focuses on Brazilian opportunities for B16-to-B20 finished diesel blends, distinguishing voluntary fleet supply from later mandatory blend steps. Brazil's National Agency of Petroleum, Natural Gas and Biofuels (ANP) permits listed eligible users to obtain higher-blend finished diesel from authorized fuel distributors under its notification pathway. Other higher-blend uses require prior authorization and the applicable regulatory conditions.
Market Opportunities Table of Diesel As Fuel Market
| Opportunity | Why now | Buyer / lead segment | Recommended play | Main barrier | Likely beneficiaries |
|---|---|---|---|---|---|
| B16 railway fuel supply | Rumo notified ANP of B16 use on August 3, 2026 | Eligible captive railway fleets | Offer B16 with operator-specific performance assurance through authorized distributors | Demonstrating performance for the intended railway duty | Authorized fuel distributors; Be8 as a biodiesel producer |
| B16-B20 captive road-fleet supply | Notification pathway for listed eligible users in 2026 | Eligible listed captive road fleets | Offer finished blends within B16-B20 through authorized distributors | Coordinating regional feedstock supply and delivery | Authorized fuel distributors; Be8 as a biodiesel producer |
| Phased mandatory B17-B20 supply | Law schedules 20% on March 1, 2030, subject to National Energy Policy Council (CNPE) feasibility review and rate setting | Distributors supplying mandatory-blend users | Stage blending and fuel-supply commitments against confirmed CNPE rates | Technical-feasibility assessment before mandatory increases above B15 | Authorized fuel distributors; Be8 as a biodiesel producer |
| Source: Mordor Intelligence | |||||
Brazil's Ministry of Mines and Energy reports motor and vehicle test approval through B15, with technical-feasibility assessment required for higher mandatory blends. The central opening is operator-specific finished-blend supply through authorized distributors, using performance assurance to turn a qualified legal route into a saleable fuel offering. Distributors can pursue notified B16 railway users such as Rumo before committing to nationwide mandatory increases, which require technical assessment and CNPE rate setting.
Recent Industry Developments in Diesel As Fuel Market
- Aug 2026: Rumo S.A. notified Brazil's ANP on August 3, 2026, of B16 use in its captive railway fleet.
- Jul 2026: Brazil's CNPE approved a resolution limiting biodiesel for the mandatory diesel blend to output from ANP-authorized producers. Imported biodiesel remained permitted for other segments under the applicable rules.
- Apr 2026: EPA finalized clarifications to federal diesel-fuel rules for biodiesel and renewable diesel. The final rule took effect June 15, 2026, with separate effective dates for 2 amendatory instructions.
Diesel As Fuel Market Report Scope and Research Methodology
Market Definition and Coverage
The diesel as fuel market measures annual spending on diesel fuels consumed worldwide. It covers petroleum diesel, biodiesel blends, renewable diesel and synthetic diesel used in transportation, marine, industrial and construction, agriculture, and power generation.
Scope exclusions: Non-fuel uses of middle distillates, including chemical feedstock use, crude oil and refinery feedstocks sold before diesel production, and diesel engines, vehicles, vessels, generators and other equipment are excluded.
Segments Covered in This Report
- By Grade
- Ultra-Low Sulfur Diesel (Less than 15 ppm)
- Low-Sulfur Diesel (15 to 500 ppm)
- High-Sulfur Diesel (Over 500 ppm)
- Biodiesel Blends (B5 to B20)
- Synthetic Diesel
- By Application
- Transportation
- Marine
- Industrial and Construction
- Agriculture
- Power Generation
- By Geography
- North America
- United States
- Canada
- Mexico
- Europe
- Germany
- United Kingdom
- France
- Italy
- NORDIC Countries
- Russia
- Rest of Europe
- Asia-Pacific
- China
- India
- Japan
- South Korea
- ASEAN Countries
- Australia and New Zealand
- Rest of Asia-Pacific
- South America
- Brazil
- Argentina
- Colombia
- Rest of South America
- Middle East and Africa
- Saudi Arabia
- United Arab Emirates
- South Africa
- Egypt
- Rest of Middle East and Africa
- North America
Data Sources, Market Sizing, and Validation
Desk Research
Public evidence such as the U.S. Energy Information Administration's diesel-use and distillate-demand analyses, India's Petroleum Planning & Analysis Cell fuel-quality guidance, and the Society of Indian Automobile Manufacturers' annual reports helps frame end-use patterns, grade standards, vehicle activity and regional demand. These sources provide independent activity and policy indicators that can be compared with the spending measure, while keeping physical consumption and market revenue distinct.
Company filings, investor materials, government statistics and reputable energy and transport reporting can supplement the public indicators by clarifying fuel sales, refining capacity, blend availability and demand changes. These sources are not exhaustive, and further sources inform collection, validation and clarification.
Primary Interviews and Surveys
Structured discussions with fuel suppliers, refiners, distributors, fleet and vessel operators, agricultural users, industrial buyers and power generators can test how reported activity translates into diesel purchases and end-user spending. Analysts can use those perspectives to check secondary-source assumptions, clarify grade and application coverage, and investigate gaps by comparing reported value with physical-volume and price evidence across regions.
Distribution of primary research fieldwork respondents
| Company type | Respondent position | Region |
|---|---|---|
| Top tier: 30% | CXOs: 20% | APAC: 40% |
| Mid tier: 45% | Functional/Unit leaders: 35% | EMEA: 30% |
| Smaller Players: 25% | Managers: 45% | Americas: 30% |
Market-Sizing & Forecasting
The model estimates global end-user spending from a top-down view of diesel fuel consumption and prices, then checks selected totals with supplier roll-ups and sampled price-times-volume estimates. Demand indicators include commercial vehicle and freight activity, marine fuel use, agricultural and construction equipment activity, and diesel generator use. Fuel-grade standards and blend mandates help explain the mix of petroleum diesel, biodiesel blends, renewable diesel and synthetic diesel. Regional and application shares are built from these activity indicators, published fuel-use data and supplier or buyer evidence, with unit prices used to translate volumes into spending. A multivariate regression can relate historical spending to the principal activity and price indicators, with scenario analysis for policy, fuel-mix and price changes. Where a volume or price series is missing, analysts can use the closest public proxy and test its effect through a bounded scenario. Specialists can review whether each variable's forecast fits observed operating conditions and reported plans, and the selective bottom-up checks can be reconciled to the global total, with unexplained differences investigated before estimates are carried forward.
Data Validation & Update Cycle
Analysts triangulate market estimates against independent fuel-use statistics, supplier disclosures, trade flows, prices and end-user activity, then review anomalies and material variances across years, regions and segments before sign-off. A discrepancy triggers a source review and, where an assumption or reported activity needs clarification, re-contact with the relevant source or respondent. The dataset is refreshed annually, updated between cycles when a material policy, supply or demand event changes the outlook, and checked again in a fresh pre-delivery review.
Mordor Intelligence's Diesel As Fuel Market Estimate Compared With Other Published Estimates
Published estimates can differ in the transactions and products they count and the inputs used to model demand. The diesel as fuel market measures annual spending on diesel fuels consumed worldwide.
Key Gap Drivers include the study's defined coverage and market-specific modeling choices. Demand indicators include commercial vehicle and freight activity, marine fuel use, agricultural and construction equipment activity, and diesel generator use.
Benchmark comparison
| Source | Market Size | Gaps in Research Methodology |
|---|---|---|
| Mordor Intelligence | USD 272 B (2027) | |
| Global Consultancy A | USD 1.11 T (2025) | At its 2025 base, this estimate is 308.2% above this report's 2027 value of USD 272 B, 2 years later. |
| Global Consultancy B | USD 226.7 B (2024) | At its 2024 base, this estimate is 16.6% below this report's 2027 value of USD 272 B, 3 years later. |
Mordor Intelligence's analysts triangulate market estimates against independent fuel-use statistics, supplier disclosures, trade flows, prices and end-user activity, then review anomalies and material variances across years, regions and segments before sign-off.
Key Questions Answered in the Report
What is the Diesel As Fuel market size and growth outlook?
The size is projected at USD 272 billion in 2027 and USD 316 billion by 2032, growing at a CAGR of 3.05% from 2027 to 2032.
What is supporting demand for diesel fuel?
India's registered bus fleet was 84.65% diesel in March 2025, providing a large potential customer base. Growing data-center backup needs add another fuel-demand channel.
Which diesel grade leads fuel sales?
Ultra-low sulfur diesel held a 67.5% share in 2026. Biodiesel blends from B5 to B20 are forecast to grow fastest at a CAGR of 7.2% from 2027 to 2032.
Which companies are major diesel fuel suppliers?
Major participants include Chevron, Exxon Mobil, Shell, BP, and Saudi Aramco.
What challenges constrain diesel fuel suppliers?
Bus electrification and carbon-related fuel taxes constrain demand. Toronto Transit Commission had 259 battery-electric buses in service in April 2026.
Which region leads the diesel fuel industry?
Asia-Pacific held a 42.58% share in 2026 and is forecast to grow fastest at a CAGR of 3.8% from 2027 to 2032.