
Shipping Containers Market Size and Share
Market Overview
| Study Period | 2020 - 2031 |
|---|---|
| Market Size (2026) | USD 10.7 Billion |
| Market Size (2031) | USD 13.14 Billion |
| Growth Rate (2026 - 2031) | 4.19 % |
| Fastest Growing Market | Asia Pacific |
| Largest Market | Asia Pacific |
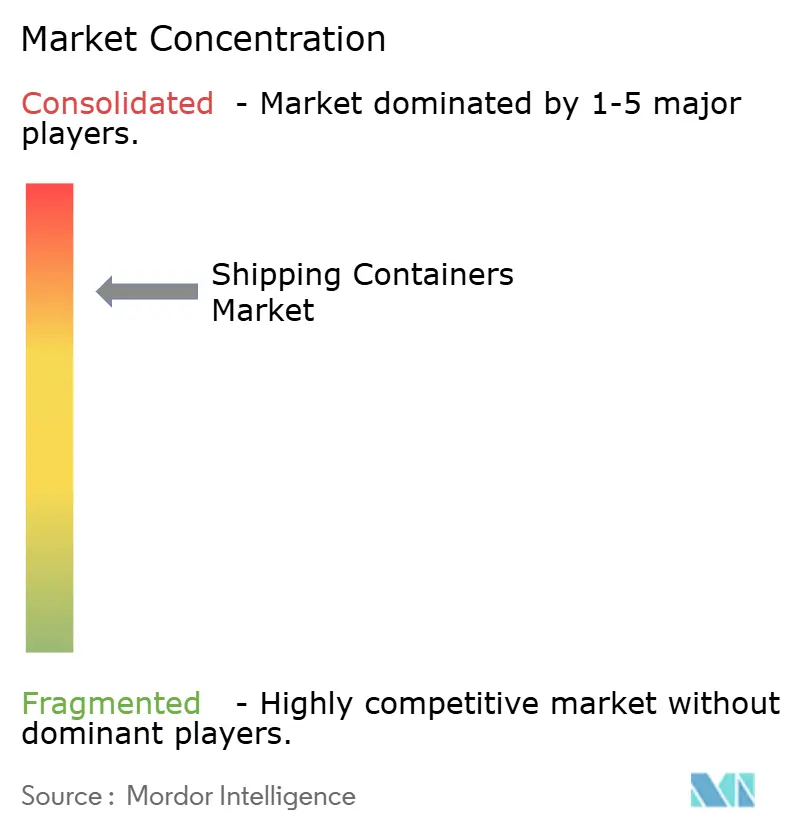
| Market Concentration | High |
Major Players *Disclaimer: Major Players sorted in no particular order Image © Mordor Intelligence. Reuse requires attribution under CC BY 4.0. | |
Shipping Containers Market Analysis by Mordor Intelligence
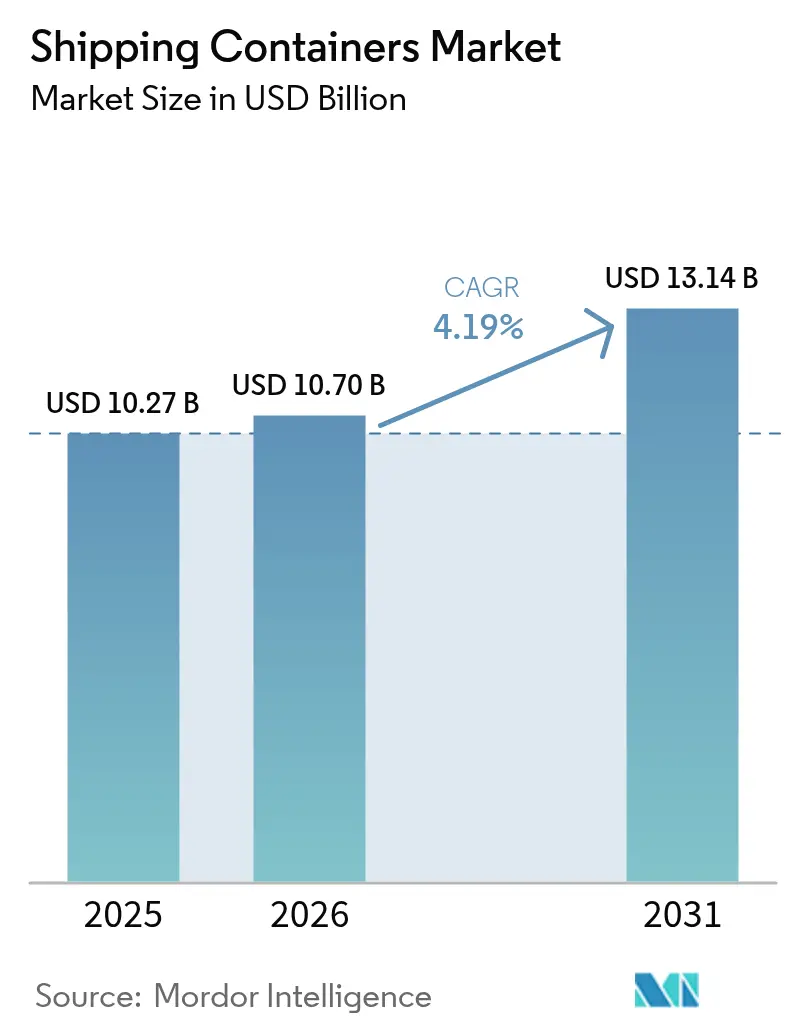
Shipping Containers market size in 2026 is estimated at USD 10.7 billion, growing from 2025 value of USD 10.27 billion with 2031 projections showing USD 13.14 billion, growing at 4.19% CAGR over 2026-2031.
E-commerce fulfillment, pharmaceutical cold-chain expansion, and rising intermodal efficiency provide stable, structural demand. Containerization’s role in handling 90% of global trade underpins this growth, while digital tracking tools and smarter designs help operators shorten port stays and boost asset turnover. Sustainability targets are pushing material innovation toward lighter composites, and alliance restructuring among carriers is reshaping capacity deployment strategies in favor of larger, technology-enabled fleets. Geopolitical disruptions add short-term volatility but also reinforce the importance of diversified trade lanes and dynamic routing.
Key Report Takeaways
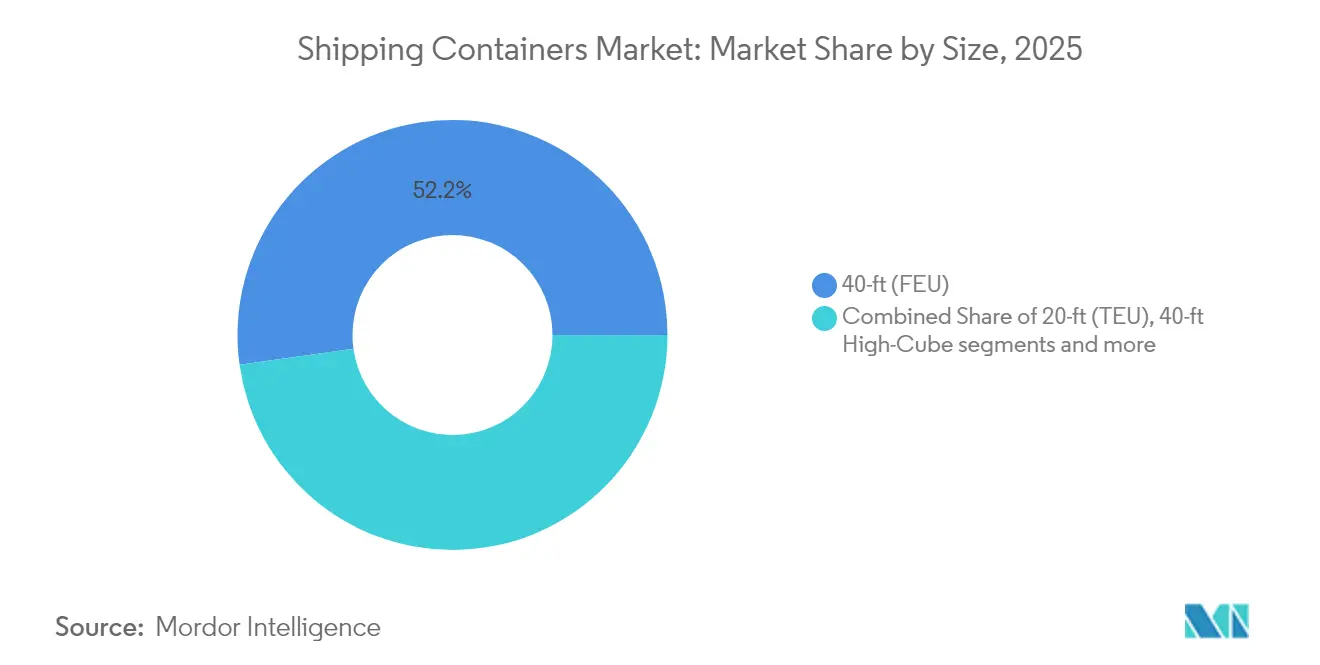
- By size, 40-ft containers captured 52.21% of shipping container market share in 2025; 40-ft High-Cube units are projected to expand at a 5.43% CAGR through 2031.
- By container type, dry storage held 72.32% of the shipping container market size in 2025, whereas refrigerated boxes are advancing at a 6.18% CAGR to 2031.
- By material, Corten steel accounted for 86.78% share of the shipping container market size in 2025, while FRP & composites record the highest 7.51% CAGR.
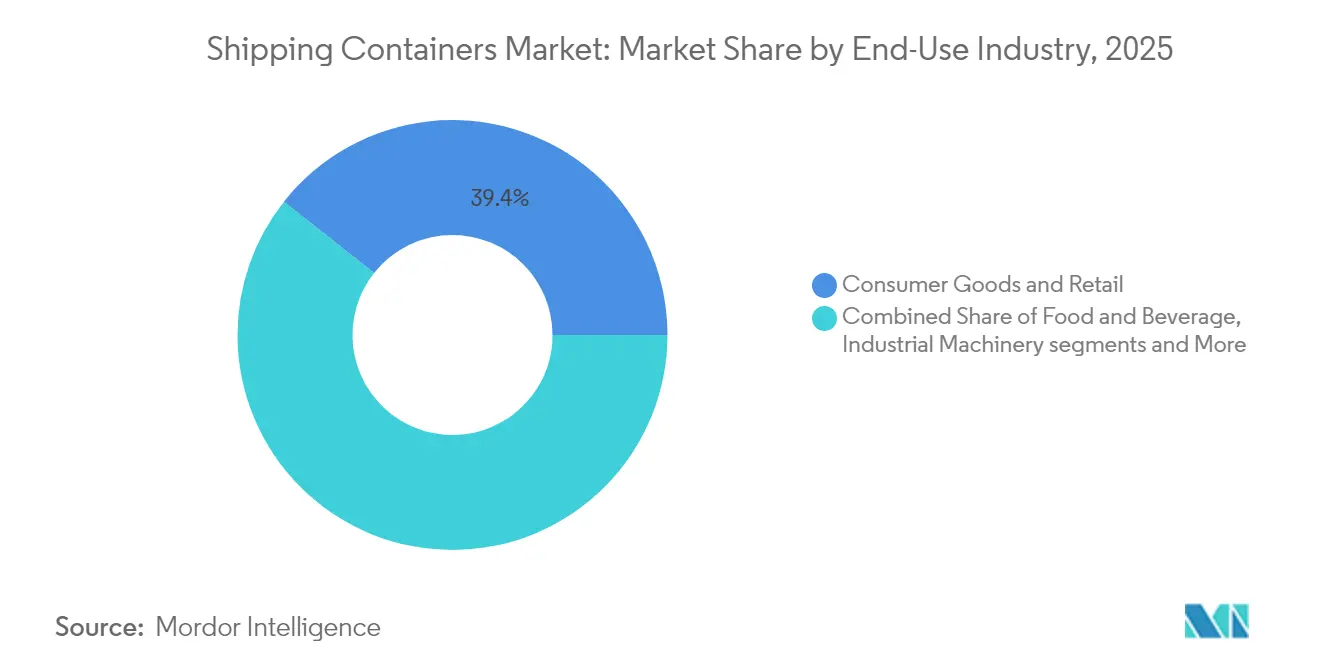
- By end-use, consumer goods & retail dominated with 39.35% shipping containers market share in 2025; pharmaceuticals & healthcare is growing fastest at an 7.92% CAGR.
- By mode of transport, maritime deep-sea operations controlled 80.12% of 2025 shipping containers market revenue, yet rail intermodal exhibits a 5.18% CAGR to 2031.
Note: Market size and forecast figures in this report are generated using Mordor Intelligence’s proprietary estimation framework, updated with the latest available data and insights as of 2026.
Market Trends and Insights
Drivers Impact Analysis of Shipping Containers Market*
| Driver | (~) % Impact on CAGR Forecast | Geographic Relevance | Impact Timeline |
|---|---|---|---|
| Explosive growth of cross-border e-commerce | +0.8% | Global, North America & APAC | Medium term (2-4 years) |
| Worldwide cold-chain penetration | +0.6% | Global, North America & Europe | Long term (≥ 4 years) |
| D2C brands using bespoke containers | +0.3% | North America & Europe, expanding to APAC | Medium term (2-4 years) |
| Corporate ESG mandates on reusability | +0.4% | Global, led by Europe & North America | Long term (≥ 4 years) |
| Adoption of IoT-enabled smart boxes | +0.5% | Global, developed markets first | Medium term (2-4 years) |
| Second-life modular housing demand | +0.2% | North America, Australia, parts of Europe | Long term (≥ 4 years) |
| Source: Mordor Intelligence | |||
Explosive Growth of Cross-Border E-Commerce Creating 24-Hour Turnaround Expectations
E-commerce expansion drives more frequent, smaller shipments, shifting focus from vessel capacity toward port velocity. Carriers commit additional equipment to high-frequency loops, while ports invest in automated cranes that clear vessels inside one shift. Smart tracking allows shippers to pre-clear customs and book rail slots before docking. These operational gains shorten inventory cycles and reinforce preference for standard dry boxes, keeping utilization high even when trade volumes fluctuate. As online marketplaces penetrate emerging economies, the shipping container market sees sustained baseline demand across diverse trade lanes.
Worldwide Cold-Chain Penetration Accelerates Advanced Reefer Orders
Pharmaceutical producers are migrating long-haul shipments from air to ocean to cut costs and emissions without compromising temperature control. Modern reefers maintain ±0.5 °C accuracy and integrate telemetry that flags deviations in real time, allowing corrective actions mid-voyage. Fresh grocery exporters adopt similar technology to reach distant consumers with minimal spoilage. Manufacturers offering dual-fuel refrigeration units reduce energy consumption and meet low-GWP regulations, enabling higher price realisation per box. As grocery e-commerce extends to new markets, advanced reefer demand continues to outpace general cargo growth.
Direct-to-Consumer Brands Demanding Bespoke, Logo-Printed Containers
Lifestyle companies repurpose branded units as mobile stores that double as micro-fulfilment hubs during seasonal events. This niche lifts orders for one-trip boxes with custom paint and internal racking. While volumes remain small, margins are high and foster closer collaboration between box makers and marketing agencies. The trend also spurs requests for side-door and tunnel variants that enable experiential retail layouts, widening the specification palette within the shipping container market.
Corporate ESG Mandates Pushing Reusable Container Adoption
Large retailers commit to cutting single-use plastics by shifting bulk imports into reusable multimodal containers. Box manufacturers respond with composite panels that lower tare weight and extend service life, improving lifecycle emissions performance. Steel makers introduce recycled and low-carbon grades such as Zeremis Recycled with 30% scrap content[1]. Leasing companies structure circular leasing pools that guarantee refurbishment and redeployment, easing capital barriers for smaller shippers and aligning asset use with ESG scorecards.
Restraints Impact Analysis of Shipping Containers Market*
| Restraint | (~) % Impact on CAGR Forecast | Geographic Relevance | Impact Timeline |
|---|---|---|---|
| Post-pandemic oversupply of boxes | -1.2% | Global, China & North America | Short term (≤ 2 years) |
| Volatility in hot-rolled coil prices | -0.7% | Global, Asian manufacturing hubs | Short term (≤ 2 years) |
| Stricter cradle-to-grave regulations | -0.4% | Europe & North America, expanding to APAC | Medium term (2-4 years) |
| Emergence of foldable container alternatives | -0.3% | Global, early in Europe & developed markets | Long term (≥ 4 years) |
| Source: Mordor Intelligence | |||
Post-Pandemic Oversupply of Boxes Eroding Utilization Rates
Record new builds made during 2021-2023 create a temporary surplus, pushing lease rates down and prompting operators to delay fresh orders. Idle inventories accumulate in gateway ports when trade softens, forcing depots to lower storage fees to attract repositioning business. Manufacturers adapt by trimming production shifts and redirecting capacity toward specialized designs with steadier demand. The correction is expected to resolve once scrappage catches up with ageing fleets and trade normalizes.
Volatility in Hot-Rolled Coil Steel Prices Creating Budget Uncertainty
Steel accounts for nearly 60% of a dry box’s cost, and price swings compress margins when contracts lack escalation clauses. Small leasing firms struggle to hedge raw materials, prompting them to delay renewals and rely on extended life cycles for existing assets. Some buyers hedge through frame agreements tied to steel indices, but this approach favors larger volume players. Interest in composites grows as customers seek cost stability, even if initial outlays remain higher than Corten steel.
*Our forecasts treat driver/restraint impacts as directional, not additive. The impact forecasts reflect baseline growth, mix effects, and variable interactions.
Shipping Containers Market Segment Analysis
By Size:
High-Cube Efficiency Drives Volume OptimizationHigh-cube offerings are capturing incremental demand because their 13% extra headroom maximizes volumetric loads such as e-commerce parcels and lightweight consumer electronics. 40-ft formats generated 52.21% revenue in 2025, demonstrating entrenched popularity for ocean freight, whereas 40-ft high-cube units are forecast to grow at 5.43% CAGR to 2031. The shipping container market size for high-cube units reflects shipper preference for greater capacity without breaching weight restrictions.
Port infrastructure upgrades accommodate taller stacks, and terminal operators add reach-stackers with extended lifting heights to handle these units efficiently. Logistics integrators promote standardization on the 40-ft profile to streamline rail wagon allocation and depot interchange. Triton Containers markets high-cube leases with flexible pick-up options to reduce repositioning, reinforcing adoption. Overall, shipper focus on cubic efficiency and consolidation of packaging drives continued high-cube traction across primary trade corridors.

By Container Type:
Reefer Innovation Transforms Cold-Chain LogisticsDry storage boxes accounted for 72.32% of 2025 shipments, underscoring their status as the backbone of global commodity flows. In contrast, reefer units record a 6.18% CAGR to 2031 as fresh produce exporters and drug makers scale ocean routes. Refrigerated boxes currently represent the premium slice of the shipping container market, commanding rental rates two to three times higher than dry units.
Technology upgrades include variable-speed compressors and solar-assisted power modules that cut energy draw during idle periods. Pharmaceutical shippers require redundant temperature probes and door sensors that trigger alerts within seconds of deviation, driving differentiation among manufacturers. Reefers also benefit from decarbonization, as shifting temperature-sensitive goods from air to sea avoids up to 80% of related emissions.
By Material:
Composite Innovation Challenges Steel DominanceCorten steel’s 86.78% share stems from low material cost, weldability, and robust global repair networks. Yet FRP and composite panels are rising at a 7.51% CAGR as ESG audits favor lighter boxes that consume less fuel per trip. The shipping container market share of composites remains modest but growing, particularly in temperature-controlled and corrosive cargo scenarios.
Steel makers are not standing still. SSAB collaborates with ILAB Container to commercialize fossil-free steel production that cuts lifecycle CO₂ emissions by up to 90%. These innovations help steel retain relevance while meeting sustainability criteria. Composite fabricators push modular roofs and panels that bolt onto standard steel frames, easing depot repairs and accelerating field acceptance.
By End-Use Industry:
Healthcare Acceleration Reshapes Demand PatternsConsumer goods and retail demand maintained 39.35% of 2025 volume, powered by omnichannel fulfilment and seasonal fashion cycles. Pharmaceuticals and healthcare, though smaller, register an 7.92% CAGR through 2031, helping lift the shipping container market size for value-added reefer equipment. Vaccine distribution relies on passive cooling blankets inside reefers, increasing per-box revenue.
Food and beverage shippers continue steady contracting, particularly in South–South corridors where middle-class diets diversify. Industrial machinery loads benefit from nearshoring, as firms relocate assembly from Asia to North America and Eastern Europe. Regulatory harmonization for dangerous goods fosters adoption of tank containers in the chemical sector, further segmenting product demand profiles.
By Mode of Transport:
Rail Intermodal Captures Efficiency GainsDeep-sea services accounted for 80.12% of the shipping containers market 2025 turnover, but rail intermodal posts a 5.18% CAGR as governments subsidize modal shift from road to track. The shipping container market size tied to inland rail corridors reflects cost savings on hauls above 500 miles. Railways invest in double-stack clearances and automated yard cranes, lowering dwell times.
Intermodal operators retrofit wagons with GPS sensors that synchronize with port community systems, allowing near real-time ETA updates. Box builders equip reinforced corner castings to tolerate higher coupling forces on long trains. Short-sea carriers complement rail by feeding transshipment hubs, creating an integrated network that multiplies container turns per year and attracts shipper loyalty.
Geography Analysis
APAC Shipping Containers Market
Asia-Pacific dominated the shipping containers market with 59.88% revenue in 2025 and is set to grow at a 5.46% CAGR to 2031. China retains manufacturing leadership, yet Southeast Asia captures incremental volumes as firms diversify sourcing. Malaysian and Indian mega-port projects add more than 25 million TEU of annual capacity, anchoring regional throughput and stimulating container demand across feeder networks. Currency stability and supportive trade agreements also encourage regional leasing pools to expand their fleets.
North America Shipping Containers Market
North America benefits from nearshoring that shifts electronics and automotive assembly closer to consumption markets. United States port authorities approve multi-billion-dollar dredging and berth electrification programs, enhancing competitiveness against Mexican and Canadian gateways. The rail intermodal build-out across the Midwest unlocks cost-effective land bridges that connect Atlantic and Pacific basins in under eight days, driving uptake of stack-train compatible container designs.
Europe Shipping Containers Market
Europe records mixed growth shipping container market as geopolitical tensions divert Asia-Europe sailings around Africa, extending transit times but also directing additional calls to Mediterranean hubs. Investments in automation at London Gateway and Rotterdam Maasvlakte raise throughput per crane hour, cushioning cost-per-box metrics. Stringent environmental regulations accelerate the retirement of older, heavier boxes in favor of recycled-content steel units, supporting replacement demand despite subdued trade volume growth.

Note: Segments share of all individual segments available upon report purchase
Regulatory Landscape
The shipping containers market operates under a mix of international safety rules and national enforcement frameworks that affect equipment specifications, reporting obligations, and carrier-shipper practices. At the international level, the IMO reinforced operational accountability for container losses. Effective January 1, 2026, SOLAS Chapter V reporting requirements oblige ship masters to report containers lost overboard to nearby vessels, the nearest coastal state, and the flag state, with subsequent notification through the IMO GISIS system.
In the United States, the Federal Maritime Commission (FMC) tightened the conduct perimeter for ocean common carriers under Ocean Shipping Reform Act implementation, including rules effective September 23, 2024 that prohibit unreasonable refusals of cargo space accommodations. In April 2026, the U.S. Court of Appeals for the DC Circuit upheld the FMC approach that demurrage and detention fees must align with the incentive principle, promoting freight fluidity rather than functioning as punitive charges during disruptions, which influences how equipment-related fees are structured and contested during congestion or port closures. In Europe, the European Commission adopted the EU Industrial Maritime Strategy and an EU Ports Strategy on March 4, 2026, placing additional policy weight on port electrification, security, and competitiveness measures that shape container handling ecosystems and replacement decisions across major EU gateways.
Value Chain Analysis
The value chain starts with upstream inputs, primarily steel for standard dry boxes and specialized components for reefers, followed by container design, fabrication, coating, and certification under established safety and structural regimes such as the International Convention for Safe Containers (CSC) and ISO 1496 specifications. Manufacturing remains concentrated in Asia, with China as a major production hub, while demand is transmitted downstream by ocean carriers and container leasing companies that run large procurement programs and manage lifecycle activities such as depot repair, refurbishment, repositioning, and end-of-life disposal.
Downstream value is created through intermodal integration across ports, rail yards, and inland depots, where terminal operators, forwarders, and NVOCCs coordinate equipment availability against vessel schedules and hinterland connections. Digital operating standards and data exchange initiatives, including industry blueprints promoted by the Digital Container Shipping Association (DCSA), increasingly influence how parties manage equipment handoffs and exceptions. The chain is sensitive to productivity shocks that reduce container turns, such as longer rerouting cycles that tie up equipment, which raises the importance of asset visibility, maintenance planning, and network control strategies among large carriers and lessors.
Competitive Landscape
Container shipping alliances are undergoing a new round of restructuring following the scheduled end of legacy partnerships. The upcoming Gemini Cooperation between two leading carriers consolidates sailings on the main east-west lanes, raising service frequency and lowering slot costs per TEU. Smaller lines respond by entering vessel-sharing agreements that spread risk and secure loading windows at major terminals.
Leasing consolidation intensifies as private equity targets steady cash flows from long-term charter contracts. The USD 7.4 billion purchase of a top-five lessor by Stonepeak demonstrates investor appetite for asset-heavy platforms able to lock in predictable returns through diversified portfolios. Scale allows these owners to negotiate favorable box prices and roll out smart tracking at fleet level sooner than smaller rivals.
Technology adoption forms the next competitive front. CMA CGM’s collaboration with a global cloud provider integrates AI into voyage optimisation, cutting bunker consumption by 4% per sailing. Terminal operators trial fully electric straddle carriers that reduce diesel use and improve air quality at port communities. Manufacturers racing to meet these digital and sustainability demands hold pricing power, strengthening the moderate concentration of the shipping container market.
Shipping Containers Industry Leaders
-
China International Marine Containers Co. Ltd
-
Maersk Container Industry AS
-
CXIC Group Containers Co., Ltd.
-
Singamas Container Holdings Ltd.
-
Dong Fang International Container (Hong Kong) Co. Ltd
- *Disclaimer: Major Players sorted in no particular order
Shipping Containers Market Companies Covered in this Report
- China International Marine Containers (CIMC)
- Dong Fang International Containers
- CXIC Group (CSSC)
- Maersk Container Industry A/S
- Singamas Container Holdings
- W&K Container
- Sea Box Inc.
- TLS Offshore Containers
- Storstac Inc.
- CARU Containers B.V.
- China Eastern Containers
- Valisons & Co.
- YMC Container Solutions
- American Intermodal Container Manufacturing
- Triton International
- Textainer Group Holdings
- Florens Container Services
- CAI International
- Touax Group
- UES International
Market Opportunities and Future Outlook
Port and hinterland capacity projects are creating whitespace for higher equipment velocity and more reliable intermodal flows, supporting container replacement and specialization rather than pure fleet growth. In July 2026, the Port of Vancouver selected the TerraMarine consortium for the Roberts Bank Terminal 2 design-build, an expansion framed around 2.4 million TEU of additional annual container capacity, which points to a multi-year throughput pipeline that depends on equipment availability and depot-rail synchronization. In Europe, the Port of Antwerp-Bruges received approval from the Government of Flanders for the Container Cluster Linkerscheldeoever project, adding a dedicated rail freight yard alongside a major capacity step-up and reinforcing the role of rail-linked container flows that favor standardized, stack-train compatible equipment.
New container-port developments in Southeast Asia and the Middle East also highlight opportunities for smart-port integration and faster box turns, particularly for time- and condition-sensitive cargo. In July 2026, Midports Holdings (a Tanco subsidiary) broke ground on a smart AI container port project in Kuala Sungai Linggi, Malaysia, with an announced target capacity of 8 million TEUs, while a consortium commenced construction of the Cai Mep Ha port project in Vietnam designed for 10.8 million TEUs annually. In the Gulf, Gulftainer accelerated an expansion at Khor Fakkan Port in Sharjah to lift capacity from 3.5 million to 5 million TEUs, with a longer-range masterplan reaching 10 million TEUs, supporting demand for more resilient equipment positioning and higher-value containers such as reefer units with digital monitoring tied into port and carrier operating systems.
Recent Industry Developments in Shipping Containers Market
- July 2026: DCM Shriram delivered the first India-manufactured EXIM shipping container to A.P. Moller-Maersk, and Maersk placed an additional order for 1,000 units. The milestone supports supply diversification away from a single dominant manufacturing geography and creates a pathway for localized sourcing programs linked to carrier procurement and depot networks.
- May 2025: DP World started a USD 1.3 billion expansion at London Gateway, including the introduction of two fully electric berths. The project strengthens terminal productivity and decarbonization efforts, influencing equipment flows and encouraging better-aligned container availability as ports pursue higher crane-hour throughput.
- November 2024: Evergreen ordered 60,500 new containers to support its liner fleet. The order highlighted carrier-led equipment procurement cycles and increased competitive pressure on leasing and manufacturing supply, particularly for standard dry boxes and operationally flexible configurations.
Shipping Containers Market Report Scope and Research Methodology
Market Definition and Coverage
For this methodology, the shipping containers market means the value of new intermodal freight containers sold for cargo transport, covering standard and specialized boxes used across ocean, rail, and road moves.
Scope exclusions: We exclude second-hand container resale, container leasing income, container conversions for buildings, and container handling equipment.
Segments Covered in This Report
- By Size
- 20-ft (TEU)
- 40-ft (FEU)
- 40-ft High-Cube,
- Others ( >45-ft, etc)
- By Container Type
- Dry Storage (Standard)
- Refrigerated (Reefer)
- Tank (ISO Tank, Cryogenic)
- Flat-Rack & Open-Top
- Special Purpose (Side-Door, Tunnel, Insulated, Collapsible)
- By Material
- Corten Steel
- Stainless Steel
- Aluminium Alloy
- FRP & Composite
- Others
- By End-Use Industry
- Consumer Goods & Retail
- Food & Beverage
- Industrial Machinery & Automotive
- Chemicals & Petroleum
- Pharmaceuticals & Healthcare
- Others
- By Mode of Transport
- Maritime Deep-Sea
- Short-Sea & Coastal
- Rail Intermodal
- Road Inland Haulage & Off-Site Storage
- By Geography
- North America
- United States
- Canada
- Mexico
- South America
- Brazil
- Peru
- Chile
- Argentina
- Rest of South America
- Asia-Pacific
- China
- India
- Japan
- Australia
- South Korea
- South East Asia (Singapore, Malaysia, Thailand, Indonesia, Vietnam, and Philippines)
- Rest of Asia-Pacific
- Europe
- United Kingdom
- Germany
- France
- Spain
- Italy
- BENELUX (Belgium, Netherlands, and Luxembourg)
- NORDICS (Denmark, Finland, Iceland, Norway, and Sweden)
- Rest of Europe
- Middle East And Africa
- United Arab Emirates
- Saudi Arabia
- South Africa
- Nigeria
- Rest of Middle East And Africa
- North America
Data Sources, Market Sizing, and Validation
Desk Research
Desk work started with public datapoints that explain demand and supply signals around containers, so the model inputs do not float away from real trade activity. Sources used include UN Comtrade trade statistics for containerized flows, UNCTAD maritime transport indicators for shipping context, World Bank logistics and trade datasets, IMF macro series, and WTO trade updates, followed by port authority dashboards and customs publications where available.
We then compared those signals with manufacturer disclosures, investor presentations, audited annual reports, and industry association pages to track production capacity changes, delivery lead times, and typical price movement by container type. Patent databases were also scanned to sense where materials and coatings are shifting, and we used a paid subscription for company financials and news to cross-check key company-level timelines and expansion announcements. These examples are illustrative and not exhaustive, and we referenced other public sources as well for data collection, validation, and clarification.
Primary Interviews and Surveys
Primary work was used to test the desk assumptions with people who see transactions and fleet planning directly, such as container manufacturers, leasing firms, shipping lines, freight forwarders, and intermodal operators. Since this is a global market, interviews were balanced across major trade corridors so changes in newbuild orders, repairability, and box availability were not judged from one region only. When gaps showed up, we went back to confirm typical ASP ranges, buying cycles, and how the mix between dry and refrigerated containers is handled in budgeting.
Distribution of primary research fieldwork respondents
| Company type | Respondent position | Region |
|---|---|---|
| Top tier: 34% | CXOs: 14% | APAC: 53% |
| Mid tier: 52% | Functional/Unit leaders: 35% | EMEA: 29% |
| Smaller Players: 14% | Managers: 51% | Americas: 18% |
Market-Sizing & Forecasting
Sizing was built using top-down and bottom-up logic, with the core total derived from demand pool reconstruction tied to containerized trade and fleet replenishment behavior. In practice, we start from trade and throughput indicators, apply replacement and net-addition needs, and then convert that need into value using realistic price bands by container type.
To keep the model practical, a few key inputs were treated as the main drivers, such as containerized trade growth, port throughput direction, newbuild order timing, average selling prices by container type, and the share of specialized units like reefers in the annual mix. Where data was missing, conservative ranges were set and then tightened using interview feedback, which helped avoid overfitting to a single data series.
For forecasting, scenario analysis was used so price cycles and order deferrals could be expressed clearly, and then the path was cross-checked against a simpler time-series trend for reasonableness. Selective bottom-up approximations were also used, including sampled ASP time-volume checks and supplier and channel discussions, which helped adjust totals when mix assumptions appeared off.
Data Validation & Update Cycle
We validated outputs by comparing model totals against independent signals, including trade growth direction, port activity trends, and the order book tone heard in interviews, then adjusted inputs only when at least two signals pointed the same way. Outliers were flagged through variance checks across regions and container types, followed by a second analyst review so assumptions were not kept just because they were convenient.
Updates are done on an annual refresh cycle, and interim revisions are triggered when material events occur, such as sudden price shocks, production curtailments, or major demand changes on key routes. Before delivery, an analyst runs a fresh pass across core inputs so clients receive the latest view rather than an older snapshot.
Mordor Intelligence's Shipping Containers Market Size Measured Against Other Published Estimates
Published market values for shipping containers often look different because the underlying timing and pricing treatment is not consistent across studies, even when they use similar wording in the scope. Differences usually come from which year is treated as the pricing anchor, what is counted as a sale versus a service, and whether mix changes between dry and reefer boxes are updated during the year.
When exchange rates and steel-linked ASP movement are refreshed closer to the actual pricing period, the total can shift materially. This is where annualized currency timing and repeated validation checks against order cycle signals keep Mordor Intelligence tied to newbuild demand rather than inflated totals.
Benchmark comparison
| Source | Market Size | Gaps in Research Methodology |
|---|---|---|
| Mordor Intelligence | USD 10.70 B (2026) | |
| Industry Publisher A | USD 8.40 B (2026) | Uses a lower price deck that appears closer to a conservative ASP assumption for standard dry boxes, and it does not clearly show how specialized container mix and timing of price recovery are updated during the forecast start year. |
| Global Consultancy B | USD 12.22 B (2025) | A different base year is used and the scope language does not clearly separate new container sales from adjacent revenue pools, which can push totals up when conversion, services, or broader logistics activities are blended in. |
Overall, the spread is mainly explained by year choice and how pricing and mix are refreshed, rather than by a disagreement that containers are growing. By keeping the scope focused on new container sales and using repeatable checks on pricing and demand signals, the final number stays traceable to clear inputs that can be revisited as conditions change.
Key Questions Answered in the Report
What is the current size of the shipping container market?
The market stands at USD 10.7 billion in 2026 and is projected to reach USD 13.14 billion by 2031 with a 4.19% CAGR.
Which region leads the shipping container market?
Asia-Pacific holds 59.88% of global revenue in 2025 and is also the fastest-growing region through 2031.
Why are reefer containers growing faster than dry containers?
Pharmaceutical and fresh grocery shippers are moving temperature-sensitive goods from air to sea, boosting demand for advanced refrigerated boxes that offer precise climate control at lower transport cost.
How are sustainability goals influencing container materials?
Corporate ESG commitments spur adoption of recycled-content steel and lightweight composites, with FRP & composite materials expanding at a 7.51% CAGR as operators seek lower lifecycle emissions.
What role does rail intermodal play in container transport growth?
Rail intermodal is the fastest-growing mode at 5.18% CAGR because infrastructure upgrades and environmental policies encourage shippers to shift long-distance inland moves from road to rail.
How is digital innovation affecting container ownership economics?
IoT-enabled smart boxes provide real-time visibility and predictive maintenance, allowing owners to charge premium lease rates while reducing downtime and unplanned repairs.