
Market Overview
| Study Period | 2019 - 2031 |
|---|---|
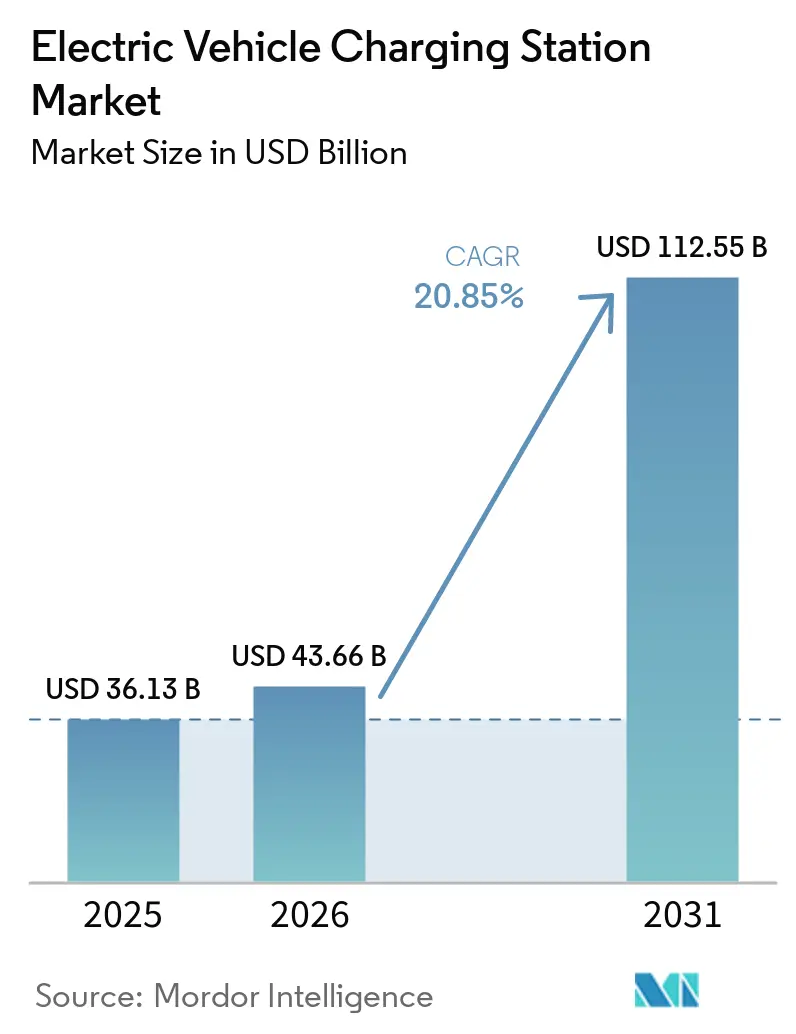
| Market Size (2026) | USD 43.66 Billion |
| Market Size (2031) | USD 112.55 Billion |
| Growth Rate (2026 - 2031) | 20.85 % |
| Fastest Growing Market | Europe |
| Largest Market | Asia Pacific |
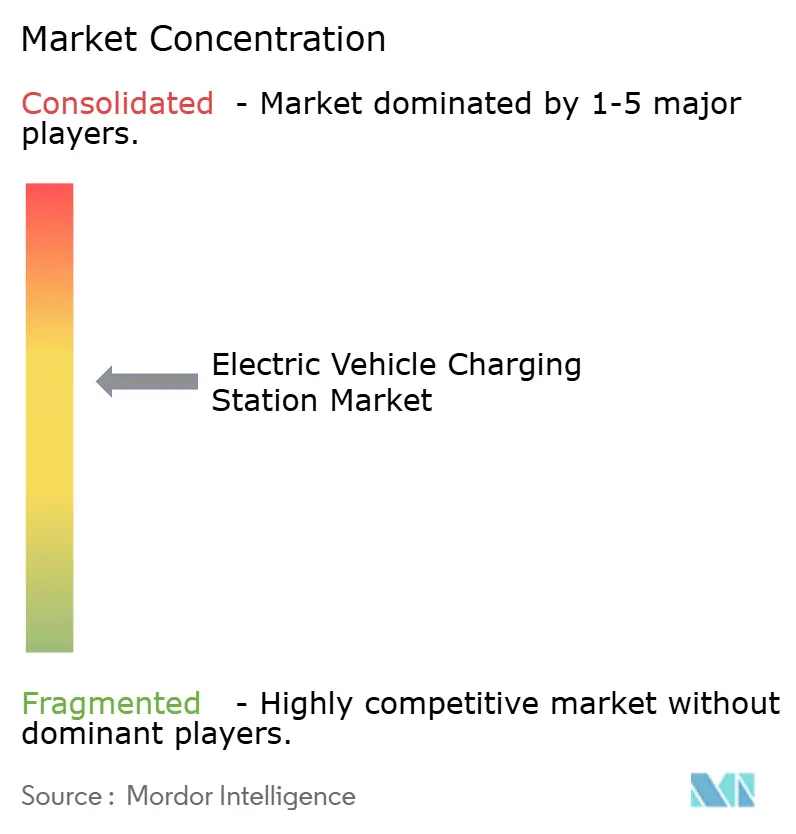
| Market Concentration | Medium |
Major Players
*Disclaimer: Major Players sorted in no particular order Image © Mordor Intelligence. Reuse requires attribution under CC BY 4.0. |
|
Electric Vehicle Charging Station Market Analysis by Mordor Intelligence
The Electric Vehicle Charging Station Market size was valued at USD 36.13 billion in 2025, is estimated at USD 43.66 billion in 2026, and is projected to reach USD 112.55 billion by 2031, growing at a CAGR of 20.85% from 2026-2031. Continuous policy pressure to phase out internal-combustion engines, steep declines in battery costs that bring total ownership parity closer, and the rollout of highway fast-charging corridors that neutralize range anxiety are the core forces keeping demand on a steep climb. Large fleet operators are locking in multi-year electrification targets, guaranteeing high charger utilization, while vehicle-to-grid business models create additional revenue layers that lift project returns. Asia-Pacific still accounts for most installations, but Europe now shows the fastest incremental growth, driven by cross-border network alliances. In North America, the NEVI Formula Program and the opening of Tesla’s Supercharger system to other brands accelerate deployment while raising baseline technology expectations. Meanwhile, energy majors like Shell are closing petroleum stations and reallocating capital toward high-power chargers, signaling a strategic shift that intensifies competition.
Key Report Takeaways
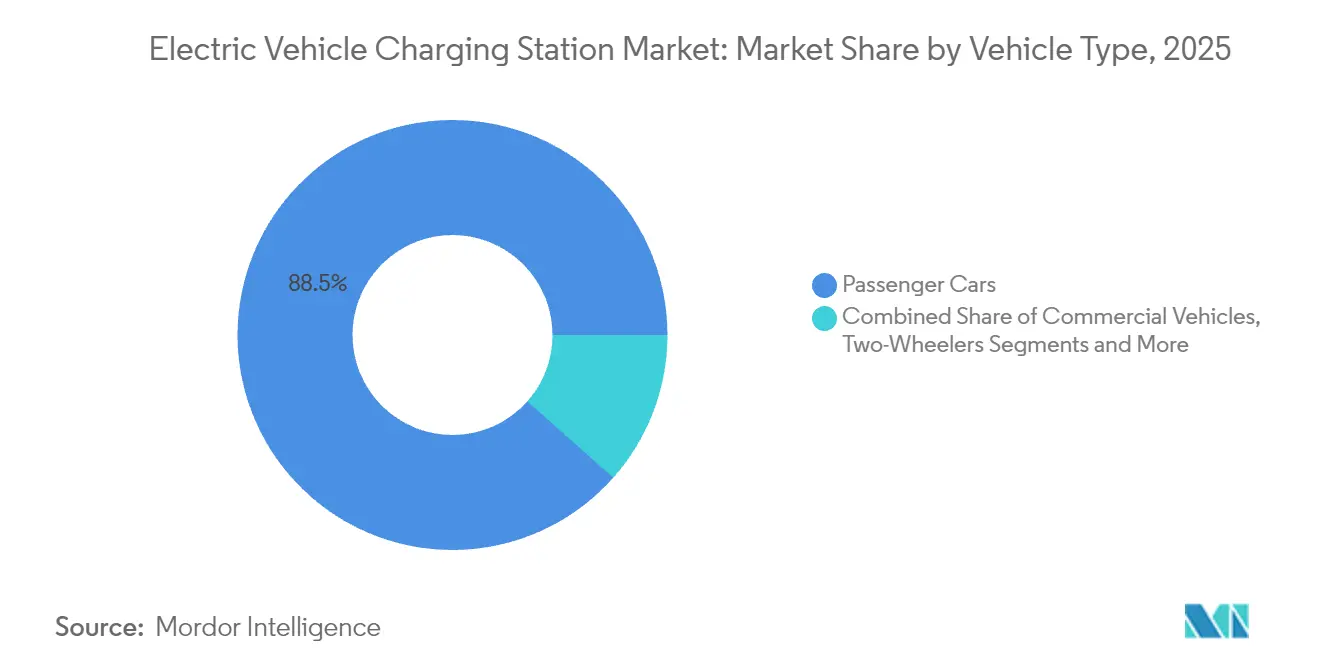
- By vehicle type, passenger cars led with 88.45% of the electric vehicle charging station market revenue share in 2025, while commercial vehicles are projected to expand at a 52.20% CAGR through 2031.
- By charger type, DC charging stations captured 77.95% of the electric vehicle charging station market revenue in 2025, and are expected to grow at a 53.10% CAGR to 2031.
- By ownership model, public infrastructure accounted for 67.55% of the electric vehicle charging station market size in 2025 and is advancing at a 27.40% CAGR through 2031.
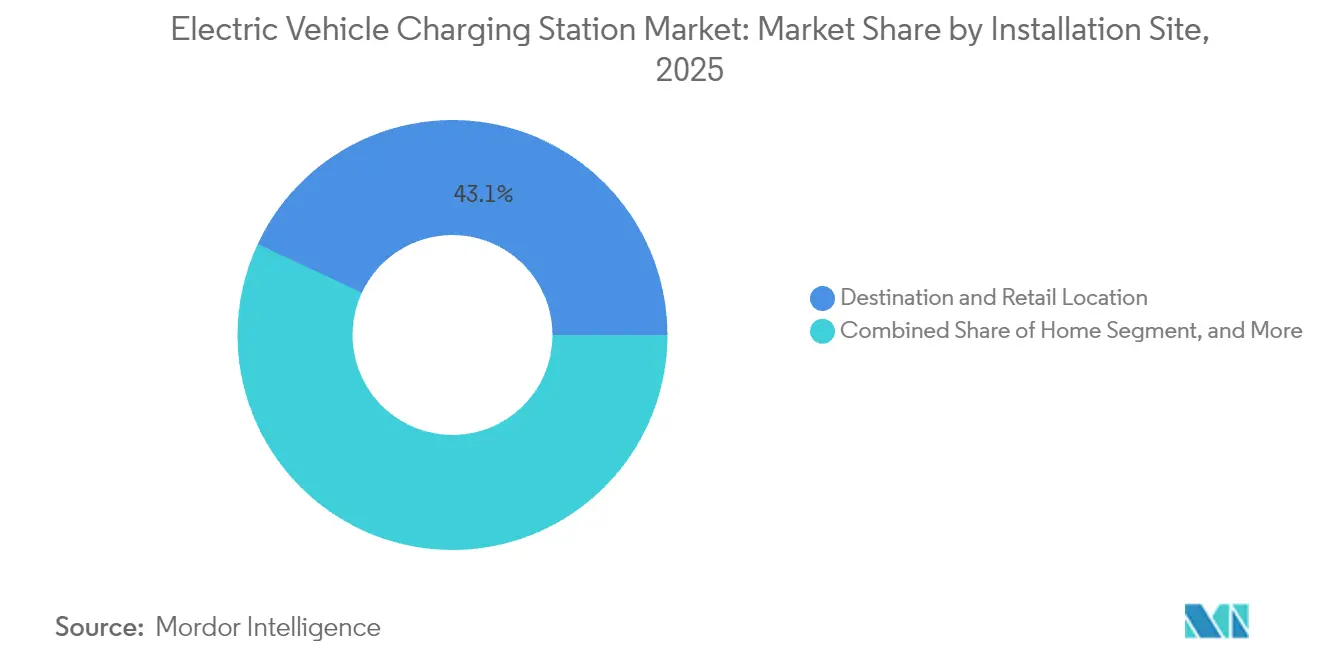
- By installation site, destination/retail locations accounted for 43.05% of the electric vehicle charging station market revenue in 2025, while highway/transit sites registered the fastest CAGR at 44.10% through 2031.
- By connector standard, CCS led with 35.95% of the electric vehicle charging station market revenue share in 2025, while wireless charging recorded the highest CAGR at 37.90% through 2031.
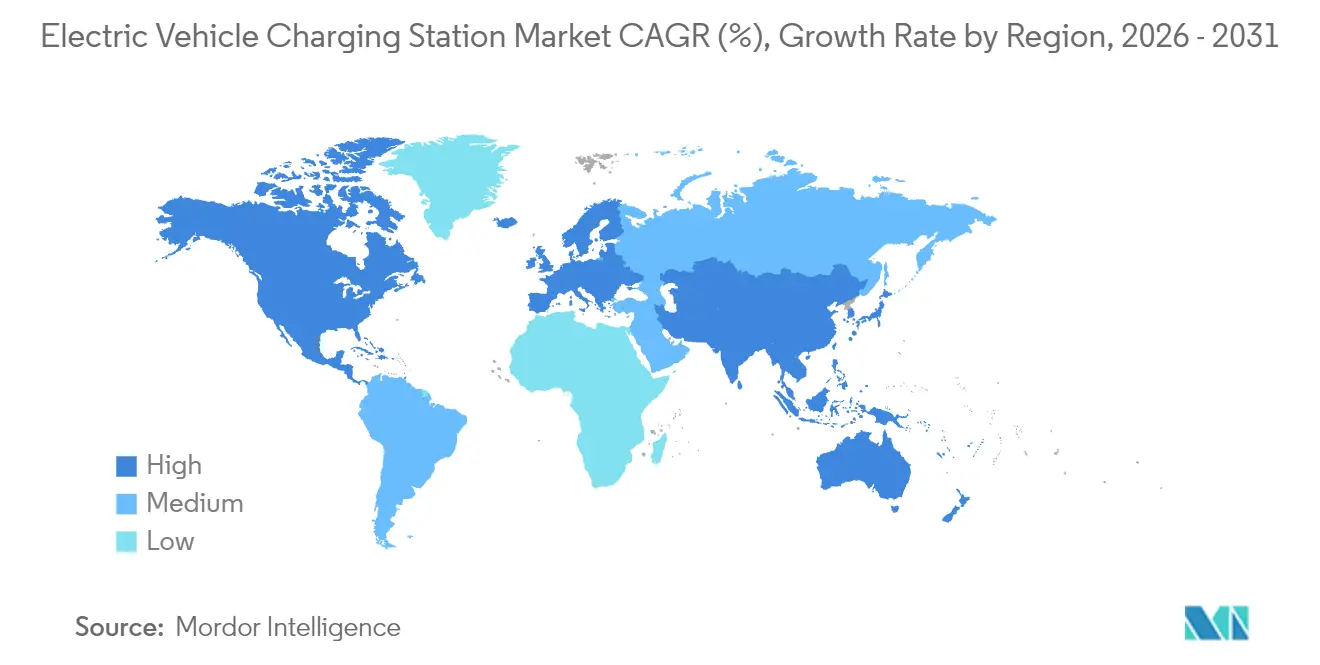
- By region, Asia-Pacific dominated, with 60.10% of the electric vehicle charging station market share in 2025; Europe is forecast to post the fastest CAGR at 40.50% through 2031.
Note: Market size and forecast figures in this report are generated using Mordor Intelligence’s proprietary estimation framework, updated with the latest available data and insights as of 2026.
Market Trends and Insights
Drivers Impact Analysis of Electric Vehicle Charging Station Market*
| Driver | (~) % Point Impact on Market CAGR | Geographic Relevance | Impact Timeline |
|---|---|---|---|
| Government-Backed Zero-Emission Mandates and ICE-Ban Timelines | +4.2% | Global, with Early Gains in EU, California, China | Medium Term (2–4 Years) |
| Falling Battery USD/kWh Driving TCO Parity | +3.8% | Global, Accelerated in North America and Asia-Pacific | Short Term (≤ 2 Years) |
| Global Build-Out of Highway Fast-Charging Corridors | +3.1% | North America and EU Core, Spill-Over to Asia-Pacific | Medium Term (2–4 Years) |
| Surging Fleet-Electrification Commitments from Logistics Giants | +2.9% | Global, Concentrated in Urban Freight Corridors | Long Term (≥ 4 Years) |
| Grid-Services Monetisation (V2G/V2X) Business Models | +2.4% | EU and California Leading, Expanding to Asia-Pacific | Long Term (≥ 4 Years) |
| AI-Optimised Charger Siting Improving Utilisation Rates | +1.8% | North America and EU, Early Adoption in China | Short Term (≤ 2 Years) |
| Source: Mordor Intelligence | |||


Government-backed Zero-emission Mandates and ICE-ban Timelines
Regulatory momentum accelerates charging infrastructure deployment as governments implement binding zero-emission vehicle mandates with specific charging capacity requirements. The EU's Alternative Fuels Infrastructure Regulation mandates that member states increase charging capacity proportionally to EV registrations. At the same time, California's Advanced Clean Fleets Rule requires public and private fleet operators to transition to zero-emission vehicles by sector-specific deadlines. China's National Development and Reform Commission expanded highway service-area charging infrastructure by adding 3,000 charging piles and 5,000 parking spaces in 2024, supporting the country's 40.9% new-energy-vehicle market penetration[1]" China builds world's biggest EV charging network, in stark contrast to US failure", Global Times, globaltimes.cn. Saudi Arabia's commitment to 50,000 charging stations by 2025 and the UAE's target of 50% electric or hybrid vehicles by 2050 extend regulatory pressure to emerging markets. These mandates create predictable demand signals that justify private capital deployment for charging infrastructure, reducing investment risk, and accelerating market expansion [2]"Can the Middle East Achieve its Ambitious EV Goals by 2030?", Telecom Review, telecomreview.com.
Falling Battery USD/kWh Driving TCO Parity
Battery cost reductions are approaching the critical threshold at which electric vehicles achieve total cost-of-ownership parity with internal combustion engines, catalyzing demand for charging infrastructure. Lithium-ion pack prices now edge below USD 100/kWh in leading procurement contracts, helping electric cars reach cost parity with petrol equivalents in usage-heavy segments. Component innovations such as silicon-carbide inverters increase charging efficiency and reduce energy losses, enabling operators to serve more vehicles per installed kilowatt. Cheaper batteries also enable swap-station models that spread capex across fleets, broadening service formats within the electric vehicle charging station industry. The convergence of falling battery costs and improved charging efficiency creates a compounding effect where reduced charging times and lower infrastructure utilization requirements accelerate deployment economics. Commercial fleet operators particularly benefit from this dynamic, as reduced battery costs enable smaller, more frequent charging sessions, optimizing operational flexibility.
Global Build-out of Highway Fast-charging Corridors
Strategic corridor development transforms long-distance EV travel from feasible to convenient, addressing the primary barrier to mass adoption. The United States NEVI Formula Program allocated USD 1 billion annually through 2026, achieving 59.1% coverage of heavily trafficked corridors with fast chargers every 50 miles and projecting 70% coverage by the end of 2025 [3]"Q4 2024 NEVI quarterly update", Joint Office of Energy and Transportation, driveelectric.gov. The formation of strategic alliances, such as the Spark Alliance, which combines over 11,000 charging points across 25 European countries, demonstrates that corridor development requires coordinated industry collaboration rather than individual operator expansion. Corridor development creates network effects in which each additional charging station increases the utility of the entire network, thereby justifying premium pricing and accelerating private investment returns.
Surging Fleet-Electrification Commitments from Logistics Giants
Commercial fleet electrification drives demand for charging infrastructure, with predictable utilization patterns and higher power requirements than those of passenger vehicles. Prologis and Performance Team launched North America's largest heavy-duty EV charging depot near the Ports of Los Angeles and Long Beach, featuring 96 charging stalls with 9 MW capacity and 18 MWh energy storage, capable of charging over 300 electric trucks daily.WattEV opened the world's largest solar-powered truck-charging depot in Bakersfield, California, with megawatt-level charging capabilities, reducing charging time to under 30 minutes for a 300-mile range, supported by USD 5 million in California Energy Commission grants. The North American Council for Freight Efficiency's demonstration showed that transitioning 850 trucks would require approximately 214 MWh of energy per day, highlighting the scale of the infrastructure investment needed for fleet electrification [4]"Scaling BEVs In The Real World", North American Council for Freight Efficiency, nacfe.org. Fleet operators provide anchor tenancy that justifies investment in charging infrastructure, while their operational requirements drive technological advancement in high-power charging systems.
Restraints Impact Analysis of Electric Vehicle Charging Station Market*
| Restraint | (~) % Point Impact on Market CAGR | Geographic Relevance | Impact Timeline |
|---|---|---|---|
| High Upfront CAPEX for More Than 150 kW Chargers | -2.8% | Global, Acute in Emerging Markets | Medium Term (2–4 Years) |
| Uneven Permitting and Utility Interconnection Timelines | -2.1% | North America and EU, Regulatory Complexity | Short Term (≤ 2 Years) |
| Raw-Material Bottlenecks for SiC MOSFETs | -1.9% | Global Supply Chain, China-Dependent | Medium Term (2–4 Years) |
| Cyber-Security Vulnerabilities in Networked Chargers | -1.4% | Global, Critical Infrastructure Focus | Long Term (≥ 4 Years) |
| Source: Mordor Intelligence | |||
High Upfront CAPEX for More Than 150 kW Chargers
Capital expenditure requirements for high-power charging infrastructure create deployment barriers, particularly for independent operators and emerging markets. The P3 Group analysis of European eTruck charging infrastructure forecasts that 45,000 public and 235,000 depot charging points will be needed by 2030, with high initial capital expenditures and lengthy approval processes for grid expansions identified as primary challenges. The California Energy Commission's research demonstrated that DC fast charging stations face significant financing challenges, with potential annual savings of USD 4,300 from demand charge mitigation and USD 4,780 to USD 6,000 from solar integration, both of which are required to improve viability. The deployment of megawatt charging systems, capable of delivering up to 3.75 MW to heavy-duty vehicles, requires substantial electrical infrastructure upgrades that exceed USD 1 million per installation site. High CAPEX requirements particularly constrain deployment in rural and underserved areas, where utilization rates may not justify investment, creating geographic disparities in the availability of charging infrastructure.
Uneven Permitting and Utility Interconnection Timelines
Regulatory complexity and utility interconnection delays increase development costs, create unpredictable timelines, and discourage private investment. The Joint Office of Energy and Transportation identified energization as a key bottleneck and introduced automated tools, fast-track options, and standardized utility training to accelerate EV charging infrastructure development. Federal regulations under 23 CFR 680.106 require qualified technicians to comply with industry standards and cybersecurity measures, adding deployment complexity.
The NEVI Formula Program requires state deployment plans and minimum standards for federally funded projects, including 24/7 public access, secure payment methods, and five-year maintenance commitments, extending approval timelines. In Europe, the Alternative Fuels Infrastructure Regulation creates varying implementation timelines across member states, with some countries struggling to meet the recommended ratios of charging stations to vehicles.
Permitting delays particularly affect corridor development projects, where coordinated deployment across multiple jurisdictions requires synchronized approvals, slowing network expansion.
*Our forecasts treat driver/restraint impacts as directional, not additive. The impact forecasts reflect baseline growth, mix effects, and variable interactions.
Electric Vehicle Charging Station Market Segment Analysis
By Vehicle Type:
Commercial Vehicles Drive Infrastructure ScalingPassenger cars commanded 88.45% of the electric vehicle charging station market share in 2025. Yet, commercial vehicles exhibit the fastest growth, at a 52.20% CAGR through 2031, reflecting the infrastructure requirements of fleet electrification mandates. Buses represent a critical commercial segment in which electrification is accelerating due to urban air quality mandates and predictable route patterns, which enable the optimized deployment of charging infrastructure. Two-wheelers are gaining traction in emerging markets where battery-swapping models prove economically viable, particularly in India. Trucks require the most sophisticated charging infrastructure due to weight constraints and operational demands, driving innovation in high-power charging systems and depot-based solutions.
Commercial vehicle electrification creates anchor demand that justifies charging infrastructure investment, as fleet operators provide predictable utilization patterns and higher power requirements than passenger vehicles. CharIN officially launched the Megawatt Charging System at EVS35 in Oslo, establishing standards for charging capacities up to 3.75 MW, enabling commercial vehicles to achieve operational parity with diesel counterparts. Passenger car infrastructure benefits from commercial vehicle deployment as shared charging corridors reduce per-unit infrastructure costs and improve network utilization rates across vehicle categories.


By Charger Type:
Ultra-fast Charging Reshapes Power DistributionDC charging stations maintained 77.95% of the electric vehicle charging station market share in 2025, while it accelerated at 53.10% CAGR during the forecast period, driven by operator strategies to reduce charging session duration and increase throughput. Oak Ridge National Laboratory achieved a breakthrough in wireless charging technology, demonstrating 100-kW power transfer to passenger vehicles with 96% efficiency across a five-inch air gap, potentially disrupting traditional connector-based charging. AC charging below 22 kW primarily serves residential and workplace applications, where longer dwell times accommodate slower charging speeds while maintaining cost advantages for installations with lower utilization requirements. The emergence of megawatt charging systems for commercial vehicles creates a distinct ultra-high-power category that requires specialized electrical infrastructure and cooling systems. The expansion of high-power DC charging infrastructure is also driving demand across the EV charging cables market, particularly for specialized cables capable of supporting higher current levels and faster charging speeds.
SAE International published new standards for wireless light-duty EV charging, including the Differential Inductive Positioning System that enables cross-compatibility among different suppliers' hardware with up to 93% efficiency. Wireless charging technology addresses user convenience concerns and reduces infrastructure maintenance requirements by eliminating physical connectors that experience wear and vandalism. The transition toward higher-power charging systems reflects operator economics. Reduced charging times enable higher station utilization and improved return on investment, particularly in high-traffic locations where land costs justify premium charging speeds.
By Ownership Model:
Public Infrastructure Dominance PersistsPublic ownership models captured 67.55% of the electric vehicle charging station market share in 2025 with 27.40% CAGR, reflecting government investment programs and the need for accessible charging networks that serve multiple vehicle brands and user types. Private residential charging addresses most daily charging needs for passenger vehicle owners, while private fleet/workplace charging serves commercial applications with predictable usage patterns and higher utilization rates. The NEVI Formula Program specifically targets public charging infrastructure along designated corridors, requiring 24/7 access and compatibility with multiple payment methods to ensure broad accessibility. Public-private partnerships emerge as a preferred model in which government funding reduces private investment risk while leveraging private-sector operational expertise and efficiency.
The formation of charging alliances, such as the Spark Alliance in Europe, shows how private operators coordinate to create publicly accessible networks that compete with government-funded infrastructure. Private fleet charging increasingly incorporates smart charging and energy management systems that optimize electricity costs and grid integration, creating operational advantages that justify private investment over public alternatives.
By Installation Site:
Highway Corridors Drive Premium ChargingDestination/retail installations commanded 43.05% of the electric vehicle charging station market share in 2025, while highway/transit locations exhibited a 44.10% CAGR, reflecting the strategic importance of corridor charging for enabling long-distance travel. Home charging meets most daily charging needs for passenger vehicle owners, but public infrastructure development focuses on locations where home charging is unavailable or insufficient to meet travel needs. Fleet depot installations require specialized high-power charging systems and energy management capabilities that optimize operational costs and grid integration.
The concentration of charging infrastructure at retail destinations creates synergies when charging session durations align with shopping or dining activities, improving user experience and site economics.BP signed agreements with Simon Property Group to install over 900 charging bays at 75 locations, targeting high-demand retail environments where charging sessions complement consumer activities. Highway/transit charging requires ultra-fast charging capabilities to minimize travel delays, driving the deployment of 350 kW+ systems that enable 80% battery charging in 15-20 minutes. Pilot Travel Centers' partnership with GM and EVgo demonstrates how the integration of charging infrastructure with existing travel amenities creates operational efficiencies and improves user adoption rates.
By Connector Standard:
NACS Adoption Accelerates StandardizationCCS maintained 35.95% market share in the electric vehicle charging station market in 2025, while wireless charging exhibited a 37.90% CAGR as technology maturation and standardization efforts reduced deployment barriers. Tesla's North American Charging Standard gained momentum as Ford, GM, and other manufacturers adopted NACS connectors, potentially creating a unified EV charging connector ecosystem that reduces infrastructure complexity. CHAdeMO remains prevalent in Asian markets, particularly in Japan, but is seeing declining adoption in Western markets as CCS and NACS gain preference among automakers and infrastructure operators. GB/T primarily serves the Chinese market, where government standards mandate compatibility, while wireless charging is emerging as a premium option for applications where convenience justifies higher costs.
ChargePoint introduced the Omni Port adaptable charging connector that accommodates various connector types for both Tesla and non-Tesla vehicles, eliminating the need for adapters and simplifying the user experience. The development of universal plug-and-charge protocols, launched in 2025 through collaboration among SAE, automakers, and charging operators, enables secure, automated authentication and billing across different connector standards. Wireless charging standardization through SAE International's Differential Inductive Positioning System enables supplier interoperability and achieves 93% efficiency, potentially reducing reliance on physical connectors in specific applications.
Geography Analysis
APAC Electric Vehicle Charging Station Market
Asia-Pacific leads the electric vehicle charging station market with a 60.10% share in 2025, supported by China’s 12.82 million public connectors and a 25% annual installation increase. National programs now equip 6,000 highway service areas, ensuring long-distance coverage mirrors the country’s 40.9% new-energy vehicle sales mix. Japan pioneers megawatt systems for heavy trucks, while India’s two-wheeler battery-swapping hubs show how low-cost mobility needs can accelerate charger density. South Korea is positioning itself as an alternative battery-material supplier amid trade tensions, and Australia funds remote-area corridor sites to bridge its vast intercity distances.
Europe Electric Vehicle Charging Station Market
Europe shows the fastest regional growth, at a 40.50% CAGR through 2031. The Spark Alliance integrates 11,000 high-power connectors across 25 countries, offering transparent pricing and 100% renewable electricity. Germany’s plan for more than 1 million new charging points by 2030 aligns with EU regulations that tie infrastructure quotas to EV registrations. Norway retains the world’s highest per-capita charger count, while France uses low-interest loans to spur private deployments. UK policy bans sales of most new petrol cars from 2035 and now mandates payment-card interoperability at public chargers, further strengthening consumer confidence.
North America Electric Vehicle Charging Station Market
North America accelerates through the NEVI Formula’s USD 5 billion funding, enabling 204,000 public ports. The seven-automaker IONNA venture will add 30,000 high-power connectors, and the retrofitting of Tesla Superchargers for multi-brand use could generate USD 6-12 billion in additional revenue by 2030. Cross-industry alliances link charging to retail amenities, mirroring European service-station strategies.

Competitive Landscape
Competition intensifies as oil majors, utilities, and tech firms converge on the electric-vehicle charging-station market. Tesla still operates roughly one-third of the United States' public fast chargers, yet its relative dominance is challenged by IONNA and ChargePoint's expansions. In Europe, the Spark Alliance creates immediate scale advantages that raise the bar for standalone networks.
Shell’s closure of 1,000 petrol stations in 2024 underscored its strategic shift from liquid fuels toward electrons. ABB E-mobility’s 2025 launch of the MCS1200 megawatt charger and modular ChargeDock targeted 99% uptime, signaling that reliability had become a key differentiator. Siemens, Schneider Electric, and Eaton are integrating bidirectional inverters and onsite storage to secure utility tenders that require grid-service compatibility.
Fragmentation persists, particularly in China, where state-owned enterprises and startups vie for municipal contracts. However, cross-licensing of connector patents and joint purchasing of silicon-carbide components suggest that consolidation economics are taking hold. Cybersecurity readiness has emerged as a selection criterion following Southwest Research Institute's demonstration of plaintext vulnerabilities in several fast-charger models. Operators that pass rigorous penetration tests secure priority positions in fleet-procurement frameworks.
Electric Vehicle Charging Station Industry Leaders
-
Tesla Inc.
-
ABB Ltd.
-
ChargePoint Inc.
-
Siemens AG
-
BYD Motors Inc.
- *Disclaimer: Major Players sorted in no particular order
Electric Vehicle Charging Station Market Companies Covered in this Report
- ABB Ltd.
- ChargePoint Inc.
- Tesla Inc.
- Siemens AG
- Schneider Electric Corporation
- Shell Plc.
- ENGIE SA (EVBox)
- BYD Motors Inc.
- Tritium Charging Inc.
- Blink Charging o.
- Delta Electronics Inc.
- Kempower Oyj
- Electrify America, LLC
- IONITY GmbH
- Leviton Manufacturing Co. Inc.

Recent Industry Developments in Electric Vehicle Charging Station Market
- August 2026: The EVgo Flagship Charging Station opened in the parking lot of a Meijer store in Warren, Michigan. The station is part of EVgo's partnership with General Motors.
- August 2026: The Maharashtra government announced plans to establish electric vehicle (EV) charging facilities at MSRTC depots and Regional Transport Offices (RTOs) across the state. The government is also considering setting up EV charging stations at flyovers across the state under a public-private partnership (PPP) model.
- July 2026: ChargePoint partnered with Optimus Energy Solutions to deploy more than 200 public charging ports in the Southeastern United States. The tie-up expands ChargePoint's footprint through a regional developer model and supports faster site replication across retail and corridor locations.


Electric Vehicle Charging Station Market Report Scope and Research Methodology
Market Definition and Coverage
This market covers revenue generated from electric vehicle charging stations and related charging infrastructure used to recharge plug-in vehicles, across public and private deployments. We treat the market as the combined value of charging hardware and the associated charging service activity captured at the station level.
Scope exclusions: It excludes vehicle sales and grid generation assets, and it does not count non-charging energy equipment that is not installed for EV charging use.
Segments Covered in This Report
-
By Vehicle Type
- Passenger Cars
- Commercial Vehicles
- Buses and Coaches
-
By Charger Type
- AC Charging Station
- DC Charging Station
-
By Ownership Model
- Public
- Private – Residential
- Private – Fleet/Workplace
-
By Installation Site
- Home
- Destination/Retail
- Highway/Transit
- Fleet Depot
-
By Connector Standard
- CCS (Combined Charging System)
- CHAdeMO
- GB/T
- Tesla NACS
- Wireless
-
By Geography
-
North America
- United States
- Canada
- Rest of North America
-
South America
- Brazil
- Chile
- Rest of South America
-
Europe
- Germany
- United Kingdom
- France
- Norway
- Italy
- Spain
- Netherlands
- Poland
- Austria
- Russia
- Rest of Europe
-
Asia-Pacific
- China
- Japan
- India
- South Korea
- Indonesia
- Vietnam
- Philippines
- Australia
- New Zealand
- Rest of Asia-Pacific
-
Middle East and Africa
- Saudi Arabia
- United Arab Emirates
- Egypt
- Turkey
- South Africa
- Rest of Middle East and Africa
-
North America
Data Sources, Market Sizing, and Validation
Desk Research
Desk work starts with building a clean fact base on EV parc, charging points installed, and rollout targets, then matching those inputs to charging utilization and pricing signals. We leaned on public sources such as IEA Global EV Outlook series, national transport and energy department releases, national charging registries where available, and standards bodies notes on connector and charging formats.
To keep the model grounded, we also reviewed company filings and investor decks from charging network operators, utilities, and equipment suppliers, along with association websites and reputed press coverage of corridor programs and incentive schemes. For cross-checking financial direction and patenting activity, we used paid subscriptions for company financial intelligence and patent databases, mainly to validate timelines and product mix rather than to source the final totals. These examples are illustrative only, and many other sources were also referred to for data collection, validation, and clarification during the work.
Primary Interviews and Surveys
Primary inputs were collected through expert interviews and structured surveys with charging network operators, charge point installers, equipment distributors, fleet and depot charging managers, and public sector stakeholders involved in deployment programs. The fieldwork was kept global across APAC, EMEA, and the Americas so adoption patterns, utilization, and pricing behaviors could be compared, and then used to tighten assumptions where desk sources were thin.
Distribution of primary research fieldwork respondents
| Company type | Respondent position | Region |
|---|---|---|
| Top tier: 35% | CXOs: 14% | APAC: 48% |
| Mid tier: 51% | Functional/Unit leaders: 34% | EMEA: 30% |
| Smaller Players: 14% | Managers: 52% | Americas: 22% |
Market-Sizing & Forecasting
Sizing is built using a top-down demand pool reconstruction where EV parc growth, public versus private charger mix, and charging sessions per charger are translated into annual energy delivered and charging events, followed by revenue conversion through typical tariffs and service fees. Once that core structure is built, selective bottom-up approximations are used to test reasonableness, including sampled charger shipments by type, average selling price ranges for AC versus DC units, and roll-ups from installer and operator revenue disclosures in key countries.
A few market fingerprints keep the model stable across regions, namely installed charging points by type (AC, DC), utilization and uptime trends, corridor program milestones, and the share of fast charging in public networks. Inputs also include capital cost direction for hardware, typical commissioning lead times, and the split between charging services and battery swapping where it is present. Where gaps exist in country level data, we apply proxy penetration rates using comparable EV adoption and policy intensity, and then re-check with interview feedback before locking the assumption.
Forecasts are produced using scenario analysis with an explicit link to EV sales and parc outlook, charger deployment targets, and expected utilization ramp, and then are stress-tested for price changes in charging tariffs and equipment ASP movement. The final path is accepted only after it can be explained through a small set of repeatable drivers that a client can follow step by step.
Data Validation & Update Cycle
Validation is done through multiple checks, where model totals are compared against independent signals like installed charging points, public funding rollouts, and observed utilization ranges reported by operators and regulators. If an output looks out of line, the assumption is traced back to its driver, then reworked, followed by a second review pass before sign-off.
Reports are refreshed annually, and interim updates are triggered when material events occur, such as major policy shifts, step changes in tariff structures, or large deployment program announcements. Before delivery, an analyst performs a fresh pass of key inputs and currency conversions so the latest market context is reflected in the final numbers clients receive.
Mordor Intelligence's Electric Vehicles Charging Stations Market Sizing Compared With Other Published Estimates
Published estimates for EV charging stations often differ because teams pick different boundaries, time their currency conversion differently, and apply different pricing logic for hardware versus charging services. Even when the year label matches, the underlying mix of AC and DC, public and private networks, and service revenues can shift the total.
A common gap driver is how average selling prices and tariffs are carried forward. Some studies assume a smooth decline in hardware ASPs or a fast rise in public fast-charging prices without re-checking utilization and uptime. Another driver is refresh cadence, where older assumptions on deployment targets or policy incentives linger after real-world rollout bottlenecks show up. This is why the model is re-validated close to publication using updated FX timing and utilization checks, a step applied by Mordor Intelligence.
Benchmark comparison
| Source | Market Size | Gaps in Research Methodology |
|---|---|---|
| Mordor Intelligence | USD 46.13 B (2025) | |
| Global Consultancy A | USD 40.22 B (2025) | This estimate leans more toward charging infrastructure revenue treatment and can undercount service-side revenue capture in markets where tariffs and utilization ramp faster than installations. |
| Industry Analytics B | USD 50.70 B (2025) | The higher value can be explained by broader inclusions around station ecosystem components and more aggressive near-term pricing and utilization assumptions, which can lift totals when not rechecked against uptime and commissioning timing. |
The spread across sources is mainly explained by how each study treats service revenue, the pace of ASP and tariff changes, and the timing of updates for deployment reality. By keeping the market boundary explicit and tying each step back to installed base, utilization, and price logic, the final estimate stays traceable and repeatable for planning.


Key Questions Answered in the Report
What is the current size of the electric vehicle charging station market?
The electric vehicle charging station market generated USD 36.13 billion in 2025 and is projected to reach USD 112.55 billion by 2031.
What is the market size in 2026?
In 2026, the Electric Vehicle Charging Station Market size is expected to reach USD 43.66 billion.
How fast is the European market growing?
Europe records the highest regional CAGR at 40.50% through 2031, driven by cross-border alliances such as the Spark Alliance.
Why are commercial vehicles important for charger demand?
Commercial fleets grow at a 52.20% CAGR because predictable, high-power charging cycles make depot and corridor infrastructure financially attractive.
What are the main barriers to fast-charger roll-out?
High site capex, protracted permitting, silicon-carbide semiconductor shortages, and cybersecurity concerns collectively drag on deployment momentum.
Page last updated on:


 Your data is secure and never sold or shared.


