
Gyroscopes Market Size and Share
Market Overview
| Study Period | 2020 - 2031 |
|---|---|
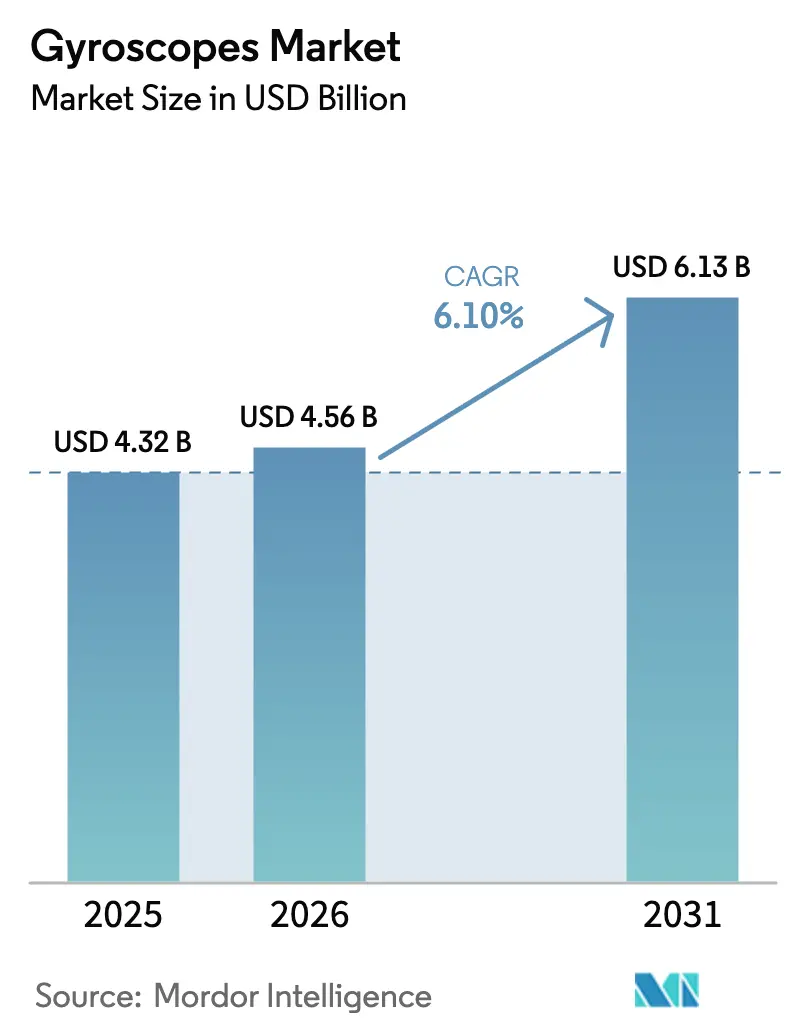
| Market Size (2026) | USD 4.56 Billion |
| Market Size (2031) | USD 6.13 Billion |
| Growth Rate (2026 - 2031) | 6.10% CAGR |
| Fastest Growing Market | Asia Pacific |
| Largest Market | Asia Pacific |
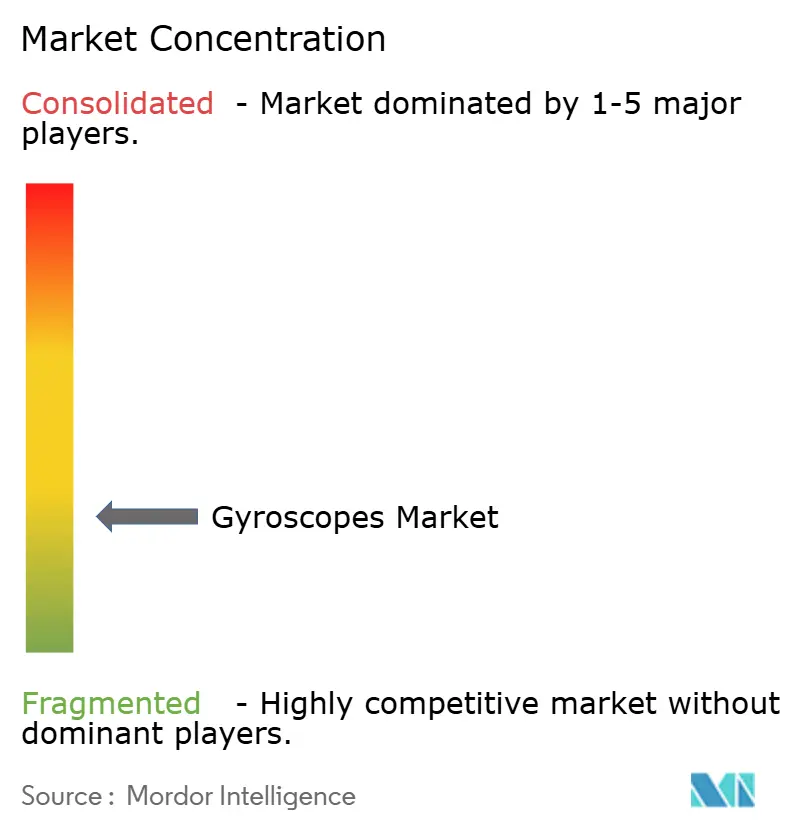
| Market Concentration | Low |
Major Players *Disclaimer: Major Players sorted in no particular order Image © Mordor Intelligence. Reuse requires attribution under CC BY 4.0. | |
Gyroscopes Market Analysis by Mordor Intelligence
The gyroscopes market size is expected to increase from USD 4.32 billion in 2025 to USD 4.56 billion in 2026 and reach USD 6.13 billion by 2031, growing at a CAGR of 6.10% over 2026-2031. Demand is steadily shifting away from volume-driven consumer devices toward precision-oriented deployments in advanced driver assistance, defense navigation, and industrial automation, all of which demand tighter drift, higher bias stability, and multi-sensor fusion. MEMS miniaturization has advanced to the point where sub-degree accuracy is feasible in wafer-level chip-scale packages, opening doors that were once controlled by bulky ring-laser or fiber-optic platforms. Regional manufacturing synergies, particularly in Asia-Pacific, support high-volume output, while North American and European firms continue to set performance and certification benchmarks. Market concentration remains low, yet photonic integrated circuit start-ups are challenging incumbents on cost-to-precision ratios. Strategic bottlenecks in specialty optical fiber and high-Q resonator materials add supply risk but also encourage vertical integration.
Key Report Takeaways
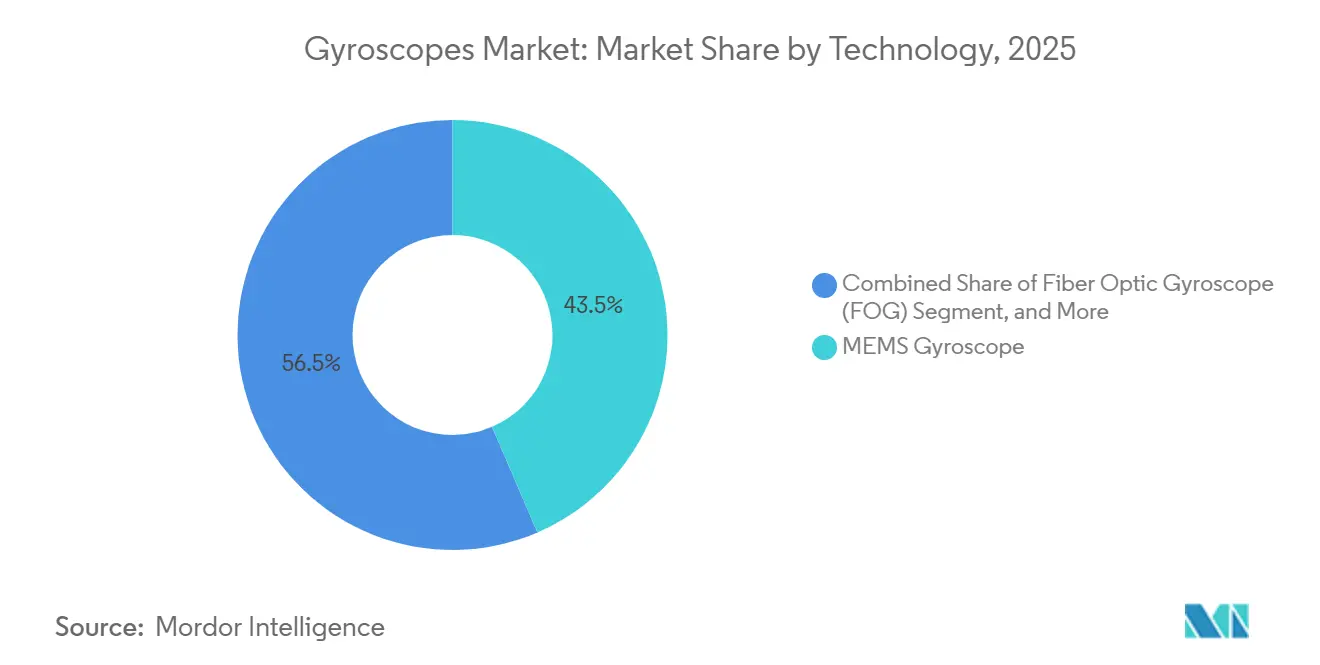
- By technology, MEMS held 43.53% of the gyroscopes market share in 2025, while fiber-optic devices are tracking a 7.85% CAGR through 2031.
- By axis configuration, 3-axis units led with 55.53% revenue in 2025; 2-axis devices are expanding at a 7.92% CAGR to 2031.
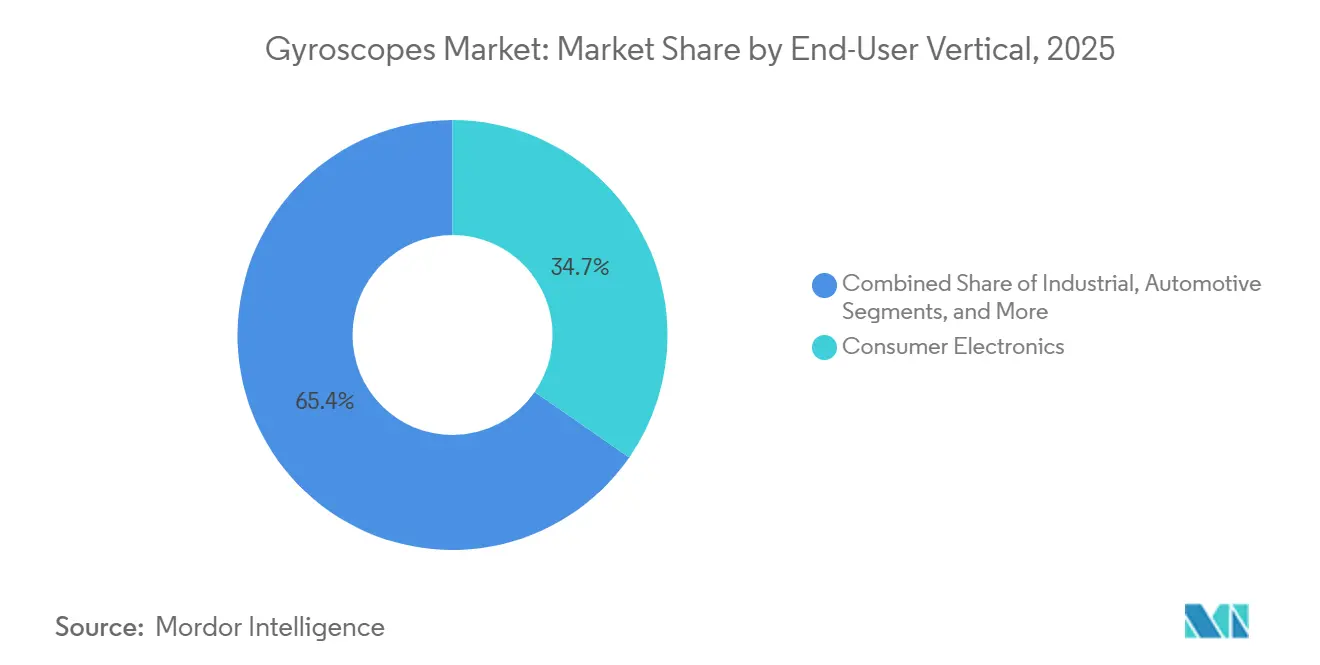
- By end-user, consumer electronics retained a 34.65% share in 2025, whereas industrial use is advancing at an 8.21% CAGR through 2031.
- By application, navigation systems captured 35.75% of the gyroscopes market in 2025, and gaming or virtual reality is growing at an 8.01% CAGR through 2031.
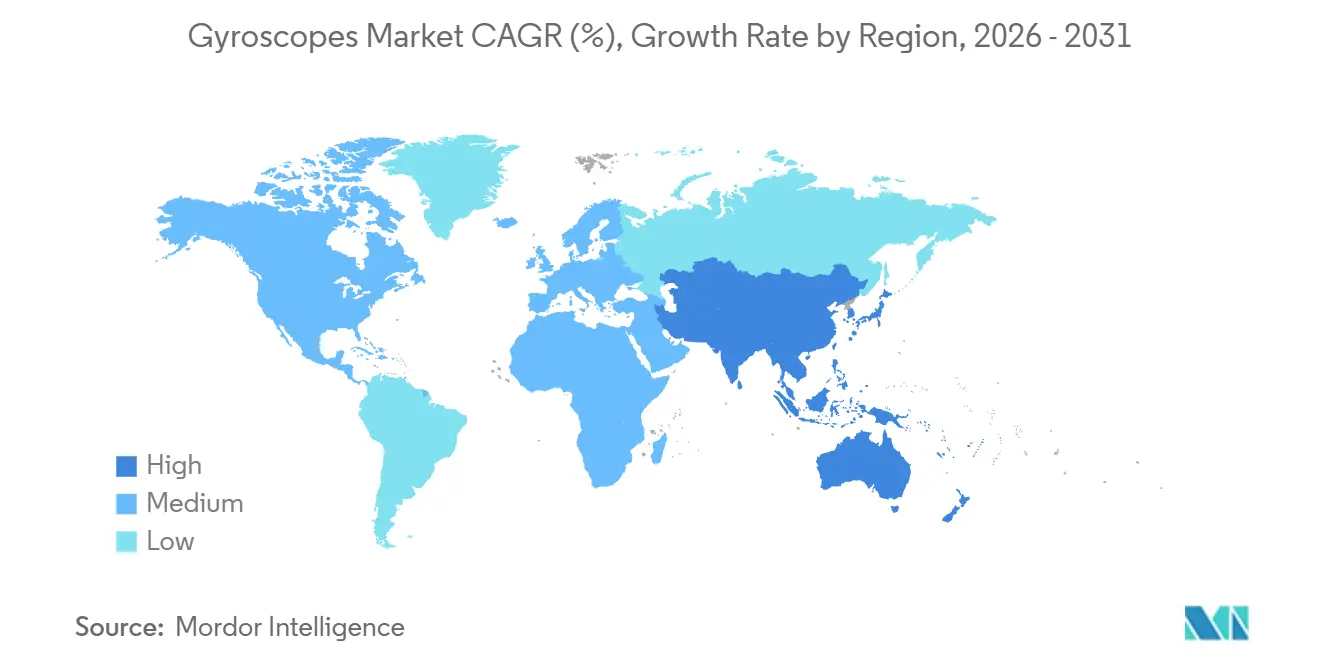
- By region, Asia-Pacific commanded a 40.42% share of the gyroscopes market in 2025 and is projected to grow at an 8.45% CAGR through 2031.
Note: Market size and forecast figures in this report are generated using Mordor Intelligence’s proprietary estimation framework, updated with the latest available data and insights as of January 2026.
Global Gyroscopes Market Trends and Insights
Drivers Impact Analysis*
| Driver | (~) % Impact on CAGR Forecast | Geographic Relevance | Impact Timeline |
|---|---|---|---|
| Proliferation of MEMS Sensors in Smartphones and Wearables | +1.2% | Global, with APAC manufacturing concentration | Short term (≤ 2 years) |
| Automotive ADAS and Autonomous Driving Demand | +1.8% | North America and Europe leading, APAC following | Medium term (2-4 years) |
| Defense Modernization Programs in Emerging Economies | +1.0% | Middle East, Asia-Pacific, Eastern Europe | Long term (≥ 4 years) |
| Rapid Expansion of Commercial Drone Applications | +0.9% | Global, with regulatory leadership in North America and Europe | Medium term (2-4 years) |
| Cost Decline in Fiber-Optic and Ring-Laser Gyroscopes | +0.7% | Global, concentrated in defense and aerospace hubs | Long term (≥ 4 years) |
| Emergence of Quantum-Enhanced Inertial Navigation | +0.4% | North America, Europe, select APAC research centers | Long term (≥ 4 years) |
| Source: Mordor Intelligence | |||
Proliferation of MEMS Sensors in Smartphones and Wearables
Six-axis MEMS hybrids are now shipping in flagship handsets and premium wearables, delivering sub-degree accuracy and a 40% reduction in footprint, which helps device makers maintain slim form factors without sacrificing motion fidelity.[1]STMicroelectronics, “ISM330BX Six-Axis IMU Datasheet,” st.com Closed-loop digital architectures reduce power draw while maintaining bias drift below 1°/h, enabling consumer suppliers to approach tactical-grade thresholds. Medical wearables add a new revenue tier that values low drift for FDA-approved patient monitoring. The result is a steady funnel of high-volume orders that anchors base demand, even as premium applications set loftier performance bars.
Automotive ADAS and Autonomous Driving Demand
Level 3 and Level 4 autonomy requires multi-sensor redundancy; thus, modern inertial modules must reach bias stability better than 10°/h, angular random walk below 0.1°-√h, and functional-safety diagnostics per ISO 26262.[2]Analog Devices, “High-Performance Inertial Sensors,” analog.com Electric vehicles further lean on precise rate feedback to optimize regenerative braking. Over-the-air calibration and self-test capabilities have become must-haves, giving suppliers that bundle MEMS gyros with on-board processors a competitive edge.
Defense Modernization Programs in Emerging Economies
New procurement cycles in India, Brazil, and Turkey are prioritizing indigenous inertial navigation systems for drones, guided munitions, and soldier systems. Specifications often require fiber-optic or ring-laser gyroscopes with bias instability of less than 1°/h and immunity to electromagnetic interference, favoring suppliers who can transfer technology without encountering export licensing hurdles. The appetite for local production creates joint-venture openings but also raises certification hurdles.
Rapid Expansion of Commercial Drone Applications
Precision agriculture, line inspection, and logistics drones now require gyros that maintain attitude accuracy through rapid altitude and temperature swings. ISO 24354-2023 mandates vibration tolerance and hot-swap capability, prompting MEMS manufacturers to ruggedize their designs.[3]ISO, “ISO 24354:2023 Payload Interface for Civil UAS,” iteh.ai Sensor-synchronized swarms benefit from built-in timing references, and urban air-mobility prototypes seek low-latency sensor fusion to navigate GPS-denied corridors, broadening the gyroscopes market footprint.
Restraints Impact Analysis*
| Restraint | (~) % Impact on CAGR Forecast | Geographic Relevance | Impact Timeline |
|---|---|---|---|
| High Manufacturing Complexity for High-Accuracy Gyroscopes | -1.4% | Global, concentrated in precision manufacturing hubs | Medium term (2-4 years) |
| Supply-Chain Volatility in Specialty Optical Fibers and ICs | -0.8% | Global, with acute impact in Asia-Pacific | Short term (≤ 2 years) |
| Certification Barriers in Aviation and Medical Markets | -0.6% | North America and Europe leading, global regulatory spillover | Long term (≥ 4 years) |
| Competition from Vision and GNSS-INS Hybrid Solutions | -0.5% | Global, with advanced markets leading adoption | Medium term (2-4 years) |
| Source: Mordor Intelligence | |||
High Manufacturing Complexity for High-Accuracy Gyroscopes
Fiber-optic builds require optical fibers with a loss of ≤ 0.5 dB/m, while ring-laser cavities demand nanometer-grade machining, resulting in steep capital outlays and slow throughput. MEMS designs that aim for navigation-grade stability require vacuum wafer-level packaging and multi-point temperature compensation, lengthening production cycles and payback periods. Extended burn-in testing, which can sometimes last weeks, caps monthly volume and increases unit cost.
Supply-Chain Volatility in Specialty Optical Fibers and ICs
A handful of suppliers dominate the high-purity fiber and analog-to-digital converter markets. Telecom upswings or semiconductor shortages divert capacity, stretching lead times for gyroscope integrators. Rare-earth magnets and specialty glass compounds are geographically concentrated, so trade friction can cause material prices to spike suddenly, forcing OEMs to dual-source or near-shore at a higher cost.
*Our forecasts treat driver/restraint impacts as directional, not additive. The impact forecasts reflect baseline growth, mix effects, and variable interactions.
Segment Analysis
By Technology: MEMS Dominance Faces Precision Challenge
MEMS devices accounted for 43.53% of the gyroscopes market share in 2025, a lead built on low cost and seamless SoC integration for phones, wearables, and cars. Fiber-optic designs, though pricier, are growing at a 7.85% CAGR as defense and aerospace buyers seek bias instability below 0.01°/h, a tolerance MEMS still rarely meet. Ring-laser and hemispherical resonator models protect smaller niches, such as high-g munitions and long-life satellites, where single-restart reliability outweighs bill-of-materials savings. Photonic integrated circuit prototypes have now logged less than 1°/h drift on footprints under 5 cm², hinting that chip-scale optics could soon bridge MEMS and fiber cost-to-precision gaps. MEMS engineers answer with cobweb-style disk resonators and multi-bit sigma-delta readouts, which have pushed bias noise toward navigation thresholds.
As hybrid stacks emerge, vendors that master both piezoelectric and photonic steps will control the most defensible intellectual property. Licensing paths are opening in the Asia-Pacific region, where fabs can co-package CMOS and optical waveguides, promising lower entry barriers for regional brands. Overall, the technology choice is shifting from a binary MEMS-versus-optics argument to a continuum of precision tiers that enable integrators to match cost, size, and environmental limits without switching suppliers mid-program.



By Axis: Multi-Axis Integration Drives Complexity
Three-axis chips captured 55.53% of 2025 revenue because phones, VR headsets, and full IMUs demand complete pitch-roll-yaw telemetry in a single die. Two-axis units nevertheless achieve the fastest 7.92% CAGR because automakers require only pitch and roll for electronic stability control and are cost-sensitive regarding yaw redundancy. Single-axis parts, once mainstream, now linger in high-speed spindles or scientific rigs where cross-axis coupling is unacceptable. Packaging advances enable a 3-axis MEMS to occupy the same board area as an older single-axis device, yet each axis still reacts differently to temperature. Therefore, vendors embed EEPROM calibration curves and on-die heaters to maintain drift parity. ISO 26262 diagnostics now monitor each axis separately, forcing firmware to flag latent faults before they trigger unstable vehicle dynamics.
In gaming, matched-axis latency tightens user comfort thresholds, pushing makers to align bandwidth and phase to the millisecond. Industrial buyers add vibration-hardening epoxy fill or ceramic carriers to stop resonance peaks that would otherwise amplify z-axis noise. As sensor-fusion processors mature, design wins increasingly hinge on how predictably each channel maintains linearity throughout the product’s life, rather than on the number of axes.
By End-User Vertical: Industrial Automation Accelerates
Consumer electronics dominated spending with 34.65% in 2025, but factory automation and robotics are pacing an 8.21% CAGR, a trend that widens the market size allocated to industrial OEMs. Collaborative robots weld, pick, and palletize with sub-degree orientation loops that tolerate eight-hour duty cycles, so buyers specify bias drift under 0.5°/h and vibration immunity past 2 kHz. Aerospace and defense continue to fund navigation-grade roadmaps, while marine surveyors demand hermetically sealed resonator units that survive salt fog and pressure cycling for years. Internet-of-Moving-Things trackers require less than 1 mW draw yet must hold heading in -40 °C to +85 °C swings, stretching process windows for temperature coefficient control.
Car OEMs are pushing over-the-air recalibration, allowing fleet software patches to realign IMUs without requiring dealer visits, thereby reinforcing the shift toward software-defined vehicles. Agricultural implement makers adopt tactical-grade gyros to level autonomous harvesters on uneven terrain, a frontier application that also values rugged IP-rated housings. Meanwhile, consumer brands continue to press for thinner, cheaper SKUs, driving wafer-level chip-scale packaging and 6-axis combinations that blend gyro and accelerometer dies. This demand dichotomy forces suppliers to fragment their product lines, pairing high-volume consumer fabs with smaller, tightly controlled tactical lines to maintain aerospace certifications.
By Application: Gaming Disrupts Navigation Dominance
Navigation systems retained 35.75% of 2025 revenue and anchor gyroscopes' market share across aircraft, ships, and strategic missiles; however, gaming and VR are growing at an 8.01% CAGR due to metaverse platform rollouts. Headset designers aim for latency under 1 ms and drift below 0.05°/min to maintain a stable virtual scene, thereby narrowing the performance gap with avionics. Drone gimbals utilize embedded IMUs to cancel vibration at up to 2 kHz, which is essential for 4K photogrammetry and LiDAR mapping. In contrast, inspection robots require repeatable heading in GPS-denied tunnels. Industrial automation lines rely on gyroscopes inside servo loops to stabilize robotic arms, thereby boosting first-pass yield in precision assembly.
Consumer smartphones, although flat in unit growth, still see volumes that amortize MEMS R&D across pricier niches. Autonomous delivery vehicles layer gyro data onto camera and radar feeds to keep parcels steady over potholes, a use case that favors 6-axis closed-loop MEMS. Finally, soldier-worn navigation kits blend gyros with magnetometers to track dismounted troops in urban canyons, underscoring how application diversity cushions the market from downturns in any single sector.
Geography Analysis
The Asia-Pacific region controlled 40.42% of the 2025 turnover, driven by semiconductor clustering in China, Japan, and South Korea, as well as India’s push for localized defense electronics. The region also posts the fastest 8.45% CAGR, a testament to domestic ecosystems that cover foundry services, packaging, and downstream system integration. Factory expansions in Taiwan and Malaysia promise additional MEMS capacity, but the same projects also increase local demand for high-purity precursor gases and lithography tooling, thereby gradually deepening the supply chain.
North America remains influential through its defense budgets, autonomous vehicle pilots, and a concentration of photonics start-ups. The Federal Aviation Administration’s TSO compliance templates elevate barrier costs, indirectly steering procurement toward incumbents familiar with paperwork. Parallel reshoring programs in New York and Arizona aim to rebuild the critical MEMS supply chain but face labor and utility-rate headwinds that may limit near-term throughput.
Europe emphasizes automotive ADAS and industrial cobots, benefitting from cohesive ISO and UNECE regulations that harmonize sensor testing. The Middle East and Africa, although small in volume, channel oil revenues into defense modernization and smart infrastructure projects that require precise inertial references for drones inspecting pipelines or bridges. Latin America, led by Brazil, eyes indigenous production in line with offsets tied to fighter and satellite contracts, spreading the gyroscopes market into fresh jurisdictions.

Regulatory Landscape
Gyroscope requirements are shaped by a combination of international functional-safety and sector certification regimes, alongside national standards. In automotive and industrial use cases, compliance pressure centers on ISO 26262-aligned diagnostics and traceability expectations for motion sensors used in safety-related control loops. Aviation programs add documentation and qualification burdens via FAA TSO-style compliance templates, which raises barriers for new entrants.
China has moved to formalize performance definitions and test expectations through national standards, including GB/T 42597-2023 for MEMS gyroscopes (effective September 1, 2023) and GB/T 47121-2026 for optical gyroscope angle sensors (issued by the State Administration for Market Regulation and the Standardization Administration of China, effective in 2026). Trade and security rules also affect sourcing and go-to-market decisions: US import classification for MEMS gyroscope sensors (HTS 8543.70.98.60) carries a base MFN duty of 2.6% with an additional surcharge on China-origin goods, and China export controls can require MOFCOM dual-use export licensing for gyroscope-stabilized platforms under HS 9014.20.90.13. This reinforces compliance-led supplier qualification and regionalized supply chains for higher-end inertial products.
Value Chain Analysis
The gyroscopes value chain begins with specialized inputs, including silicon wafers, piezoelectric materials, high-purity specialty optical fiber, rare-earth magnets, and precision glass and resonator materials, along with upstream equipment such as deep reactive-ion etching and high-vacuum packaging tools for navigation-leaning MEMS designs. Manufacturing diverges by technology: high-volume MEMS production leans on wafer fabrication and wafer-level chip-scale packaging ecosystems concentrated in Asia-Pacific, while fiber-optic and other high-accuracy architectures rely on photonics-grade components and precision assembly capabilities that are more geographically clustered and qualification intensive.
In the midstream, sensor makers integrate ASICs, calibration firmware, and packaging (ceramic, hermetic, or chip-scale) into IMUs and inertial modules, then sell through OEMs and tier suppliers serving consumer electronics, automotive, industrial automation/robotics, aerospace and defense, and marine navigation. The chain is also shaped by partnering and multi-axis integration, as shown by Silicon Sensing Systems partnering with Kongsberg Discovery (June 2025) to co-develop navigation-grade MEMS gyroscope technology, aligning component development with downstream navigation product platforms, and by Murata expanding its 6DoF inertial portfolio with SCH16T-series releases across 2025. Bottlenecks remain concentrated in specialty optical fiber and high-precision analog IC availability, and in access to controlled process equipment for vacuum packaging and DRIE, which can be constrained by export-control regimes and long lead times.
Competitive Landscape
Market concentration remains low. Honeywell and Bosch capitalize on certified manufacturing lines spanning MEMS and fiber-optic products, leveraging deep qualification data to secure multi-year defense and automotive contracts. STMicroelectronics and TDK InvenSense dominate consumer volumes by pairing MEMS gyroscopes with accelerometers on a single die, leveraging economies of scale.
Analog Devices combines delta-sigma converters and Kalman-filter DSP cores inside its iSensor modules, selling a drop-in path for industrial retrofits. New entrants, such as One Silicon Chip Photonics, focus on photonic integrated circuits that shrink optical interferometers onto silicon, enabling tactical accuracy without fiber spools. Venture capital is following quantum-enhanced concepts in cold-atom interferometry; however, those prototypes still require lab-grade conditions and high price points.
Supply risk in rare-earth magnets and fused-silica resonators encourages vertical integration. Several Tier 1 auto suppliers have co-investment deals with MEMS fabs to lock capacity and process recipes. Defense primes seek cyber-secure firmware images that resist over-the-air tampering, a niche where smaller vendors with encryption expertise can outmaneuver legacy firms. Overall, competition centers on hitting tighter drift at lower cost while navigating certification labyrinths across ISO 26262, FAA TSO and medical IEC 60601.
Gyroscopes Industry Leaders
Murata Manufacturing Co. Ltd
STMicroelectronics NV
Honeywell International Inc.
Analog Devices Inc.
Robert Bosch GmbH
- *Disclaimer: Major Players sorted in no particular order

Market Opportunities and Future Outlook
A key whitespace exists between low-cost, high-volume MEMS gyroscopes and navigation-grade optical systems. Industrial automation, robotics, drones, and advanced driver-assistance programs need tighter drift and better temperature stability, without taking on the size, cost, and supply constraints of traditional fiber-optic or ring-laser architectures. Product roadmaps that push MEMS toward higher Q-factor resonators (including micro-hemispherical resonator directions discussed in the technical literature) and add tighter calibration plus self-test features align with procurement requirements seen in automotive functional safety workflows and ruggedized industrial deployments.
Standardization and channel expansion provide practical routes to broaden adoption and reduce design-in friction. China GB/T 42597-2023 codifies MEMS gyroscope classification and performance parameters across consumer, industrial, and aerospace tiers, which helps OEMs align specifications and acceptance testing during sourcing. On the commercialization side, Silicon Sensing Systems expanded distribution coverage in 2026 through an exclusive Japan distributor appointment in January 2026 and an expanded agreement with Althen Sensors & Controls in February 2026, and its technology was integrated into a Kongsberg Discovery north-finding navigation device in March 2026. Together, these moves support opportunities around packaged IMUs for GNSS-challenged operation, north-finding, and precision stabilization, where integrators want validated modules, regional support, and clear performance class definitions rather than bespoke sensor development.
Recent Industry Developments
- May 2026: Murata Manufacturing Co., Ltd. launched the SCH1633-D05, a high-performance 6DoF IMU targeting automated driving and ADAS. The announcement also set mass production for June 2026, reinforcing Murata's scale-up path for automotive-qualified inertial sensing in higher-volume vehicle programs.
- March 2026: Honeywell announced the HGuide i700 IMU for unmanned vehicles designed for GNSS-denied environments and positioned as commercially available without export license requirements. The product positioning lowers procurement friction for cross-border autonomous systems programs that have faced export-control and licensing constraints on higher-end inertial solutions.
- November 2025: STMicroelectronics released the ISM6HG256X 3-in-1 motion sensor combining dual-accelerometer functions with a high-performance gyroscope for industrial IoT use. The integrated architecture supports industrial deployments seeking fewer components, lower system power, and simpler qualification for vibration-heavy automation environments.


Research Methodology Framework and Report Scope
Market Definition and Coverage
For this study, the gyroscopes market is defined as revenue earned from gyroscope units used to sense, measure, and control angular motion for navigation, stabilization, and motion tracking across civilian and defense end uses.
Scope exclusions: We exclude downstream services such as installation labor, calibration services sold separately, and aftermarket repair contracts that are priced outside the gyroscope unit sale.
Segmentation Overview
- By Technology
- MEMS Gyroscope
- Fiber Optic Gyroscope (FOG)
- Ring Laser Gyroscope (RLG)
- Hemispherical Resonating Gyroscope (HRG)
- Dynamically Tuned Gyroscope (DTG)
- Other Technologies
- By Axis
- 1-Axis
- 2-Axis
- 3-Axis
- By End-User Vertical
- Consumer Electronics
- Automotive
- Aerospace and Defense
- Industrial
- Marine
- Other End-User Verticals
- By Application
- Navigation Systems
- Stabilization Platforms
- Gaming and Virtual Reality
- Robotics and Automation
- Other Applications
- By Geography
- North America
- United States
- Canada
- Mexico
- South America
- Brazil
- Argentina
- Chile
- Rest of South America
- Europe
- United Kingdom
- Germany
- France
- Italy
- Spain
- Rest of Europe
- Asia-Pacific
- China
- Japan
- India
- South Korea
- Australia and New Zealand
- Rest of Asia-Pacific
- Middle East and Africa
- Middle East
- United Arab Emirates
- Saudi Arabia
- Turkey
- Rest of Middle East
- Africa
- South Africa
- Kenya
- Nigeria
- Rest of Africa
- Middle East
- North America
Data Sources, Market Sizing, and Validation
Desk Research
Desk work started with building a demand map by end use and region, then matching it to what is realistically shipped and deployed in the market. We used public sources such as national statistics agencies, customs and trade portals, defense budget documents, and aviation and maritime regulators for signals that move inertial demand.
For technology direction and adoption speed, we also reviewed patent databases, peer reviewed sensor and photonics journals, and technical releases from standards bodies. In addition, we checked company annual reports, investor presentations, and reputable press coverage to track changes in product mix and pricing direction. In a few cases, paid subscriptions for company financials and for news and financials were used to cross check revenue splits and corporate actions. The sources mentioned are illustrative only, and many other public materials were also used for data collection, validation, and research clarification.
Primary Interviews and Surveys
Primary work was used to pressure test what we saw in public data, especially on pricing ranges, qualification cycles, and how demand differs between consumer electronics, automotive, industrial automation, and aerospace and defense. We spoke with a mix of manufacturers, component and module suppliers, system integrators, and procurement or engineering users across key regions, and we revisited select experts when assumptions showed large variance during modeling.
Distribution of primary research fieldwork respondents
| Company type | Respondent position | Region |
|---|---|---|
| Top tier: 25% | CXOs: 19% | APAC: 44% |
| Mid tier: 56% | Functional/Unit leaders: 21% | EMEA: 34% |
| Smaller Players: 19% | Managers: 60% | Americas: 22% |
Market-Sizing & Forecasting
Sizing was built using a top-down and bottom-up approach, with the top-down path anchored on end-use demand pools that imply gyroscope consumption. In practice, device build trends, platform production, and defense and industrial procurement cycles were translated into unit demand, and then converted to value using technology and axis mix specific average selling prices.
To keep the model tied to real market behavior, we used inputs such as MEMS versus optical technology share shifts, 1-axis versus 3-axis adoption, navigation versus stabilization application mix, regional manufacturing and export signals, and price erosion patterns in high volume electronics. A selective bottom-up approximation was then used as a check, where sampled supplier revenue, channel feedback, and a volume times ASP sanity check were compared against the top-down totals, followed by adjustments when gaps stayed persistent. When data was missing for smaller or private participants, we used conservative mix assumptions based on similar product classes and tested the impact through sensitivity runs.
Forecasts were developed with scenario analysis supported by trend lines in the input variables, and then validated through expert views on qualification timing, defense and aerospace program cadence, and automotive and robotics adoption rates. This approach keeps the steps repeatable, and it keeps forecast drivers visible for client review.
Data Validation & Update Cycle
Validation is done through multiple cross checks that look for logical fit across regions, end uses, and technology splits, not just a single total number. Outputs are compared against independent signals like shipment direction, procurement announcements, and pricing movement, and anomalies are flagged for a second analyst review before sign-off.
If a key assumption shifts materially, such as a change in defense spending timing or a sharp correction in consumer device builds, we re-contact selected respondents and refresh the driver inputs. Reports are refreshed annually, and interim updates are made when major events occur that can shift supply, pricing, or demand. Before final delivery, an analyst performs a fresh pass so clients receive the latest updated view.
Mordor Intelligence's Global Gyroscopes Market Market Sizing Compared With Other Published Estimates
It is normal to see different market sizes for gyroscopes because each publisher draws the scope line differently, and then uses different demand signals and pricing logic to convert units into dollars. The spread is also influenced by the year chosen as the starting point, the treatment of defense programs, and how quickly price erosion is assumed in high volume electronics.
Some external estimates group gyroscopes with wider inertial sensing categories or apply a uniform growth curve from an older starting point. For Mordor Intelligence, the 2026 value is constructed using technology and axis mix by end use, and it counts gyroscope revenue only, excluding adjacent motion sensors and separate service revenue.
Benchmark comparison
| Source | Market Size | Gaps in Research Methodology |
|---|---|---|
| Mordor Intelligence | USD 4.56 B (2026) | |
| Industry Research Publisher A | USD 2.74 B (2024) | Uses an earlier base year and a broader application bucket that can blend gyroscopes with wider inertial sensing demand, which can shift totals depending on how categories and pricing are grouped. |
| Trade Journal B | USD 2.70 B (2024) | Presents a high-level market total with limited detail on technology and axis mix, and it can lean more on a single CAGR curve instead of a demand-pool build tied to end-use production and procurement cycles. |
The table shows that timing and scope differences explain most of the gap, not just the growth rate used. When totals are rebuilt from end-use demand and then converted using mix-sensitive ASPs, the result is easier to trace and update as new programs, device cycles, and pricing moves appear.


Key Questions Answered in the Report
How large is the global gyroscopes market today?
The gyroscopes market size reached USD 4.56 billion in 2026 and is set to top USD 6.13 billion by 2031.
Which region generates the highest sales for gyroscopes?
Asia-Pacific accounts for 40.42% of 2025 revenue thanks to its semiconductor and consumer-electronics clusters.
What technology type is growing fastest?
Fiber-optic gyroscopes lead growth at a 7.85% CAGR due to defense and aerospace precision needs.
Which end-user segment is expanding most quickly?
Industrial automation is advancing at an 8.21% CAGR as factories deploy robots and asset-tracking systems.
How are automotive trends influencing gyro demand?
Level 3-4 ADAS and electric-vehicle platforms require low-drift MEMS gyros with ISO 26262 diagnostics, boosting automotive orders.
What are the key restraints limiting market growth?
High-accuracy manufacturing complexity and supply-chain volatility in specialty fibers and ICs are the main headwinds.
Page last updated on:






