
Market Overview
| Study Period | 2020 - 2031 |
|---|---|
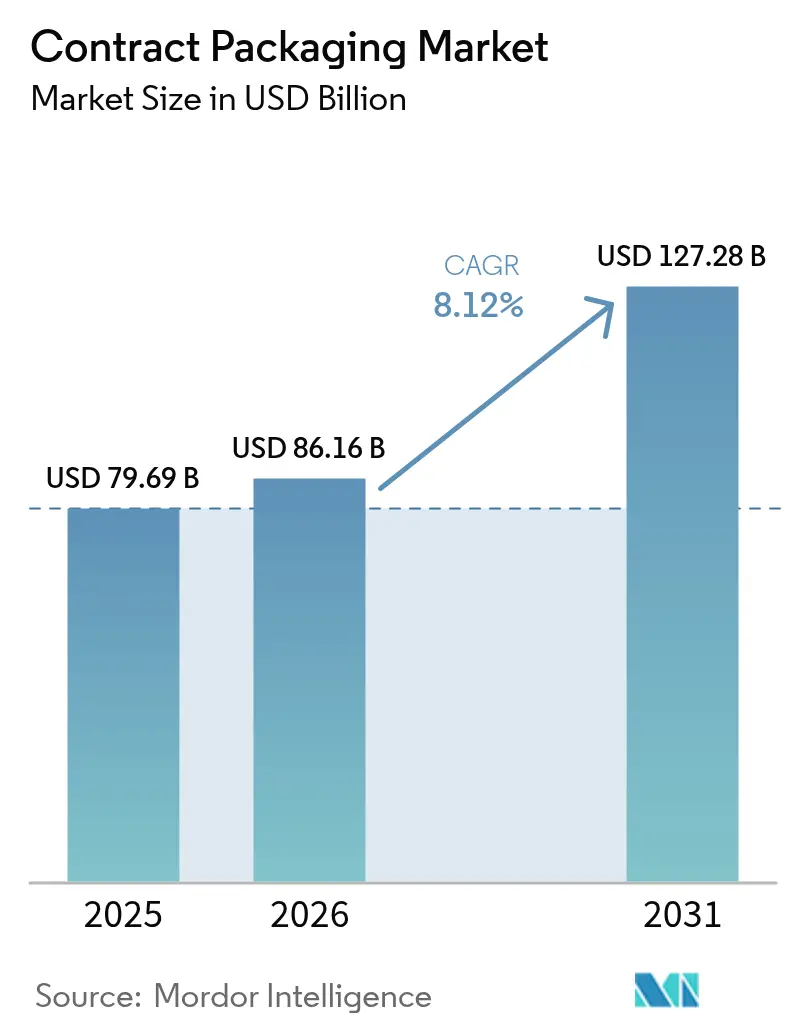
| Market Size (2026) | USD 86.16 Billion |
| Market Size (2031) | USD 127.28 Billion |
| Growth Rate (2026 - 2031) | 8.12% CAGR |
| Fastest Growing Market | Asia Pacific |
| Largest Market | North America |
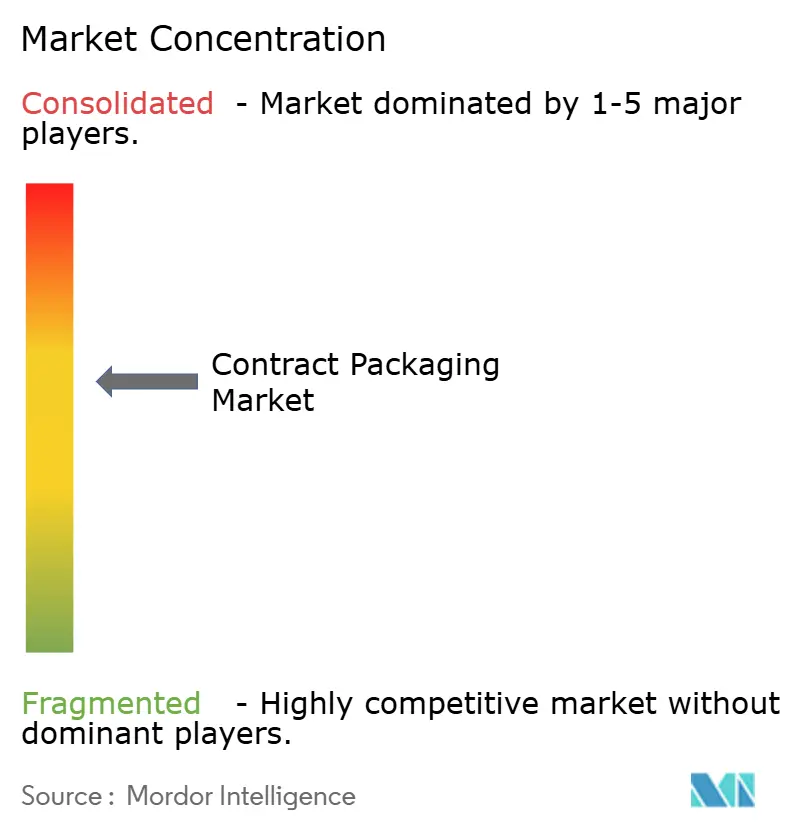
| Market Concentration | Medium |
Major Players *Disclaimer: Major Players sorted in no particular order Image © Mordor Intelligence. Reuse requires attribution under CC BY 4.0. | |
Contract Packaging Market Analysis by Mordor Intelligence
Contract packaging market size in 2026 is estimated at USD 86.16 billion, growing from 2025 value of USD 79.69 billion with 2031 projections showing USD 127.28 billion, growing at 8.12% CAGR over 2026-2031. Regulatory mandates from agencies such as the U.S. Food and Drug Administration (FDA) and the European Commission are the primary catalyst for outsourcing decisions, especially in pharmaceutical applications where combination product guidelines and recycled-content rules have raised the technical bar.[1]U.S. Food and Drug Administration, “Packaging & Food Contact Substances (FCS),” FDA.gov E-commerce fueled SKU proliferation, raw material cost volatility, and rapid automation adoption are reshaping service models and cost structures, prompting brand owners to engage providers with flexible lines and digital workflow capabilities. Consolidation-illustrated by Novo Holdings’ USD 16.5 billion Catalent purchase and Amcor’s USD 8.43 billion Berry Global deal-signals a race to scale, geographic reach, and advanced material science competence, giving larger players the edge in serving multinational customers with harmonized quality standards.
Key Report Takeaways
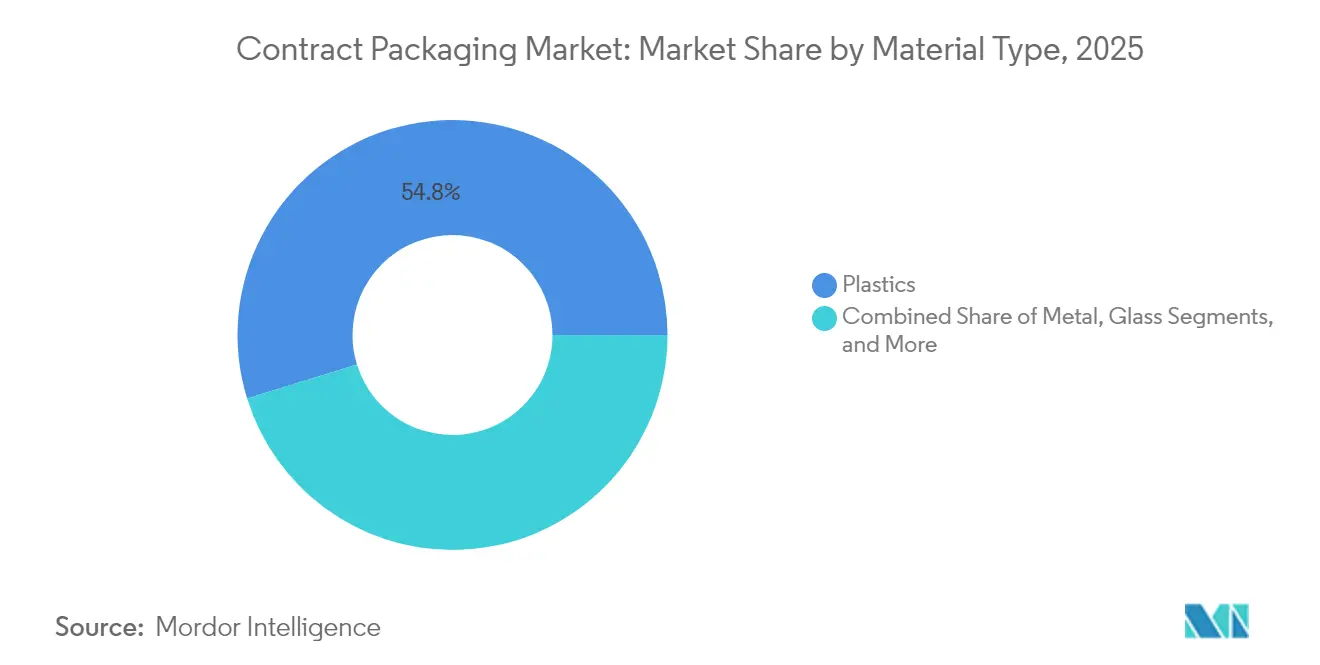
- By material type, plastics commanded 54.78% of the contract packaging market share in 2025; bio-based and composite materials are projected to grow at a 9.12% CAGR through 2031.
- By packaging type, primary packaging captured 56.89% of the contract packaging market size in 2025 and is set to expand at a 8.96% CAGR to 2031.
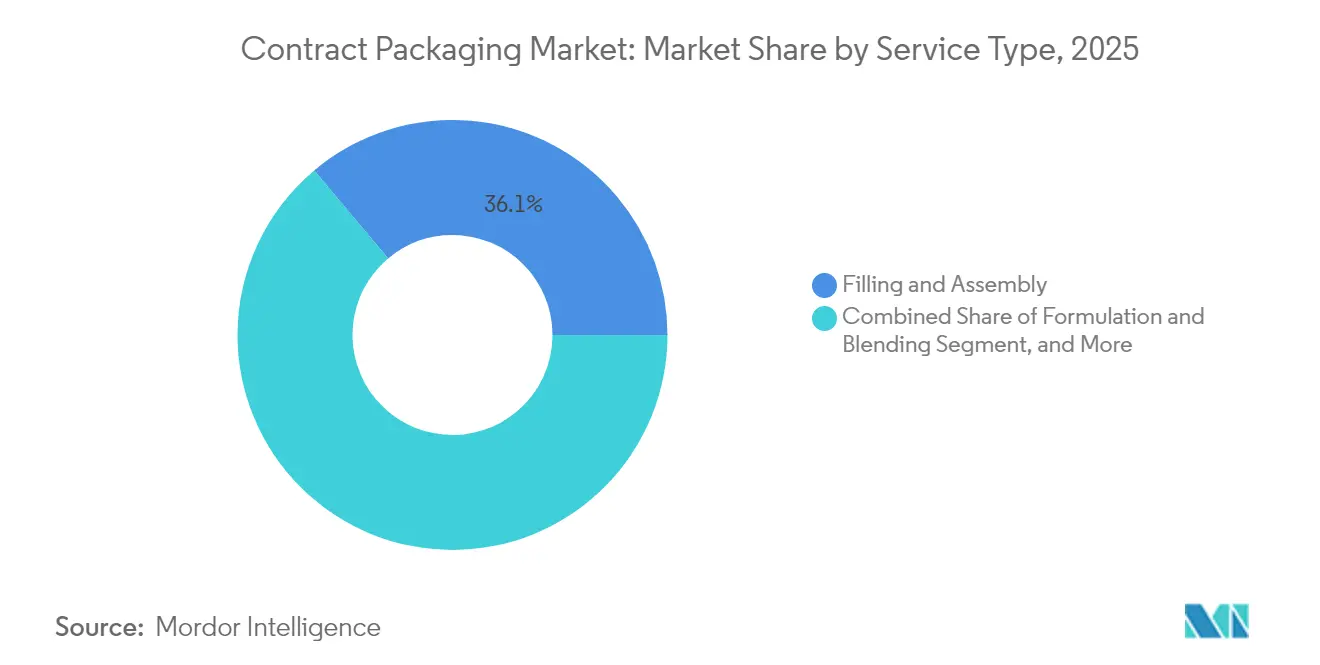
- By service type, filling and assembly held 36.12% of revenue in 2025, whereas fulfillment and logistics are advancing at a 9.95% CAGR through 2031.
- By end-user industry, the food segment led with 34.62% revenue share in 2025, while pharmaceuticals are forecast to record a 10.32% CAGR to 2031.
- By geography, North America retained 38.55% of 2025 revenue, and Asia-Pacific is on track for an 11.03% CAGR to 2031.
Note: Market size and forecast figures in this report are generated using Mordor Intelligence’s proprietary estimation framework, updated with the latest available data and insights as of 2026.
Global Contract Packaging Market Trends and Insights
Drivers Impact Analysis*
| Driver | (~) % Impact on CAGR Forecast | Geographic Relevance | Impact Timeline |
|---|---|---|---|
| Outsourcing to gain competitive advantage | +2.3% | Global, highest in North America and Europe | Medium term (2-4 years) |
| Explosive SKU proliferation from e-commerce | +1.9% | Global, led by Asia-Pacific and North America | Short term (≤ 2 years) |
| Pharma outsourcing for novel biologics | +1.6% | North America and Europe, expanding to Asia-Pacific | Long term (≥ 4 years) |
| Automation and robotics lowering per-unit cost | +1.4% | Global, early adoption in developed markets | Medium term (2-4 years) |
| Sustainability-led substrate shifts | +1.1% | Europe leading, followed by North America | Long term (≥ 4 years) |
| Near-shoring to mitigate geopolitical risk | +0.6% | North America to Mexico, Europe to Eastern Europe | Medium term (2-4 years) |
| Source: Mordor Intelligence | |||


Outsourcing to Gain Competitive Advantage
Pharmaceutical manufacturers increasingly direct capital toward drug discovery while relying on external partners for highly regulated packaging tasks. FDA guidance on combination products released in 2024 intensified validation, container-closure integrity, and documentation demands, encouraging biologics producers to outsource to specialists such as Catalent, which invested EUR 23 million (USD 27.13 million) in an automated clinical-supply line in Germany. European Medicines Agency rules for advanced therapy medicinal products heighten the complexity further, prompting contract packagers to shoulder compliance risk and technology refresh, shortening launch timelines for sponsors and freeing them from costly facility upgrades.
Explosive SKU Proliferation from E-commerce
Direct-to-consumer channels require shorter runs, frequent artwork variations, and protective designs tuned for parcel networks rather than palletized retail. Flexible manufacturing cells and digital job tickets allow contract packagers to execute more changeovers per shift without inflating set-up costs. Food brands exploit this agility for seasonal flavors and limited editions, while the same lines accommodate eco-friendly substrates that align with online retailers’ emissions goals. Modern workflow software captures traceability data and routes it into enterprise resource planning systems, meeting audit requirements and reducing recall risk.
Pharma Outsourcing for Novel Biologics Packaging
Biologics demand sterile barriers, temperature integrity, and drug-device pairing. Drug delivery patents climbed 28% in 2024, underlining relentless innovation.[2]United States Patent and Trademark Office, “Patent Activity Report – Packaging Technologies 2024,” uspto.gov PCI Pharma Services earmarked USD 365 million for global biologics-ready lines capable of assembling autoinjectors and on-body pumps. Sponsors lacking such infrastructure turn to external partners for speed-to-market and regulatory expertise, with service agreements often spanning clinical and commercial stages.
Automation and Robotics Lowering Per-unit Cost
Collaborative robots, vision systems, and predictive maintenance reduce labor exposure and scrap. Packaging automation patent activity rose 31% in 2024, confirming widespread investment. Continuous operation improves overall equipment effectiveness, allowing providers to quote competitive unit costs yet retain margin integrity. Automated lines generate process data streams that assist FDA and EMA inspections, further differentiating technologically advanced suppliers.
Restraints Impact Analysis*
| Restraint | (~) % Impact on CAGR Forecast | Geographic Relevance | Impact Timeline |
|---|---|---|---|
| Stringent cross-border regulatory compliance | -1.6% | Global, highest in pharma and food sectors | Long term (≥ 4 years) |
| Competition from in-house packaging lines | -1.1% | Developed markets with established infrastructure | Medium term (2-4 years) |
| Volatile resin and energy prices | -0.9% | Global, highest in energy-intensive operations | Short term (≤ 2 years) |
| Mismatch between recycled-content goals and supply | -0.7% | Europe and North America leading sustainability initiatives | Medium term (2-4 years) |
| Source: Mordor Intelligence | |||
Stringent Cross-border Regulatory Compliance
Divergent FDA and European rules compel providers to duplicate validation protocols, label formats, and audit trails. PPWR design standards occasionally clash with U.S. food-contact thresholds, obliging dual inventory or reformulation. Smaller firms struggle to fund the necessary quality teams, enterprise resource planning modules, and serialization infrastructure, limiting their participation in global bids.
Competition from In-house Packaging Lines
High-volume manufacturers, notably in consumer staples, amortize automated lines over large runs, narrowing the price gap with outsourced alternatives. While complexity and sustainability demands still nudge niche products toward specialists, mainstream SKUs remain viable internally, especially when intellectual property protection outweighs outsourcing’s flexibility benefits.
*Our forecasts treat driver/restraint impacts as directional, not additive. The impact forecasts reflect baseline growth, mix effects, and variable interactions.
Segment Analysis
By Material Type: Bio-based Polymers Gain Momentum
Plastics retained 54.78% of revenue in 2025 thanks to entrenched supply chains, but recycled-content quotas and brand commitments accelerate a 9.12% CAGR for bio-based and composite materials. The shift calls for extrusion upgrades, compatibilizer know-how, and barrier coatings that preserve shelf life without multilayer laminates. Contract packaging market size allocations to plant-based polymers will expand as PPWR deadlines near, giving providers with formulary expertise a pricing premium.
Technical complexity widens competitive gaps. Providers with on-site laboratories conduct migration, seal-strength, and shelf-life tests swiftly, shortening approval cycles. Patent filings for biodegradable solutions rose 34% in 2024, underscoring rapid innovation and signaling that material leadership will be pivotal for margin defense.


By Packaging Type: Primary Formats Dominate Compliance-Driven Spend
Primary packaging accounted for 56.89% of 2025 revenue and is set for a 8.96% CAGR owing to stringent contact-surface validations required by the FDA and EMA. The contract packaging market share premium arises from container-closure integrity, extractables, and leachables testing, which smaller in-house teams often cannot execute economically.
Secondary packs face margin compression as corrugate and carton converting capacities rise globally, yet remain critical for tamper evidence, brand messaging, and serialization. Tertiary packs evolve with automation; robotic palletizers and warehouse robots drive ergonomic redesigns that improve cube utilization.
By Service Type: Fulfillment Adds End-to-End Value
Filling and assembly represented 36.12% of 2025 spend, reflecting high-volume production runs in food and beverage. Yet fulfillment and logistics will grow 9.95% annually as e-commerce sellers seek single-provider solutions. Providers integrate warehouse management systems, pick-to-light technology, and last-mile carrier APIs, enabling just-in-time runs and postponement strategies that cut client inventory holding costs.
Formulation and blending services advance steadily in pharmaceuticals and personal care, bundling active-ingredient handling with downstream packaging. Serialization, temperature monitoring, and real-time inventory dashboards differentiate partners competing for long-term contracts.
By End-User Industry: Pharma Leads Value Creation
Pharmaceutical spending, while lower volume than food, delivers a 10.32% CAGR through 2031 as biologics pipelines mature. Contract packaging market size gains reflect specialized needs-sterile environments, cold chain, and device integration-that command premium pricing. Catalent’s German expansion and PCI’s USD 365 million program illustrate the capex scale required to compete.
Food maintained 34.62% revenue in 2025, emphasizing scale and cost efficiency, yet sustainability regulations shift material choice toward fiber-based and mono-PE solutions. Cosmetics and personal care innovate with airless pumps and sensory-driven closures that enhance consumer experience.
Geography Analysis
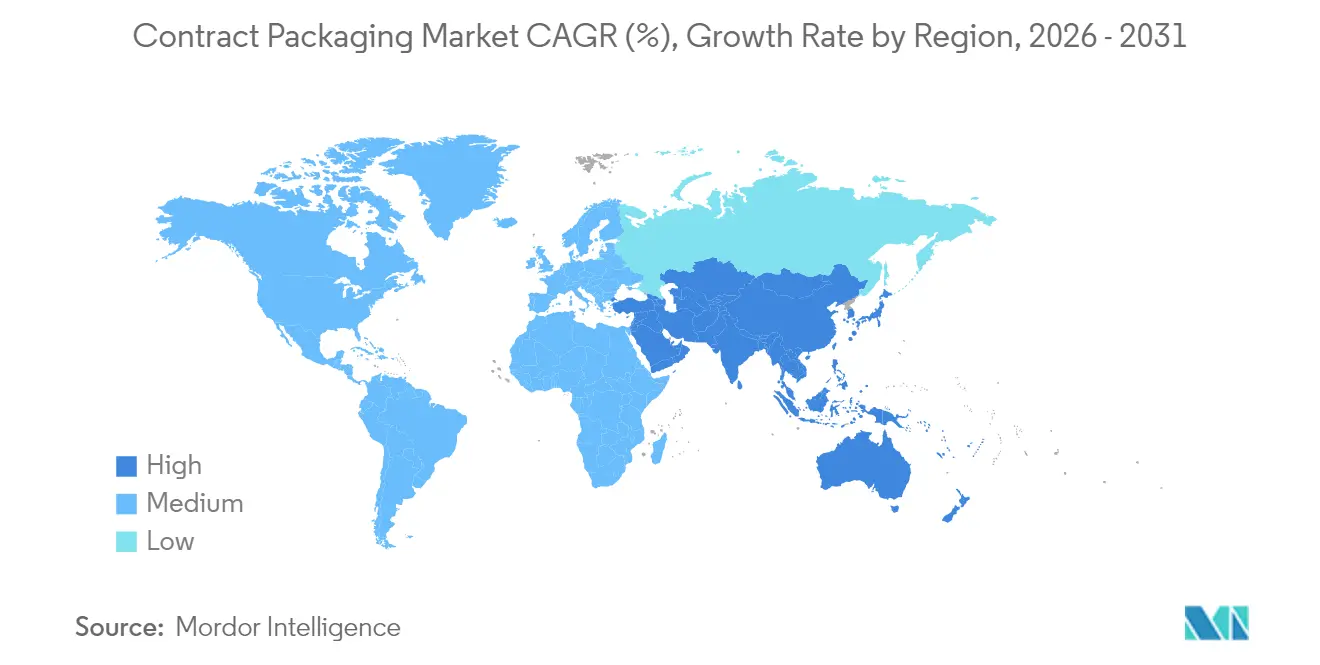
North America contributed 38.55% of 2025 sales, underpinned by mature pharmaceutical outsourcing and advanced automation adoption. The contract packaging market size in Asia-Pacific is accelerating at 11.03% CAGR, propelled by China’s 8.7% packaging output growth and pro-manufacturing policies. India’s vaccine output surge and Japan’s reform of medical device approvals further lift regional demand.
Europe’s growth centers on PPWR compliance, spurring investment in recyclable substrates and digital traceability infrastructure. South America and the Middle East and Africa represent long-horizon opportunities contingent on logistics upgrades and regulatory harmonization.

Regulatory Landscape
Contract packaging is shaped by overlapping product-safety and packaging-waste regimes, with pharmaceutical and food-contact rules acting as key outsourcing triggers. In the United States, FDA requirements under 21 CFR 210/211 (CGMP) and associated guidance on quality agreements and contract sterilizers set expectations for how brand owners and contract packagers allocate responsibilities for validation, documentation, and oversight.
In Europe, Regulation (EU) 2025/40 (Packaging and Packaging Waste Regulation, PPWR) tightens access-to-market requirements around recyclability, conformity assessment, and technical documentation, including heavy metal limits (100 mg/kg combined for lead, cadmium, mercury, and hexavalent chromium). The PPWR applies from 12 August 2026, and related European Commission notices in 2026 support interpretation and implementation. As a result, compliance workload increases for packaging placed on the EU market, and providers that can operationalize declarations of conformity and documentation retention across customers and SKUs gain value.
Value Chain Analysis
The value chain starts with raw materials (resins, paper and paperboard, metals, glass, inks, and adhesives) and moves through converting (films, cartons, bottles, closures), component sourcing, and inbound logistics into contract-packaging operations. Contract packagers deliver regulated and non-regulated services such as formulation or blending (where applicable), filling and assembly, packaging and labeling, kitting, serialization, and final distribution through 3PL networks and parcel carriers. Brand owners keep product and market-authorization accountability, while execution complexity is shifted to specialists.
Bottlenecks and cost drivers tend to concentrate at the interfaces between material compliance and operations. Volatile input costs, labor availability, and rapid changeovers driven by e-commerce SKU proliferation increase scheduling complexity and scrap risk. Compliance demands, such as CGMP documentation in pharmaceuticals and EU PPWR technical documentation and conformity workflows for EU-bound packs, also increase the need for integrated quality systems, digital job-ticketing, and traceability. This pushes providers toward modular automation and multi-site footprints to meet lead-time, audit, and cross-border requirements.
Competitive Landscape
Mega-mergers reshape the playing field. Novo Holdings’ Catalent deal and Amcor’s Berry Global acquisition create vertically integrated entities wielding expanded R&D, procurement leverage, and cross-regional footprints, making them preferred partners for global launches. Technology investment differentiates contenders: patent filings in packaging automation jumped 31% in 2024, demonstrating the arms race for robotics, machine learning, and vision-guided inspection.
Smaller specialists thrive in niches-high-potency drug filling, eco-design, or connected packaging-yet must form alliances or accept acquisition risk as capital intensity and data requirements escalate. Providers able to pair advanced material science with digital supply chain tools will capture an outsized share of margin expansion.
Contract Packaging Industry Leaders
Amcor plc
Sonoco Products Company
Aaron Thomas Company, Inc.
Jones Healthcare Group Inc.
Sharp Packaging Services LLC
- *Disclaimer: Major Players sorted in no particular order

Market Opportunities and Future Outlook
Regulation-driven documentation and labeling complexity creates room for providers that can standardize technical files, declarations of conformity, and item-level traceability across many SKUs and geographies. With the EU PPWR applying from 12 August 2026, and 2026 European Commission notices supporting implementation, customers need operational tools and services that handle packaging composition data, evidence packs for audits, and documentation retention, especially where shipments into Europe come from multi-region supply chains.
Pharmaceutical and life-sciences outsourcing continues to expand beyond packaging execution into integrated, multi-site service models that reduce handoffs across the supply chain. Alcami's April 2026 acquisition of Tjoapack points to consolidation focused on combining packaging, labeling, and Qualified Person (QP) release-linked capabilities across the United States and Europe. Tjoapack's March 2026 announcement of a major Clinton, Tennessee capacity expansion, including a new 170,000-square-foot facility targeted for completion in 2027, highlights demand for GMP-ready suites spanning oral solid dose and injectables. Separately, digital workflow and automation are adding a monetizable layer for both contract packagers and adjacent manufacturers, including Amtech's July 2026 launch of EnCore Contract Packaging software to manage assembled products and co-manufacturing operations.
Recent Industry Developments
- July 2026: Amtech launched EnCore Contract Packaging, a software suite positioned to help manufacturers manage assembled products, contract packaging, and co-manufacturing workflows. The release expands competitive differentiation around digital execution, component traceability, and operational control for complex, multi-SKU packaging programs.
- April 2026: Alcami acquired contract packaging organization Tjoapack, expanding Alcami's reach in pharmaceutical packaging, labeling, and related release services across the United States and Europe. The transaction supports a more integrated outsourcing model that reduces supplier handoffs for sponsors managing clinical-to-commercial packaging programs.
- December 2024: Novo Holdings finalized its USD 16.5 billion acquisition of Catalent, expanding a global network of biologics and drug delivery capabilities across more than 50 facilities. The deal strengthened large-scale, regulated packaging capacity and increased competitive pressure on smaller providers that do not have comparable capital depth and geographic breadth.


Research Methodology Framework and Report Scope
Market Definition and Coverage
This market covers outsourced packaging services provided by specialized partners that pack, label, assemble, and prepare finished goods for sale or shipment, across industries such as food, beverage, pharmaceuticals, and personal care. The sizing is captured in value terms in USD at the global level.
Scope exclusions: In-house packaging done fully inside brand-owner or manufacturer facilities is excluded when no third-party service revenue is generated.
Segmentation Overview
- By Material Type
- Plastics
- Paper and Paperboard
- Metal
- Glass
- Bio-based and Composites
- By Packaging Type
- Primary
- Secondary
- Tertiary
- By Service Type
- Formulation and Blending
- Filling and Assembly
- Packaging and Labeling
- Fulfillment and Logistics
- Other Service Types
- By End-User Industry
- Food
- Beverage
- Pharmaceutical
- Cosmetics and Personal Care
- Industrial
- Other End-user Industries
- By Geography
- North America
- United States
- Canada
- Mexico
- South America
- Brazil
- Argentina
- Chile
- Rest of South America
- Europe
- United Kingdom
- Germany
- France
- Spain
- Italy
- Rest of Europe
- Asia-Pacific
- China
- India
- Japan
- Australia
- South Korea
- Vietnam
- Rest of Asia-Pacific
- Middle East and Africa
- Middle East
- Saudi Arabia
- United Arab Emirates
- Turkey
- Rest of Middle East
- Africa
- South Africa
- Nigeria
- Egypt
- Rest of Africa
- Middle East
- North America
Data Sources, Market Sizing, and Validation
Desk Research
Desk work starts by aligning what counts as contract packaging revenue, then mapping where demand is most visible across end users and regions. We rely on public sources such as US FDA packaging and labeling guidance, European Commission rules for food contact materials, UN Comtrade trade statistics for packaging inputs, US Census Bureau manufacturing and trade series, and World Bank macro indicators used to normalize growth across countries.
Along with this, company annual reports, earnings decks, association websites, and trusted press are used to confirm service mix changes such as secondary packaging, coding, and kitting, which tend to shift pricing. A paid subscription for company financials and news is used selectively to track revenue splits and deal announcements, and an import-export shipment-level database is referenced when packaging material flows are needed as a reality check. These examples are not exhaustive, and many other public sources were also used for data collection, validation, and clarification.
Primary Interviews and Surveys
Primary interviews and surveys were used to test key assumptions that usually do not show up cleanly in public data, like pass-through timing for packaging material inflation, typical contract lengths, and utilization swings by end-user industry. We covered converters and service providers, packaging procurement teams, and logistics or operations stakeholders. Fieldwork was spread across major demand regions so regional pricing and mix effects could be separated before finalizing the model.
Distribution of primary research fieldwork respondents
| Company type | Respondent position | Region |
|---|---|---|
| Top tier: 37% | CXOs: 17% | APAC: 42% |
| Mid tier: 42% | Functional/Unit leaders: 29% | EMEA: 32% |
| Smaller Players: 21% | Managers: 54% | Americas: 26% |
Market-Sizing & Forecasting
Sizing is built using a top-down approach once, where end-use packaging activity and outsourcing penetration are used to reconstruct the demand pool for third-party packaging services by region. The model is then corroborated with selective bottom-up checks, including sampled provider revenue run-rates, capacity and utilization discussions, and a volume times average service price view for common tasks like labeling, cartoning, and kitting.
To keep the numbers tied to real market movement, we track practical inputs, including packaged food and beverage output trends, pharmaceutical production and compliance-driven packaging needs, packaging material price indices that influence service pricing, labor cost direction in key hubs, and outsourcing intensity by customer type. Forecasting uses scenario analysis supported by simple time-series smoothing for the core demand drivers, then adjusts using expert expectations on contract repricing cycles and mix shifts across primary, secondary, and tertiary packaging. Where provider data is thin in a country, gaps are handled through proxy indicators, and then normalized back to regional service intensity so totals do not get overstated.
Data Validation & Update Cycle
Validation is done by comparing model outputs with independent signals, such as packaging input trade movement, end-use production direction, and reported service revenue trends, then checking whether implied prices and volumes stay realistic. Outliers are reviewed, and when a variance cannot be explained by mix or currency, follow-up calls are triggered to re-check assumptions like pass-through lag and utilization.
Before sign-off, the work is reviewed in multiple steps so unit logic, conversions, and regional splits align with the stated scope. Reports are refreshed annually, with interim updates when material events occur, and a final pre-delivery pass is completed so the published view reflects the latest available data.
Mordor Intelligence's Global Contract Packaging Market Market Sizing Compared With Other Published Estimates
Published market sizes for contract packaging can look far apart, even when they use the same label, because timing and pricing choices change the totals quickly. Differences usually come from which year is treated as the base, how service prices are updated for material and labor shifts, and whether currency conversion is done at a single point in time or averaged.
In this study, refresh cadence and currency timing were treated as first-order drivers, and average service pricing was updated using pass-through checks from interviews, which is why Mordor Intelligence reports a higher 2026 level than estimates anchored on 2025 values that are carried forward with lighter repricing logic.
Benchmark comparison
| Source | Market Size | Gaps in Research Methodology |
|---|---|---|
| Mordor Intelligence | USD 86.16 B (2026) | |
| Industry Publisher A | USD 77.90 B (2025) | Anchors the market at a 2025 base year, and the size is more sensitive to how 2026 repricing is assumed for services tied to packaging material and labor inflation. |
| Global Publisher B | USD 78.31 B (2025) | Uses a 2025 starting point and a longer forecast window, which can dilute near-term mix changes and currency timing effects that lift or lower the first forecast-year value. |
The comparison mainly shows that year selection and the way service prices are rolled forward can move the market by several billion dollars. By keeping assumptions traceable to outsourcing penetration, end-use activity, and interview-checked repricing behavior, the estimate stays easier to reproduce and re-check when new data arrives.


Key Questions Answered in the Report
How large is the contract packaging market in 2026?
The market is valued at USD 86.16 billion in 2026, on a path to USD 127.28 billion by 2031 at an 8.12% CAGR.
Which segment contributes the highest revenue?
Primary packaging leads with 56.89% of 2025 sales due to strict contact-surface compliance requirements.
Which region is growing the fastest?
Asia-Pacific is advancing at an 11.03% CAGR through 2031, fueled by Chinese manufacturing expansion and pharmaceutical outsourcing.
Why are brands outsourcing packaging?
Regulations, SKU complexity, and automation investment needs make specialized providers more cost-effective and compliant than in-house lines.
What drives material innovation in packaging?
PPWR recycled-content mandates and corporate sustainability goals accelerate adoption of bio-based and recyclable substrates.
How is consolidation shaping the competitive landscape?
Mega-mergers such as Novo Holdings–Catalent and Amcor–Berry Global create scale advantages in R&D, procurement, and global service delivery.
Page last updated on:






