
Market Overview
| Study Period | 2020 - 2031 |
|---|---|
| Forecast Data Period | 2026 - 2031 |
| Base Year Market Size (2025) | USD 33.19 Billion |
| Market Size (2026) | USD 35.36 Billion |
| Market Size (2031) | USD 48.52 Billion |
| Growth Rate (2026 - 2031) | 6.54 % |
| Market Concentration | Low |
Major Players *Disclaimer: Major Players sorted in no particular order Image © Mordor Intelligence. Reuse requires attribution under CC BY 4.0. | |
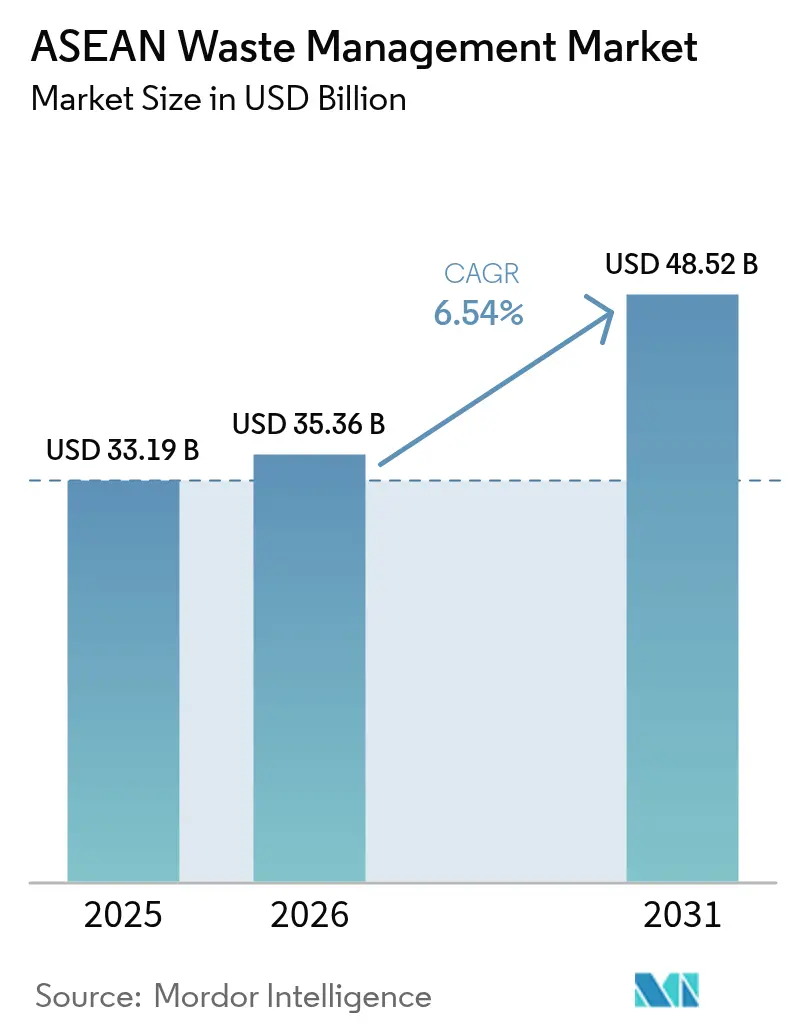
ASEAN Waste Management Market Analysis by Mordor Intelligence
ASEAN Waste Management Market size in 2026 is estimated at USD 35.36 billion, growing from 2025 value of USD 33.19 billion with 2031 projections showing USD 48.52 billion, growing at 6.54% CAGR over 2026-2031. This steady climb reflects rising urban populations, increasingly stringent circular-economy regulations, and the surge in e-commerce packaging that demands more sophisticated collection and processing systems. Government-led Extended Producer Responsibility (EPR) schemes, including Vietnam’s Decree 05/2025/ND-CP, tighten compliance thresholds while unlocking predictable funding streams for infrastructure. Ambitious waste-to-energy (WtE) programs in Indonesia, Vietnam, and Thailand, and the adoption of artificial-intelligence route optimization, are lowering operating costs and reinforcing the growth outlook of the ASEAN waste management market. New feed-in tariffs of USD 0.11 (VND 2,575.18) per kWh for WtE power in Vietnam provide developers a bankable revenue floor and signal similar incentives across the bloc.
Key Report Takeaways
- By source, residential waste held 49.23% of the ASEAN waste management market share in 2025, while commercial sources are expanding at an 8.35% CAGR through 2031.
- By service type, collection, transportation, sorting, and segregation accounted for 53.72% of the ASEAN waste management market size in 2025; recycling and resource recovery are projected to grow at an 8.42% CAGR.
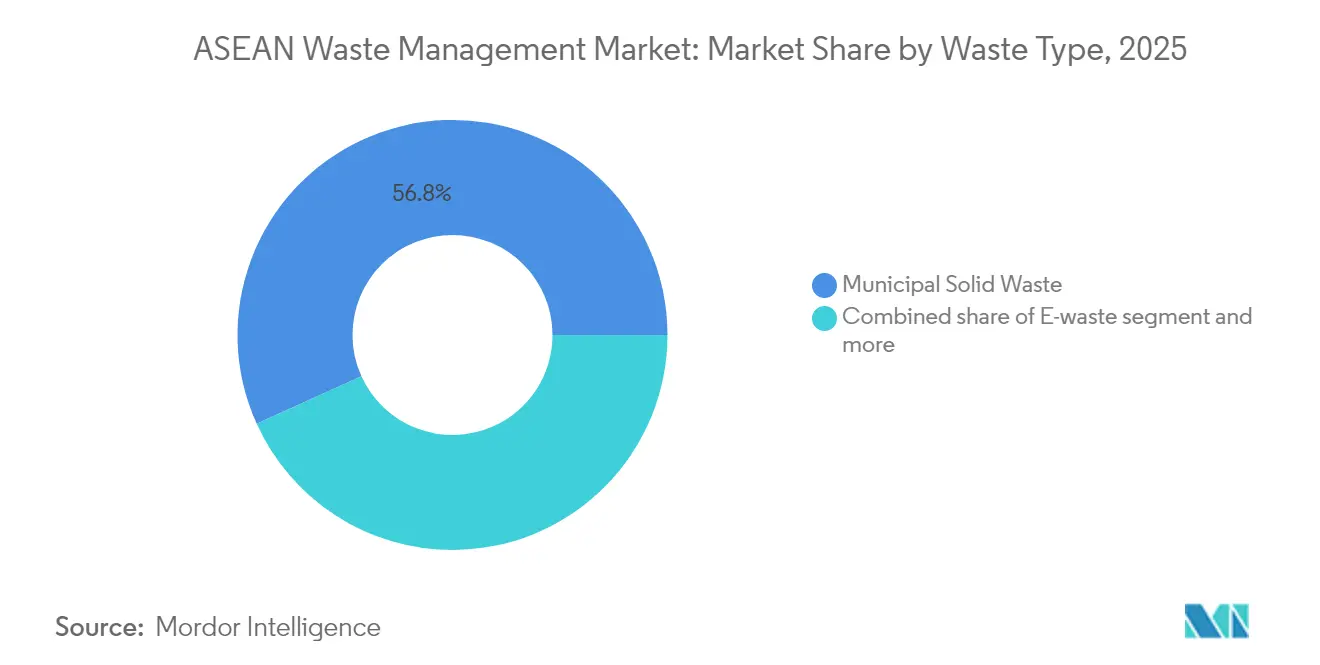
- By waste type, municipal solid waste contributed 56.78% of revenue in 2025, whereas e-waste is advancing at a 7.33% CAGR to 2031.
- By geography, Indonesia led with 35.52% of the ASEAN waste management market share in 2025; the Rest of the ASEAN group is forecast to expand at a 6.88% CAGR.
Note: Market size and forecast figures in this report are generated using Mordor Intelligence’s proprietary estimation framework, updated with the latest available data and insights as of 2026.
Market Trends and Insights
Drivers Impact Analysis of ASEAN Waste Management Market*
| Driver | % Impact on CAGR Forecast | Geographic Relevance | Impact Timeline |
|---|---|---|---|
| Circular-economy regulations accelerating public–private investment | +1.2% | ASEAN-wide, strongest in Singapore, Vietnam, Philippines | Medium term (2-4 years) |
| EU-style Extended Producer Responsibility schemes spreading across ASEAN | +0.9% | Vietnam, Philippines, Singapore leading, Indonesia following | Medium term (2-4 years) |
| Rapid rise of e-commerce packaging waste | +0.8% | Urban centers across ASEAN, particularly Thailand, Malaysia, Indonesia | Short term (≤ 2 years) |
| Waste-to-Energy feed-in tariffs in Indonesia, Vietnam & Thailand | +0.7% | Indonesia, Vietnam, Thailand with WtE infrastructure | Medium term (2-4 years) |
| AI-enabled route-optimisation cutting collection OPEX | +0.6% | Singapore, Malaysia, urban Thailand and Indonesia | Short term (≤ 2 years) |
| Corporate zero-plastic footprints commitments (CPG & retail) | +0.5% | Regional multinational operations, urban markets | Long term (≥ 4 years) |
| Source: Mordor Intelligence | |||
Circular-Economy Regulations Accelerating Public–Private Investment
Region-wide circular-economy targets are unlocking unprecedented capital for waste infrastructure. Indonesia’s Presidential Regulation 98/2021 anchors a carbon-credit market that could abate 1,283 million tCO₂e by 2030, giving private operators long-term revenue clarity. Singapore’s Resource Sustainability Act mandates segregated food waste collection from 2024 and compulsory 3R plans for large packaging producers by 2025, spurring upstream design changes. The ASEAN Framework for Circular Economy, adopted in 2021, harmonizes policy roadmaps and reduces investor risk for cross-border projects. Malaysia’s target of 18 WtE plants by 2040, backed by a 40% recycling-rate goal, illustrates how regulatory certainty drives pipeline formation. Multilateral financiers estimate USD 8.9 billion in annual economic losses from poor plastic recovery, strengthening the case for accelerated investment[1].
EU-Style Extended Producer Responsibility Schemes Spreading Across ASEAN
Harmonized EPR policies are rewriting cost structures across packaging value chains. Vietnam’s updated Decree 05/2025/ND-CP raises revenue-based exemptions to USD 0.87 million (VND 20 billion) and USD 1.30 million (VND 30 billion) while setting clearer recycling quotas. Singapore’s electronics EPR model, operational since 2021, finances take-back networks through producer fees. Indonesia targets a 70% plastic waste reduction by 2025 using plastic-credit schemes that let brands offset recycling costs. Malaysia’s 2021 EPR rollout helped lift the national recycling rate from 15.7% in 2015 to 35.38% in 2023. Predictable compliance fees transform waste into a traceable feedstock, helping formal operators in the ASEAN waste management market secure financing for new materials-recovery facilities.
Rapid Rise of E-Commerce Packaging Waste
Explosive growth in online retail is adding unprecedented packaging volumes to urban waste streams. Thailand’s ban on imported plastic scrap from January 2025 forces domestic platforms to develop closed-loop solutions, widening demand for collection and recycling services. Singapore’s mandatory packaging reporting, effective 2025, captures SKU-level data that supports targeted pickups and clearer producer obligations. Retailers such as Fraser & Neave now use 25% recycled-content bottles and aim for a 30% landfill-waste cut by 2025. Indonesia’s dense urban centers rely heavily on informal pickers for sorting e-commerce plastics, creating opportunities for technology-led aggregation platforms. As packaging composition shifts toward multilayer films, advanced mechanical and chemical recycling capacities are gaining prominence in the ASEAN waste management market.
AI-Enabled Route Optimization Cutting Collection OPEX
Artificial-intelligence platforms that digest traffic, fill-level sensor, and weather data are slashing operating costs for collectors. Pilot projects across Singapore’s central business district show fuel and labor savings of up to 15% when dynamic routing algorithms replace static schedules. Thailand’s city councils are introducing app-based citizen reporting combined with smart bins to trigger on-demand pickups, increasing fleet utilization rates. Low capex requirements, the software can overlay existing trucks, making such tools attractive to smaller haulers trying to gain share in the ASEAN waste management market. Higher service reliability also supports tender wins from corporate campuses bound by sustainability KPIs. Over the longer term, aggregated route data feeds into carbon-credit calculations, offering an additional revenue layer.
Restraints Impact Analysis of ASEAN Waste Management Market*
| Restraint | % Impact on CAGR Forecast | Geographic Relevance | Impact Timeline |
|---|---|---|---|
| Highly fragmented informal sector limiting feedstock traceability | -0.7% | Indonesia, Philippines, Vietnam, Thailand rural areas | Long term (≥ 4 years) |
| Landfill tipping-fee divergence across member states | -0.5% | Cross-border waste movement regions, particularly Malaysia-Singapore corridor | Medium term (2-4 years) |
| High chloride content in mixed municipal waste hindering RDF quality | -0.4% | Regional WtE facilities, particularly Indonesia, Thailand | Medium term (2-4 years) |
| Policy uncertainty around carbon credit treatment for WtE plants | -0.3% | Indonesia, Thailand, Vietnam with carbon market development | Medium term (2-4 years) |
| Source: Mordor Intelligence | |||
Highly Fragmented Informal Sector Limiting Feedstock Traceability
Millions of informal pickers dominate plastic and paper recovery across ASEAN, yet operate outside digital audit trails, complicating EPR verification and carbon-credit issuance. Indonesian pemulung collectors manage over half of Jakarta’s daily plastic, but rarely provide material-flow documentation, undermining circularity metrics. The United Nations Office on Drugs and Crime links waste trafficking to organized crime in Malaysia, Vietnam, and Thailand, further muddying traceability. Cambodia’s rural districts still rely on ad-hoc community dumps, making data capture almost impossible. Without reliable feedstock provenance, many recyclers lose access to premium export markets that demand chain-of-custody proof. Closing this digital divide is crucial for a more formalized ASEAN waste management market.
High Chloride Content in Mixed Municipal Waste Hinders RDF Quality
Salt-rich food scraps, marine debris, and packaging inks raise chlorine levels in municipal waste, corroding combustion lines and forcing costly flue-gas cleaning in WtE plants. Laboratory tests show that each 1% rise in chlorine can cut boiler life by 10%, inflating capex and insurance premiums. In Indonesia, trial RDF bales from coastal cities exceed the 0.7% chlorine ceiling set by many European co-processors, limiting export prospects. Vietnamese developers add multi-stage scrubbers, lifting opex and end-power tariffs, and delaying project financial close. Unless advanced pre-treatment lines are deployed, high-chloride waste could stall WtE rollouts, restricting energy-recovery potential in the ASEAN waste management market[2].
*Our forecasts treat driver/restraint impacts as directional, not additive. The impact forecasts reflect baseline growth, mix effects, and variable interactions.
ASEAN Waste Management Market Segment Analysis
By Source:
Residential Dominance Drives Commercial GrowthResidential streams delivered 49.23% of 2025 revenue, underscoring the sheer scale of household generation across ASEAN megacities. Commercial waste, however, is set to expand at an 8.35% CAGR, outpacing every other source as malls and office parks comply with stricter segregation mandates. The ASEAN waste management market size for commercial sources is projected to widen notably once large retailers internalize full EPR charges linked to packaging. Food courts and hotels in Singapore already segregate organics for on-site digesters, and similar regulations are being drafted in Vietnam and Malaysia. As procurement teams seek single-contract service bundles covering bins, audit, and reporting, integrated providers will gain cross-selling opportunities.
The ASEAN waste management market share commanded by residential sources may slip because corporate generators purchase premium traceability services that attract higher tariffs. Super-apps offering waste pickup scheduling are bundling reward points, drawing more commercial tenants into formal systems. Industrial parks continue to deliver steady tonnage, yet pollution-control certificates now require third-party audits, nudging factories toward licensed handlers. Construction debris volumes are swelling on the back of infrastructure stimuli, incentivizing joint ventures between cement producers and waste contractors to co-process rubble and wood off-cuts.


By Service Type:
Collection Services Lead While Recycling AcceleratesCollection, transportation, sorting, and segregation made up 53.72% of 2025 revenue, reflecting the unavoidable logistics backbone of the ASEAN waste management market. Municipal tenders still price services by ton collected, ensuring stable cash flows even when downstream commodity prices dip. Yet recycling and resource recovery are climbing at an 8.42% CAGR as brands pursue zero-landfill pledges. The ASEAN waste management market size for recycling will swell further once advanced PET and flexible-film lines backed by IFC and ADB reach commercial operations.
Financial incentives are shifting: Indonesia exempts recycling equipment imports from import duty, and Vietnam gives a 10-year corporate-income-tax holiday for new materials-recovery facilities. Disposal-focused operators face margin pressure as landfill tipping fees plateau and carbon taxes loom. Chemical recycling pilots in Malaysia target 20 kilotons per year by 2027 but must scale to compete with virgin-polymer economics. Advisory and data analytics services, though still niche, are fast winning ESG-driven contracts from consumer goods multinationals.
By Waste Type:
Municipal Solid Waste Dominates as E-Waste SurgesMunicipal solid waste (MSW) generated 56.78% of 2025 revenue, cementing its role as the core feedstock for the ASEAN waste management market. Daily MSW in Indonesia tops 200,000 t, and only 60% is formally managed, highlighting latent capacity for private haulers. The ASEAN waste management market size allocated to e-waste, however, is expanding at a 7.33% CAGR. Smartphone penetration exceeds 80% in Singapore and approaches 70% in Thailand; replacement cycles of 24 months translate into growing volumes of printed circuit boards rich in copper and rare earths.
Hazardous industrial waste handling revenue is rising as apparel dye houses and semiconductor fabs move deeper into Southeast Asia. Plastic leakage remains acute; OECD scenarios warn that regional ocean plastic may swell 70% by 2050 without interventions. Medical waste volumes surged during pandemic peaks and remain elevated as hospital networks expand. Construction debris management increasingly incorporates on-site crushers and mobile sorting units, reducing haul distances and carbon footprints.
Geography Analysis
ASEAN Waste Management Market
Indonesia retained 35.52% ASEAN waste management market share in 2025, powered by a population of 270 million and Presidential Regulation 98/2021, which monetizes carbon reductions via a domestic exchange. Jakarta now tenders 12 WtE projects, each backed by long-term power-purchase agreements, while provincial cities replicate the model. Thailand’s plastic-import ban, effective January 2025, compels local capacity expansion and raises gate fees, improving project economics. Vietnam’s Decree 05/2025/ND-CP elevates EPR obligations and gives recyclers a clearer cash flow outlook, catalyzing foreign direct investment in polymer re-processing.
Malaysia targets a national 40% recycling rate by 2025, up from 35.38% in 2023, and plans 18 WtE facilities by 2040, signaling steady offtake for technology vendors. Singapore remains the regulatory benchmark with mandatory reporting for food and packaging waste, boosting digital-compliance service demand. Rest-of-ASEAN economies, including Cambodia, Laos, and Myanmar, log the fastest combined growth at a 6.88% CAGR as multilateral aid bankrolls pilot material-recovery facilities and 3R demonstrations.
Cross-border arbitrage in tipping fees persists, especially along Malaysia–Singapore, encouraging illegal shipments and undercutting domestic recyclers. Harmonizing tariff structures could reduce leakage and raise formal treatment volumes in the ASEAN waste management market. National climate pledges, such as Indonesia’s net-zero by 2060, align waste management with decarbonization spending, unlocking green-bond issuances tied to landfill-gas capture and recycling upgrades.
Regulatory Landscape
ASEAN waste policy continues to push for circular economy and producer responsibility. Vietnam issued Decree No. 110/2026/ND-CP in April 2026, with effect May 25, 2026, detailing responsibilities for products, packaging and waste treatment under the Law on Environmental Protection and reinforcing mandatory EPR requirements that formalize funding flows to collection and recycling.
Malaysia is shifting toward state-level governance and digital oversight of scheduled waste. Parts of Sarawak's Sustainable Resources and Wastes Management Ordinance, 2025 commenced in January 2026, and Malaysia's Environmental Quality (Amendment) Bill 2026 enables Sabah and Sarawak to exercise autonomous legislative authority over scheduled waste management. These moves, combined with digital waste-monitoring systems including Sabah's Electronic Scheduled Waste Information System slated for full launch in 2026, raise the bar for licensed operators on reporting, tracking, and audit-ready documentation, while import controls for plastic scrap (Thailand's January 2025 ban cited in the report context) reinforce the pivot toward domestic recovery capacity.
Value Chain Analysis
The ASEAN waste management value chain spans waste generation (residential, commercial, industrial), first-mile collection (often fragmented and informal), aggregation and transfer, sorting and pre-treatment (MRFs, organics segregation, RDF preparation), and downstream treatment pathways (recycling/resource recovery, landfill, incineration/WtE, and hazardous-waste treatment). Municipalities and state agencies remain pivotal buyers through tenders and concessions, while EPR policies increasingly insert producers and Producer Responsibility Organizations (PROs) into financing and performance verification. A recurring bottleneck is traceability across informal recovery networks, which limits verification for EPR and restricts access to premium offtake markets that demand chain-of-custody documentation.
Capital-intensive midstream and downstream nodes are increasingly structured as PPP-style concessions, pulling engineering, technology, and long-term operations into bundled contracts. Examples include Malakoff Corporation Berhad's 34-year concession (June 2025) with Malaysia's KPKT and SWCorp for the 1,056-tonne-per-day Sungai Udang WtE facility (construction scheduled for 2026), and Indonesia's South Tangerang WtE project awarded in March 2025 to PT Indoplas Energi Hijau (OASA subsidiary) using China Tianying Inc technology to process 1,100 tons per day.
Competitive Landscape
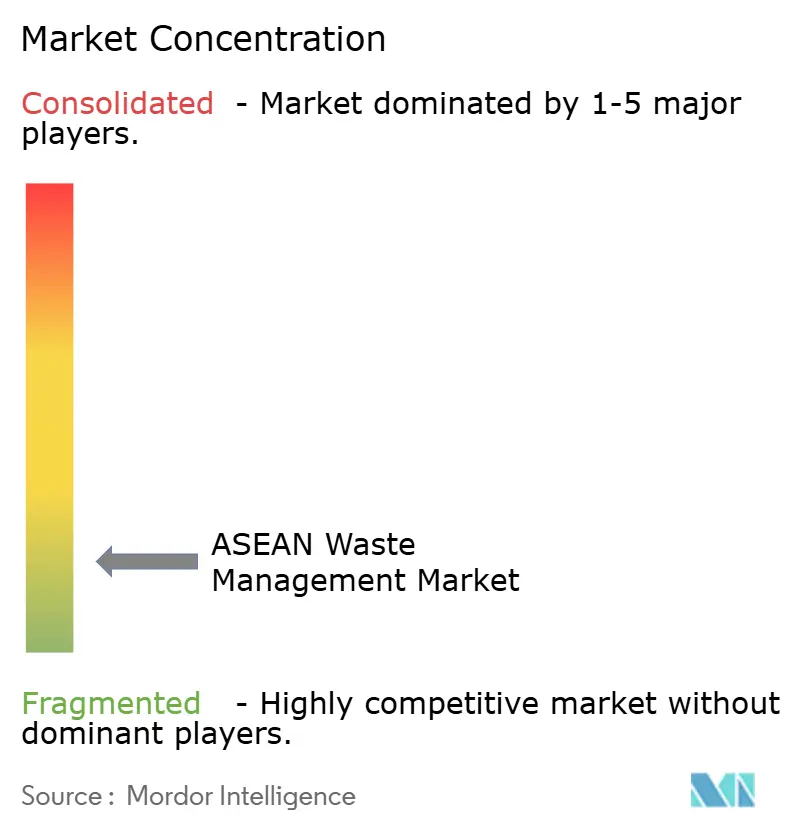
The ASEAN waste management market remains highly fragmented; the top five operators control well under 30% of combined revenue. Informal collectors and small fleet owners dominate first-mile pickups, while bigger players such as Veolia, SUEZ, and Sembcorp secure long-term build-operate contracts. SUEZ’s Manila Bay wastewater project will process 180 million liters per day, reflecting water-waste convergence synergies. Veolia booked USD 12.5 billion (EUR 11.556 billion) in Q1 2024 revenue, with water-tech sales up 15%, showing how global incumbents leverage ESG capital inflows.
Digital disruptors deploy AI route planning, blockchain tracking, and plastic-credit exchanges. They partner with FMCG brands to meet audit-ready compliance, gradually eroding share from traditional haulers. Feed-in-tariff clarity in Vietnam and Indonesia is birthing WtE-specialist joint ventures backed by Japanese EPCs. Rural waste remains underserved; micro-franchise models that equip villages with balers and compactors are emerging. Certification (ISO 14001, SMK3) increasingly influences tender awards, propelling professionalization. Overall, the market’s concentration score stands at 3, reflecting a fragmented field in which the top ten players hold well below 30% collective share.
ASEAN Waste Management Industry Leaders
-
Sembcorp Environmental Management Pte. Ltd. (Singapore)
-
Veolia Environmental S.A
-
SUEZ
-
PT Prasadha Pamunah Limbah Industri (PPLI)
-
Colex Holdings
- *Disclaimer: Major Players sorted in no particular order
ASEAN Waste Management Market Companies Covered in this Report
- Sembcorp Environmental Management
- Veolia Environment SA
- SUEZ
- PT Prasadha Pamunah Limbah Industri (PPLI)
- Colex Holdings
- Remondis
- ALBA Group Asia
- Indorama Ventures (PET Recycling)
- Blue Planet Environmental Solutions
- Greenway Environmental
- Starpal
- Boon Poh Refuse Disposal
- Binh Duong Water-Environment (BIWASE)
- Metro Waste Philippines
- Dangote Waste Management Myanmar
- Waste4Change Indonesia
- Khun Recycle Thailand
- Saigon Green Technology
- Siam Cement Group (SCG) – Circular Economy Unit
- Republic Services Singapore JV
Market Opportunities and Future Outlook
Mandatory EPR rollouts and the build-out of PRO-oriented operating models create direct whitespace for operators that can deliver audited collection, verified recycling, and digital reporting across multiple waste streams. Vietnam's Decree No. 110/2026/ND-CP (effective May 25, 2026) establishes a centralized and transparent EPR framework for multiple product and packaging groups, increasing the need for qualified service partners that can document volumes, contamination rates, and end destinations.
Indonesia adds a second anchor for regional opportunity: in July 2026, the Environment Ministry announced a ministerial regulation requiring around 10,000 large manufacturers to fund waste management via local Packaging Recovery Organizations (PROs), expanding the commercial addressable market for traceable collection, MRF-linked aggregation, and compliance services. Large-scale WtE concessions and pre-treatment capacity also open opportunities in integrated contracts that combine waste intake, sorting and RDF preparation, energy recovery, and residues management. Malaysia's Sungai Udang project under Malakoff (1,056 tonnes per day, 34-year concession; construction scheduled for 2026) and Indonesia's South Tangerang WtE award (1,100 tonnes per day) illustrate an active pipeline that increases demand for feedstock conditioning and stable gate-fee structures. As import controls on plastic scrap tighten across the region (Thailand's January 2025 ban referenced in the report context), domestic recovery economics shift toward sorting quality, advanced recycling, and formalized linkages that integrate informal collectors into PRO-validated supply chains, supporting higher-value contracts with corporates that need audit-ready proof of diversion and recycling outcomes.
Recent Industry Developments in ASEAN Waste Management Market
- July 2026: Indonesia's state asset fund Danantara selected eight consortia for the second batch of waste-to-energy projects, including groups led by SUEZ and Veolia Environmental Services Asia. The selection advances a larger PPP-style pipeline and elevates competition for integrated development, operations, and feedstock aggregation capabilities across Indonesian cities.
- September 2025: Cora Environment (formerly SembWaste) announced a S$200 million investment commitment over five years to expand waste-to-resource and recycling capabilities following its acquisition by TBS Energi Utama. The program signals a push toward higher-value recovery services and strengthens the platform's ability to bid for bundled municipal and commercial contracts that require traceability and circularity outcomes.
- June 2024: SembWaste launched the Closed-Loop Partners Network in Singapore to drive collaboration among industrial and commercial stakeholders for circular transformation. The initiative supports more consistent offtake and data-sharing across the recovery chain, helping participants operationalize packaging and materials circularity targets through coordinated collection and processing.
ASEAN Waste Management Market Report Scope and Research Methodology
Market Definition and Coverage
This market is defined as the revenue generated from managing waste across ASEAN, starting from collection and transport and moving through sorting, treatment, recycling or recovery, and final disposal, based on services delivered for municipal and industrial waste streams.
Scope exclusions: We exclude informal and unreported waste handling activity, and we also exclude in-house waste management that is not priced as a service.
Segments Covered in This Report
- By Source
- Residential
- Commercial (retail, office, etc.)
- Industrial
- Medical (Health and Pharmaceutical)
- Construction & Demolition
- Others (institutional, agricultural, etc)
- By Service Type
- Collection, Transportation, Sorting & Segregation
- Disposal / Treatment
- Landfill
- Recycling & Resource Recovery
- Incineration & Waste-to-Energy
- Others (Chemical Treatment, Composting, etc.)
- Others (Consulting, Audit & Training, etc.)
- By Waste Type
- Municipal Solid Waste
- Industrial Hazardous Waste
- E-waste
- Plastic Waste
- Biomedical Waste
- Construction & Demolition Waste
- Agricultural Waste
- Other Specialized Waste (radio active, etc)
- By Geography
- Indonesia
- Thailand
- Vietnam
- Philippines
- Malaysia
- Singapore
- Rest of ASEAN Countries
Data Sources, Market Sizing, and Validation
Desk Research
Desk research is used to set the base context and to anchor the model to measurable waste generation and treatment realities across ASEAN. We referred to public sources such as World Bank solid waste publications, ASEAN and national environment ministry portals, national statistics offices, UN Comtrade trade tables for recyclable materials, and peer reviewed journals covering recycling and landfill performance.
To translate those signals into a market model, we also reviewed company annual reports, investor presentations, and reputable news coverage on policy rollouts, facility additions, and contract awards. When needed, paid subscriptions for company financials and intelligence, an import and export shipment level database, and global contracts and tenders were used to cross-check capacity announcements and service footprint details. This list is not exhaustive, and other sources were also used for data collection, validation, and research clarification.
Primary Interviews and Surveys
Primary work focused on validating service scope, pricing logic, and operational realities that are not consistently captured in public data for ASEAN. Inputs included typical collection coverage, tipping fee ranges, and how recycling revenue share is treated in contracts. We spoke with a mix of waste service operators, recyclers, facility developers, municipal stakeholders, and commercial waste generators across key ASEAN countries, so our assumptions could be checked against on-ground practices before finalizing the model.
Distribution of primary research fieldwork respondents
| Company type | Respondent position |
|---|---|
| Top tier: 30% | CXOs: 15% |
| Mid tier: 48% | Functional/Unit leaders: 36% |
| Smaller Players: 22% | Managers: 49% |
Market-Sizing & Forecasting
Sizing starts with a top-down build where country waste generation and collection coverage are reconstructed into a serviceable waste pool, and then split by common treatment pathways. After that, selective bottom-up checks are used, such as sampled price per ton by service line, discussions on municipal contracts, and roll-ups of known facility throughput to test whether totals look realistic.
Inputs used in the model include municipal solid waste generation volumes, collection penetration in urban versus non-urban areas, landfill share versus recycling and recovery share, typical tipping fees and collection tariffs, and announced capacity additions for material recovery, waste-to-energy, and engineered landfills. Where primary inputs vary by country, gaps are handled by applying proxy ratios from similar ASEAN markets and then correcting them through follow-up calls.
Forecasts are built using scenario analysis, because policy enforcement, fee revisions, and facility commissioning schedules can shift timing even when demand remains steady. Scenarios are supported by expert views on how fast formalization progresses, how quickly diversion targets are implemented, and how pricing moves with fuel and labor costs.
Data Validation & Update Cycle
Outputs are checked against independent signals such as per capita waste trends, known facility utilization, and the pace of municipal tendering activity, so the final numbers stay aligned with operating constraints. If a variance looks large, assumptions are revisited and respondents are re-contacted to confirm whether the change is structural or temporary.
Before sign-off, the model and narrative go through multi-step analyst reviews, including logic checks on units, growth rates, and country roll-ups. Reports are refreshed annually, with interim updates when material events occur, such as major regulation changes, large contracts, or unexpected disruptions. Right before delivery, a fresh review pass is completed so clients receive the most current view.
Mordor Intelligence's Asean Waste Management Market Size Compared With Other Published Estimates
Published market sizes for ASEAN waste management can differ widely, and the gap usually comes from how each publisher defines the revenue pool and the timing of the base year. Differences also show up when one model relies more on stated capacity plans, while another relies on realized collection and treatment throughput.
Some external estimates appear to focus more narrowly on formal municipal solid waste services and selected treatment methods, which can reduce totals. In Mordor Intelligence, the value is counted across collection, transport, sorting, treatment, recycling or recovery, and disposal revenues across the ASEAN countries covered, with informal and unpriced in-house activity excluded from market revenue.
Benchmark comparison
| Source | Market Size | Gaps in Research Methodology |
|---|---|---|
| Mordor Intelligence | USD 35.36 B (2026) | |
| Global Consultancy A | USD 9.50 B (2024) | Uses an earlier base year and a narrower paid-service lens that appears to emphasize select formal waste streams and pathways, which can undercount broader commercial and industrial service revenues in practice. |
| Industry Publisher B | USD 11.81 B (2026) | Frames the market around a smaller monetized pool and can differ on what is treated as service revenue versus pass-through value, plus it uses a different commissioning and utilization ramp for new facilities. |
The spread in values is mostly explained by scope choices, base-year timing, and how pricing and utilization are carried forward into the forecast. By keeping inputs tied to measurable waste volumes, treatment mix, and validated price ranges, our approach remains traceable and can be applied country by country when new data is released.
Key Questions Answered in the Report
What is the current size of the ASEAN waste management market?
The market is valued at USD 35.36 billion in 2026 and is projected to hit USD 48.52 billion by 2031.
Which country holds the largest share?
Indonesia leads with a 35.52% share, buoyed by its large population and active WtE pipeline.
Which segment is growing the fastest?
Recycling and resource recovery services are expanding at an 8.42% CAGR through 2031.
How does EPR affect operators?
EPR schemes provide predictable revenues for recyclers and push producers to finance end-of-life management, shifting costs away from municipalities.