
Die Casting Market Size and Share
Market Overview
| Study Period | 2020 - 2031 |
|---|---|
| Market Size (2026) | USD 92.61 Billion |
| Market Size (2031) | USD 130.17 Billion |
| Growth Rate (2026 - 2031) | 7.04% CAGR |
| Fastest Growing Market | Middle East and Africa |
| Largest Market | Asia-Pacific |
| Market Concentration | Medium |
Major Players *Disclaimer: Major Players sorted in no particular order Image © Mordor Intelligence. Reuse requires attribution under CC BY 4.0. | |
Die Casting Market Analysis by Mordor Intelligence
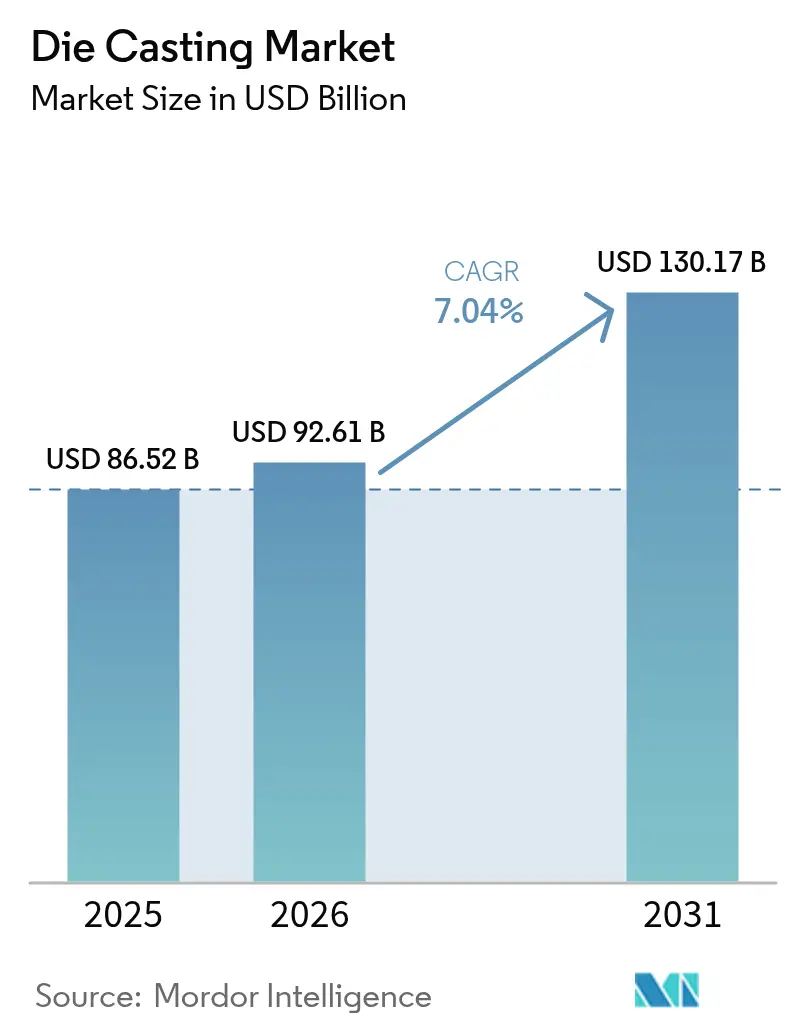
The die casting market size was valued at USD 86.52 billion in 2025 and estimated to grow from USD 92.61 billion in 2026 to reach USD 130.17 billion by 2031, at a CAGR of 7.04% during the forecast period (2026-2031). As electrification reshapes power-train needs, OEMs are replacing multi-piece stamp-and-weld assemblies with single, high-integrity castings that cut weight and part counts while preserving structural rigidity. This pivot keeps the die casting market resilient even as internal-combustion volumes plateau, because the content-per-vehicle in electric cars rises on the back of battery trays, motor housings, and under-body megacastings. Outside mobility, renewable-energy infrastructure, 5G rollouts, and automation programs sustain demand for complex, near-net-shape components. Competitive intensity tightens as tier-1 suppliers, pure-play foundries, and vertically integrating automakers race to master giga-press technology, deploy on-site renewables for cost control, and navigate looming PFAS bans in mold lubricants.
Key Report Takeaways
- By application, automotive held 61.73% of the die casting market share in 2025 and is expected to grow at an 8.02% CAGR during the forecast period (2026-2031).
- By process, pressure casting retains 55.02% revenue share in 2025, while vacuum casting is forecast to expand at a 8.93% CAGR during the forecast period (2026-2031).
- By raw material, aluminum commanded a 74.78% share of the die casting market size in 2025; magnesium is growing at a 9.53% CAGR during the forecast period (2026-2031).
- By casting-machine clamping force, 4,001-10,000 kN machines accounted for 53.08% share of the die casting market in 2025, whereas the ver 10,000 kN segment is projected to expand at 9.61% CAGR during the forecast period (2026-2031).
- By geography, Asia-Pacific captured 56.21% share of the die casting market in 2025; the Middle East & Africa region is poised to grow at 8.42% CAGR during the forecast period (2026-2031).
Note: Market size and forecast figures in this report are generated using Mordor Intelligence’s proprietary estimation framework, updated with the latest available data and insights as of 2026.
Global Die Casting Market Trends and Insights
Drivers Impact Analysis*
| Driver | (~) % Impact on CAGR Forecast | Geographic Relevance | Impact Timeline |
|---|---|---|---|
| ICE-to-EV Lightweighting Push | +1.8% | Global (early China, North America, Europe) | Medium term (2-4 years) |
| Near-Net-Shape Giga-Press Body | +1.2% | North America and China; spill-over to Europe | Long term (≥4 years) |
| Sensors For Zero-Defect First-Shot | +0.8% | APAC core, spreading to North America and Europe | Medium term (2-4 years) |
| Aluminum Recycling Mandates | +0.7% | Europe leading, North America and APAC trailing | Medium term (2-4 years) |
| On-Site Renewables Hedging Energy | +0.6% | High electricity-cost regions worldwide | Short term (≤2 years) |
| 3D-Printed Sand Cores for EV | +0.5% | Early use in North America and Europe; APAC following | Long term (≥4 years) |
| Source: Mordor Intelligence | |||


ICE-to-EV Structural-Parts Lightweighting Push
Battery-electric vehicles streamline their design with fewer components, yet they demand larger, integrated castings for essential structures such as battery housings, motor frames, and unified chassis sections. A prime example is Tesla's rear underbody megacasting, which consolidates several stamped parts. This underscores the rising strategic significance and value of die casting in each vehicle, regardless of fluctuations in overall production volumes. Studies indicate structural megacasting can reduce curb weight by 10-15%, bringing critical range benefits while lowering assembly complexity [1]Organization for Economic Co-operation and Development, “Electric Vehicle Lightweighting Strategies,” oecd.org.
Near-Net-Shape Pressure-Die-Casting for Giga-Press Body-in-White
Ultra-large giga-presses now create single-piece structures, a feat that once demanded multiple welded components. While traditional automakers are integrating these presses into their new electric vehicle platforms, smaller foundries grapple with challenges like high initial scrap rates and expensive die adjustments. Meanwhile, advanced equipment lines are achieving quicker cycle times, a move that mitigates hefty capital costs and pushes the die-casting industry towards consolidating into fewer, yet significantly larger, production cells.
In-Mold Sensors Enabling Zero-Defect “First-Shot” Quality
AI-driven models now leverage real-time data on pressure, temperature, and flow to forecast defects before solidification concludes. This proactive approach not only curtails scrap rates more effectively than traditional high-pressure lines but also protects profit margins amidst rising alloy costs and the trend of larger components. Additionally, it enhances operational efficiency by enabling manufacturers to optimize production processes and reduce downtime. As a result, this technology is swiftly emerging as a crucial tool for tier-1 suppliers aiming to meet rigorous automotive quality standards.
Circular-Economy Aluminum-Recycling Mandates Spur Secondary HPDC Demand
Major regions are now mandating minimum recycled content levels in aluminum components for both automotive and consumer goods, thanks to circular-economy regulations. These regulations aim to reduce environmental impact and promote sustainable practices. As a result, there's been a notable uptick in the demand for secondary high-pressure die-casting capacity, which is essential for meeting these new requirements. Recycled aluminum cuts energy consumption versus primary smelting, so OEMs use it to meet Scope 3 carbon-reduction targets while shielding themselves from volatile ingot prices[2]“Circular Economy Action Plan: Aluminium Recycling Requirements,” European Commission, europa.eu. Foundries respond by installing advanced sort-and-melt lines that separate post-consumer scrap, feed clean billets into cold-chamber cells, and certify traceability under ISO 14021 guidelines. The process yields cost savings, enabling competitive bids on large structural EV castings that previously relied on virgin alloy feedstock.
Restraints Impact Analysis*
| Restraint | (~) % Impact on CAGR Forecast | Geographic Relevance | Impact Timeline |
|---|---|---|---|
| Post-2026 China Magnesium Controls | −1.1% | Global, the highest effect in North America and Europe | Medium term (2-4 years) |
| PFAS-Based Lubricant Restrictions | −0.9% | Strictest in North America and Europe | Short term (≤2 years) |
| OEM Insourcing via Giga-Pressing | −0.8% | North America and China core | Long term (≥4 years) |
| EU Carbon Border Taxes | −0.6% | Direct in Europe, spill-over worldwide | Short term (≤2 years) |
| Source: Mordor Intelligence | |||
Post-2026 Magnesium Supply Risk from China Export Controls
China continues to lead as the primary source of magnesium. However, recent export licensing measures from the country hint at tighter supply controls. Such moves could potentially disrupt downstream casting contracts. Western smelters, taking years to ramp up, are grappling with price volatility, complicating long-term vehicle platform planning. Programs in the automotive and aerospace sectors, which have relied on magnesium's lightweight benefits over aluminum, now confront difficult decisions: redesigning components or stockpiling the material.
Tightening PFAS Emissions Norms on Lubricants
The United States EPA now requires full PFAS usage disclosure under TSCA Section 8(a)(7). Fluorinated mold-release agents deliver unmatched thermal stability above 300 °C, but replacement formulations often need more frequent spraying, raising labor cost and cycle time. Compliance spending—testing, worker training, and new spray equipment—can consume up to 5% of a mid-size foundry’s annual budget[3]“PFAS Reporting Rule under TSCA Section 8(a)(7),” U.S. Environmental Protection Agency, epa.gov.
*Our forecasts treat driver/restraint impacts as directional, not additive. The impact forecasts reflect baseline growth, mix effects, and variable interactions.
Segment Analysis
By Application: Automotive Megacasting Reshapes Demand
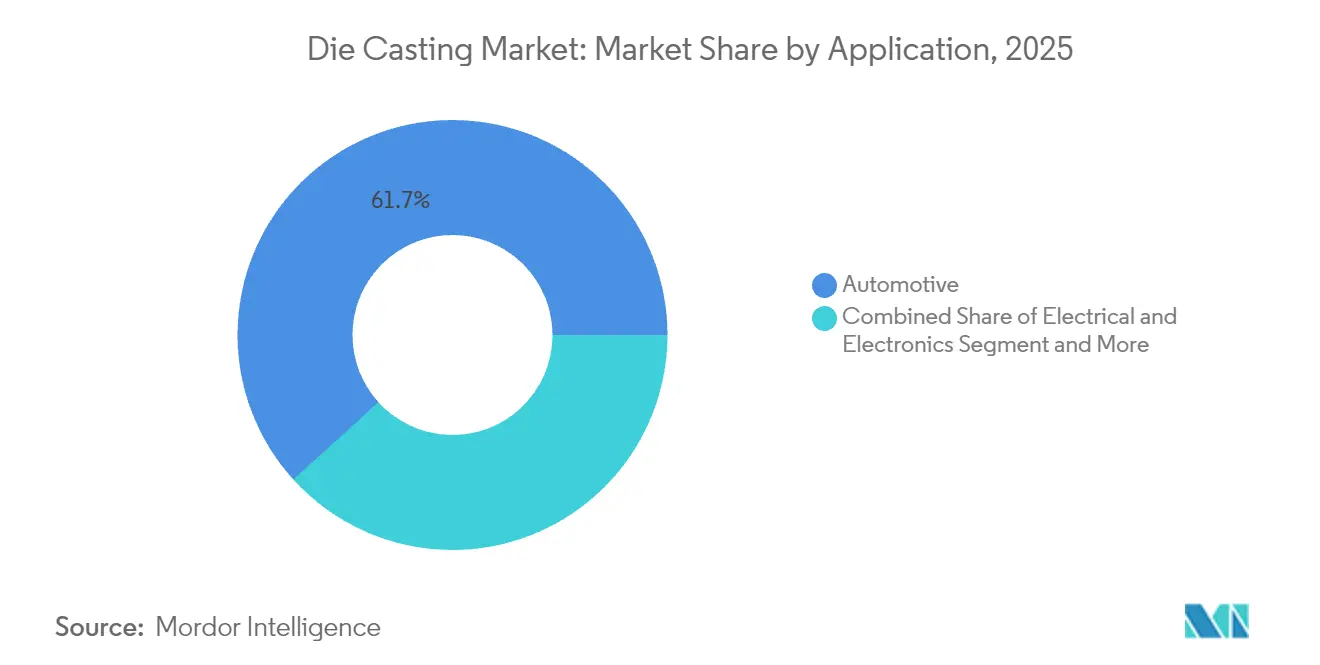
Automotive applications contributed 61.73% of 2025 revenues and will deliver an 8.02% CAGR to 2031, illustrating how EV structural content offsets ICE decline. The die casting market size for battery enclosures, motor housings, and under-body castings will grow significantly by the end of the forecast period. Automakers are consolidating dozens of stamped components into just a few large castings, leading to a shift in sourcing strategies. They're now favoring suppliers adept at giga-press operations, especially those with flawless startup cycles. Beyond the automotive realm, sectors like renewable energy and telecom are witnessing a steady uptick in demand.
Meanwhile, the aerospace industry is showing heightened interest in titanium and high-strength aluminum, eyeing them for next-generation airframes. This industry-wide transition is spurring intensified R&D efforts into ductile alloys and vacuum-assisted filling, all in a bid to meet stringent crash safety standards. Tier-1 suppliers, previously centered on engine parts, are now pivoting. They're retrofitting furnaces and setting up massive casting cells, focusing on structural components and battery trays. Such trends are elevating entry barriers for smaller foundries and nudging the industry towards integrated hubs, seamlessly blending machining and assembly close to OEM body shops.


By Process: Vacuum Technology Gains Ground
While pressure casting still owns 55.02% of 2025 billings, vacuum casting will clock a 8.93% CAGR as safety-critical EV structures require heat-treatable, weldable parts. When pore content falls 60-80%, automakers can T6-treat aluminum parts without blow-out risk and laser-weld them into multi-material frames. That capability lifts price realizations by up to 30% per kilogram, keeping margin potential high even where alloy cost rises. Consequently, the die casting market sees plants adding vacuum chambers or converting cold-chamber cells to hybrid configurations.
Longer term, squeeze casting and semi-solid processes address niche aerospace and heavy-truck steering knuckles that need forged-like microstructures. Yet their cycle times remain slower, so high-volume industries still favor pressure or vacuum options supplemented by in-die cooling and intensified process monitoring.
By Raw Material: Aluminum Still Rules, Magnesium Accelerates
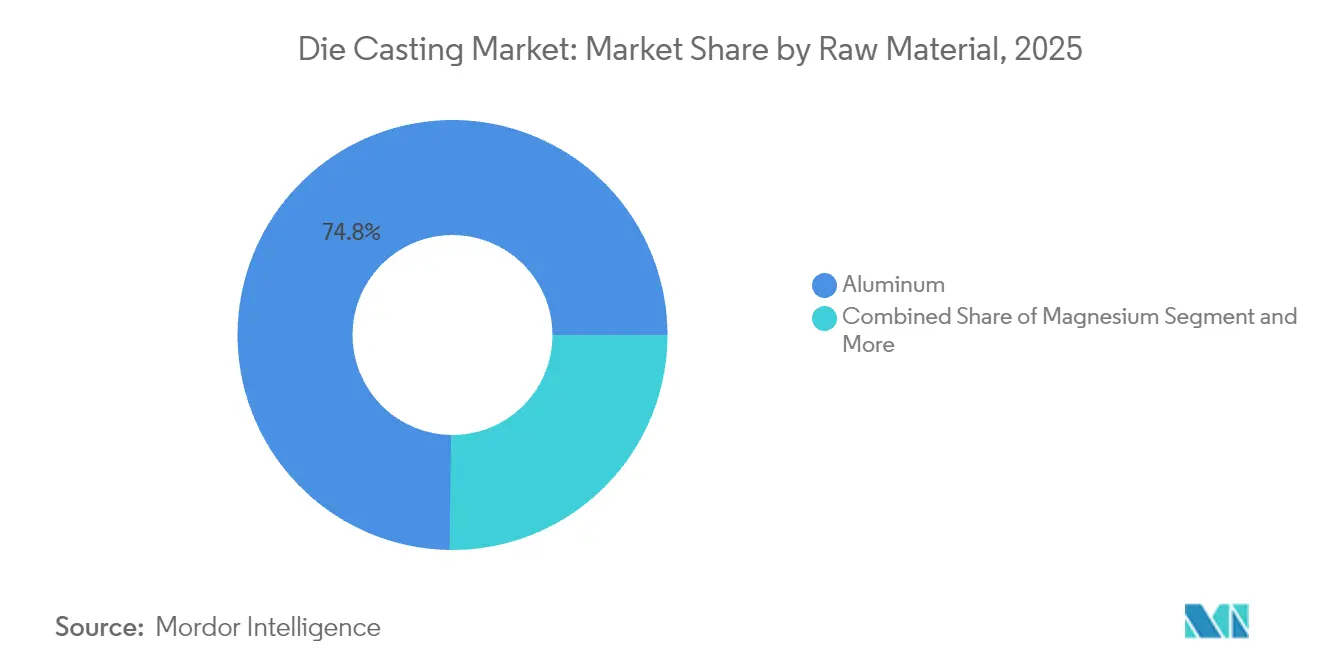
Aluminum retained 74.78% command in 2025 owing to robust secondary supply chains that slash carbon output 95% versus new smelting. Regulatory targets for recycled content help aluminum hold ground, yet the 9.53% CAGR in magnesium volumes underscores a quest for deeper weight savings. The die casting market size for aluminum parts in electric SUVs will expand in the coming years, whereas magnesium’s lightweight advantage keeps attracting aerospace cabin and seat suppliers despite supply-chain risk.
Zinc sustains hardware and consumer goods where its fluidity and dimensional stability shine, while copper alloys serve thermal-management bases in power-electronics modules. Rising EU circular-economy thresholds, however, push OEMs to audit alloy provenance, rewarding cast houses that certify recycled inputs.
By Casting-Machine Clamping Force: High-Tonnage Cells Surge
Cells rated 4,001-10,000 kN contributed 53.08% of 2025 turnover because they balance flexibility with capacity. Even so, presses above 10,000 kN will post a 9.61% CAGR to 2031 as megacasting reshapes assembly lines. Notable number of giga-presses have been booked worldwide, and each installation, often costing at the higher-end, triggers adjacent investment in robots, quench tanks, and X-ray quality stations. Foundries that secure long-term EV platform awards commit to single-supplier press strategies to ensure die-to-die consistency, cementing deeper OEM-foundry partnerships within the die casting market.
Small machines under 4,000 kN continue serving electronics, medical, and precision-pump components where tighter wall-thickness tolerances outrank sheer volume. These cells also evolve, adopting in-machine temperature mapping and automated quick-die-change tables to limit downtime.
Geography Analysis
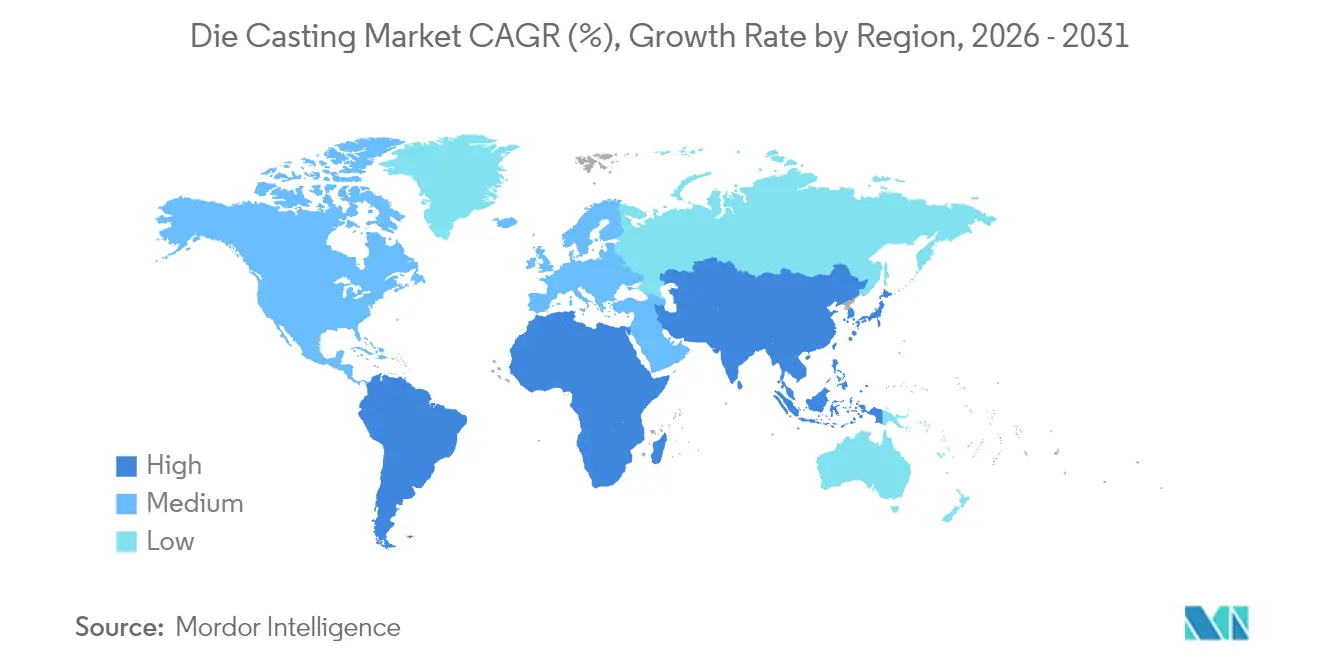
Asia-Pacific generated 56.21% of global sales in 2025, anchored by China’s vast auto, appliance and electronics clusters. Decades of cumulative know-how, high scrap-aluminum availability, and vertically integrated tool-steel ecosystems keep cost positions sharp. Korea and Japan contribute control-system innovation, while India rides production-linked incentives that fund new lightweight-component lines. As OEMs diversify sourcing, Southeast Asia gains share for low-complexity parts and back-up capacity, broadening the die casting market footprint across ASEAN.
The Middle East & Africa region is the fastest riser at 8.42% CAGR. Gulf Cooperation Council states use Vision 2030 funds to manufacture solar inverters, wind housings, and EV chargers domestically. Megaprojects like NEOM draw demand for high-tonnage presses able to cast aluminum façade nodes and structural connectors. Turkey’s auto exports and Egypt’s industrial-park policies further energize regional orders, though upstream ingot supply relies on imports until smelters scale.
North America and Europe grow chiefly through technology shifts rather than plant count. United States tax credits favor domestic battery and drivetrain sourcing, causing OEMs to localize megacasting next to assembly plants in Ohio, Alabama, and Ontario. Europe’s Carbon Border Adjustment Mechanism boosts competitive standing for regional shops running recycled aluminum furnaces on renewable power. Both regions further the die casting market by enforcing PFAS phase-outs and lifecycle carbon audits, spurring capital upgrades and digital traceability modules.
Mordor Intelligence provides coverage of the die casting market across other key regional markets. Detailed country-level analysis extends to South Korea incorporating local coverage and market participation, as required.

Regulatory Landscape
Regulation affecting die casting is increasingly tied to product carbon footprint disclosure, recycled content, and restricted substances used in foundry operations. In the United States, the EPA PFAS reporting rule under TSCA Section 8(a)(7) has increased compliance requirements around fluorinated mold-release agents. This has pushed many die casters to document chemical use and qualify alternative lubricants that can maintain thermal stability in high-temperature casting cycles.
Trade and circular-economy policy is also reshaping cross-border sourcing for aluminum-intensive cast components. The EU Carbon Border Adjustment Mechanism (CBAM) moved into full force on January 1, 2026, increasing the need for emissions and materials traceability on imported steel and aluminum embedded in downstream automotive parts. In China, the China Foundry Association implemented T/CFA 0501-2026 Green Casting Evaluation Standard in March 2026, emphasizing carbon footprint accounting and VOC monitoring, which aligns with EU buyer requests for supplier self-assessment disclosures as OEMs tighten procurement scorecards.
Value Chain Analysis
The die casting value chain runs from primary and secondary metal supply (aluminum, magnesium, zinc, and copper alloys) through melting and alloying, die and tooling manufacture (tool steel, inserts, coatings), and casting production (HPDC/pressure, vacuum, gravity, squeeze, and integrated mega/giga casting). Downstream steps include trimming, heat treatment where applicable, machining, surface finishing, inspection (including X-ray/CT for safety-critical structures), and module assembly before shipment to OEMs and tier suppliers. Automotive megacasting shifts more value toward high-tonnage machine OEMs, die designers, and process-control ecosystems (in-mold sensors and data platforms), while also increasing the importance of integrated machining and metrology near vehicle assembly plants to reduce logistics and manage large-part handling.
Key constraints typically sit at alloys, tooling lead times, and startup yield on large structural parts. Integrated die casting requires very high clamping forces (often above 6,000T) and stable melt quality to control defects such as oxide bifilms, weld lines, and warpage, which in turn increases demand for specialized alloys and tighter process windows. Recent OEM-led investments, such as Dongfeng Motor Corporation commissioning an integrated die-casting workshop in 2025 with 10,000-tonne and 16,000-tonne machines and moving integrated die-cast battery housings into mass production in May 2026, show how capacity, tooling, and quality systems are being clustered inside EV manufacturing hubs. This is raising pressure on independent foundries that historically supplied multi-part, smaller castings.
Competitive Landscape
The die casting market remains moderately fragmented, yet megacasting’s capital demands push consolidation. Large diversified groups have acquired niche foundries to secure vacuum capacity and giga-press know-how. Meanwhile, automakers insource signature structures to lock in IP and shorten supply chains, pressuring tier-1 volume.
Strategic moves include a major North American supplier installing 9,000-ton presses adjacent to an OEM body shop, while a European lightweight specialist divested conventional engine block lines to focus on EV battery trays. Technology edge is decisive. Suppliers offering design-for-casting co-engineering, 3D-printed sand cores, and AI-driven defect prediction win longer, higher-margin contracts.
Sustainability credentials matter too: plants powered 50% or more by on-site renewables secure premium OEM score-card ratings. Finally, additive-manufacturing entrants print intricate core inserts that cut tooling lead times by weeks, nudging incumbents to form alliances or licensing deals.
Die Casting Industry Leaders
Form Technologies Inc. (Dynacast)
Nemak S.A.B. de C.V.
Georg Fischer Ltd
Pace Industries Inc.
Endurance Technologies Limited
- *Disclaimer: Major Players sorted in no particular order


Market Opportunities and Future Outlook
A primary whitespace area is the buildout of high-tonnage, integrated casting cells that can deliver automotive structural parts with repeatable first-shot quality, together with downstream capability to machine and validate these parts at scale. Evidence for this shift includes Dongfeng Motor Corporation commissioning an integrated die-casting production line in Wuhan in January 2026 that includes 10,000-ton and 16,000-ton capacity, and then moving integrated die-cast battery housings into mass production in May 2026. Together, these steps reinforce demand for suppliers that can provide large dies, robust vacuum and thermal control packages, and inspection solutions suited to safety-critical components.
A second opportunity sits in localized tooling and process ecosystems that shorten die iteration cycles and reduce scrap during ramp-up, particularly in regions building domestic EV supply chains. Investments such as ZF allocating EUR 35 million for large-scale casting facilities and equipment at its Nuremberg foundry (February 2026) and Shinhwa Auto USA committing USD 37 million to expand its Auburn, Alabama operation while integrating Italian toolmaker SAPP S.p.A. (March 2026) point to active programs to regionalize both casting capacity and precision tooling. In parallel, regulatory pull from recycled-content and carbon-traceability requirements, notably in Europe, supports premium positioning for die casters that can certify recycled aluminum inputs and provide auditable emissions data across melt, casting, and machining steps.
Recent Industry Developments
- July 2026: Georg Fischer Ltd announced the sale of its aerospace and industrial gas turbine precision casting division to Cleveland-based CPP, with closing targeted toward the end of 2026. The divestment continues GF's reshaping away from metal casting, reinforcing a market shift where capacity and capital are reallocated toward core segments and opening room for specialist casters to acquire assets and customer programs.
- March 2026: Dynacast (Form Technologies) acquired Mexico-based Platinadora Baja to expand aluminum die casting capacity and add downstream manufacturing processes. The deal strengthens integrated manufacturing and vertical integration, supporting customers that want castings delivered with more finishing and component-level readiness.
- February 2026: Nemak completed the acquisition of GF Casting Solutions' automotive business on February 12, 2026, adding nine production facilities across Austria, China, Germany, Romania, and the United States. The transaction enlarges Nemak's footprint in automotive casting and supports scale in structural and chassis components as OEMs consolidate supplier bases for EV programs.


Research Methodology Framework and Report Scope
Market Definition and Coverage
This market covers the value of die cast components made using reusable metal dies, where molten metal is injected or fed into the die and ejected as a near-net-shape part. It is treated as a global market in USD.
Scope exclusions: We exclude sand casting, investment casting, and other non-die casting forming routes, and we also exclude downstream machining-only revenues billed separately from the casting sale.
Segmentation Overview
- By Application
- Automotive
- Electrical and Electronics
- Industrial Machinery
- Aerospace and Defense
- Consumer Appliances
- Others
- By Process
- Pressure Die Casting
- Vacuum Die Casting
- Squeeze Die Casting
- Gravity Die Casting
- By Raw Material
- Aluminum
- Magnesium
- Zinc
- Copper
- Others (Lead, Tin Alloys)
- By Casting-Machine Clamping Force
- ≤4,000 kN
- 4,001-10,000 kN
- Above 10,000 kN
- By Geography
- North America
- United States
- Canada
- Rest of North America
- South America
- Brazil
- Argentina
- Rest of South America
- Europe
- Germany
- United Kingdom
- France
- Italy
- Spain
- Russia
- Rest of Europe
- Asia-Pacific
- China
- Japan
- India
- South Korea
- Thailand
- Indonesia
- Malaysia
- Australia
- Rest of Asia-Pacific
- Middle-East and Africa
- United Arab Emirates
- Saudi Arabia
- Turkey
- Egypt
- South Africa
- Rest of Middle-East and Africa
- North America
Data Sources, Market Sizing, and Validation
Desk Research
Desk work started with public production and demand signals that can be checked each year without special access. We used sources such as industrial production and trade data from the US Census Bureau and UN Comtrade, along with automotive build and sales statistics from OICA, plus macro indicators published by the World Bank and OECD.
To keep assumptions aligned with real adoption patterns, we also reviewed technical and standards context from groups such as ISO, along with peer-reviewed papers covering die casting yields, alloy usage, and defect rates. Company annual reports, investor presentations, and reputable industry press were then used to map capacity additions, end-market exposure, and regional mix. Where needed, our team also referenced paid subscriptions for company financials and for shipment-level import and export checks, and the source list mentioned here is illustrative rather than exhaustive.
Primary Interviews and Surveys
Primary work was used to pressure-test the desk assumptions on utilization, scrap, and price realization across aluminum, magnesium, and zinc castings. We spoke with a mix of die casters, material suppliers, and downstream buyers across APAC, EMEA, and the Americas, so regional differences in mix and cycle times could be reflected in the model.
Distribution of primary research fieldwork respondents
| Company type | Respondent position | Region |
|---|---|---|
| Top tier: 33% | CXOs: 20% | APAC: 53% |
| Mid tier: 46% | Functional/Unit leaders: 38% | EMEA: 29% |
| Smaller Players: 21% | Managers: 42% | Americas: 18% |
Market-Sizing & Forecasting
Sizing was built using both top-down and bottom-up logic, with the main build coming from a top-down reconstruction of demand pools by major end-use output and regional manufacturing intensity. We translated those demand pools into die casting value using practical conversion factors, and then totals were stress-tested using selective bottom-up checks such as sampled volume-by-part families and typical price bands shared by industry participants.
Key inputs used in the model include automotive and industrial production trends, lightweighting intensity in vehicles (including larger structural castings), alloy mix shifts across aluminum, magnesium, and zinc, casting machine availability and clamping-force mix as a proxy for part complexity, and regional export-import flows for cast products and related components. When a bottom-up check was thin in a country, the gap was handled through regional peer benchmarks, adjusted for end-market mix and observed trade dependence.
For forecasting, we relied on scenario analysis supported by simple multivariate relationships between end-market output, metal price direction, and expected changes in die casting penetration by application. Assumptions on price progression and utilization were revisited after primary discussions, so the forecast stayed realistic for how plants actually ramp capacity.
Data Validation & Update Cycle
Outputs were validated through multiple cross-checks, including comparing implied per-unit casting value against observed part content ranges and reviewing whether regional growth matched visible capacity announcements and trade movement. If a country or application showed an unusual swing, the inputs were rechecked, and follow-up discussions were triggered to confirm whether it was a one-off event or a real shift.
Before sign-off, the model goes through a multi-step internal review so calculation logic, unit consistency, and currency assumptions are aligned. We refresh the report annually, and interim updates are made when material events occur, followed by a final pre-delivery pass so clients receive the latest view.
Mordor Intelligence's Die Casting Market Sizing Compared With Other Published Estimates
Published numbers for die casting do not always match because the market scope is not drawn the same way across studies, and the underlying demand signals can be taken from different end-use pools. Even when the same label is used, differences in what is counted as die casting value, and how pricing is carried forward, can push the final total up or down.
End-market production trends, regional trade flows for cast products, and capacity utilization feedback from industry participants are the checks that keep Mordor Intelligence's estimate tied to realized die casting demand, rather than a broad metal or components bucket. The largest gap drivers we see are whether a study includes gravity casting under the same headline, how it treats downstream machining and finishing revenue, and whether it uses steady ASP escalation versus metal-linked price movement with regional currency timing.
Benchmark comparison
| Source | Market Size | Gaps in Research Methodology |
|---|---|---|
| Mordor Intelligence | USD 92.61 B (2026) | |
| Global Consultancy A | USD 101.18 B (2026) | This estimate appears to use a broader value scope that can pull in adjacent casting and finishing revenues, and it may apply a more aggressive price progression into the base year, which lifts the total even if volumes are similar. |
| Industry Publisher B | USD 80.23 B (2025) | This figure is anchored to an earlier base year and can understate the market if newer EV-related casting intensity and recent capacity ramps are not fully captured, and if process coverage is expanded but pricing assumptions stay conservative. |
Looking at the spread, the differences are mainly explained by what is counted as die casting revenue versus adjacent manufacturing steps, plus how quickly prices and utilization are allowed to adjust year to year. By keeping the variables tied to observable production, trade, and utilization signals, our estimate stays traceable to inputs that can be rechecked and repeated.


Key Questions Answered in the Report
How large is the die casting market in 2026?
The die casting market size is USD 92.61 billion in 2026, on track for USD 130.17 billion by 2031.
Which segment grows fastest through 2031?
Machines above 10,000 kN clamping force post the quickest rise at 9.61% CAGR as megacasting gains scale.
Why is automotive demand still rising in die casting?
Electric vehicles need large, integrated aluminum castings for battery and chassis structures, so content-per-vehicle climbs even while ICE components decline.
Which region leads die casting production?
Asia-Pacific holds 56.21% of global revenue thanks to mature supply chains and high aluminum recycling capacity.
Page last updated on:




