Automotive 3D Printing Market Size and Share
Market Overview
| Study Period | 2021 - 2031 |
|---|---|
| Market Size (2026) | USD 6.85 Billion |
| Market Size (2031) | USD 14.39 Billion |
| Growth Rate (2026 - 2031) | 15.97% CAGR |
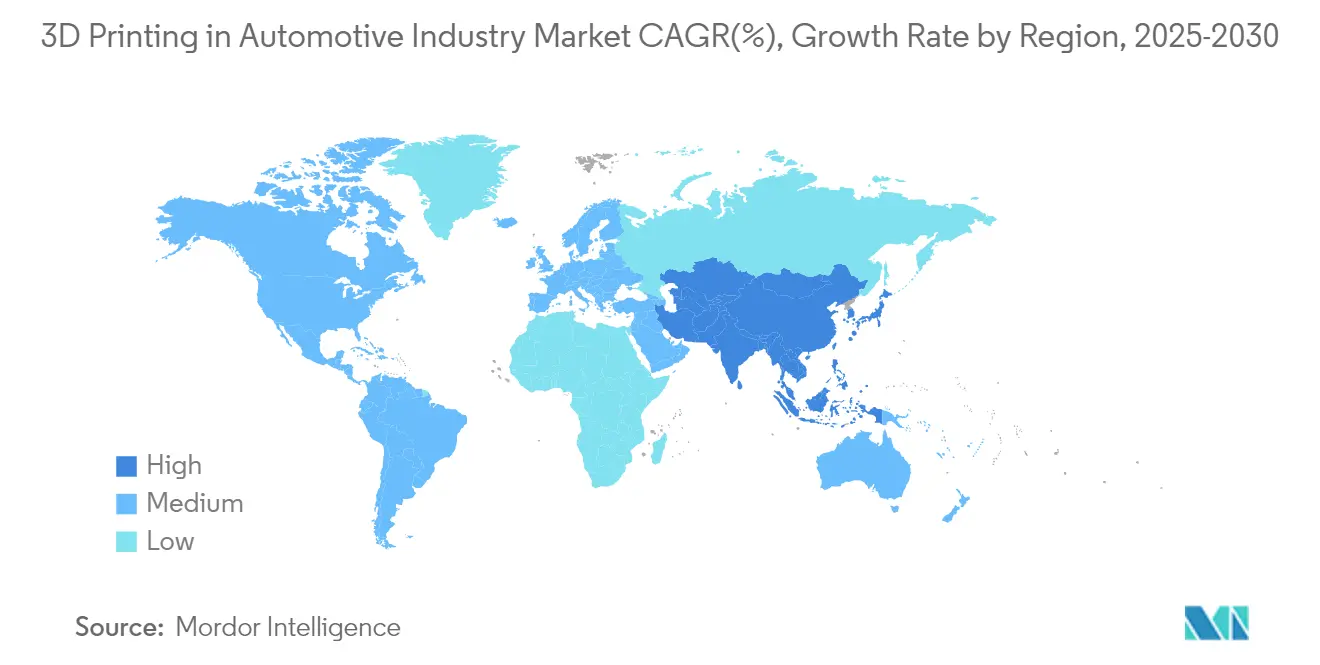
| Fastest Growing Market | Asia Pacific |
| Largest Market | North America |
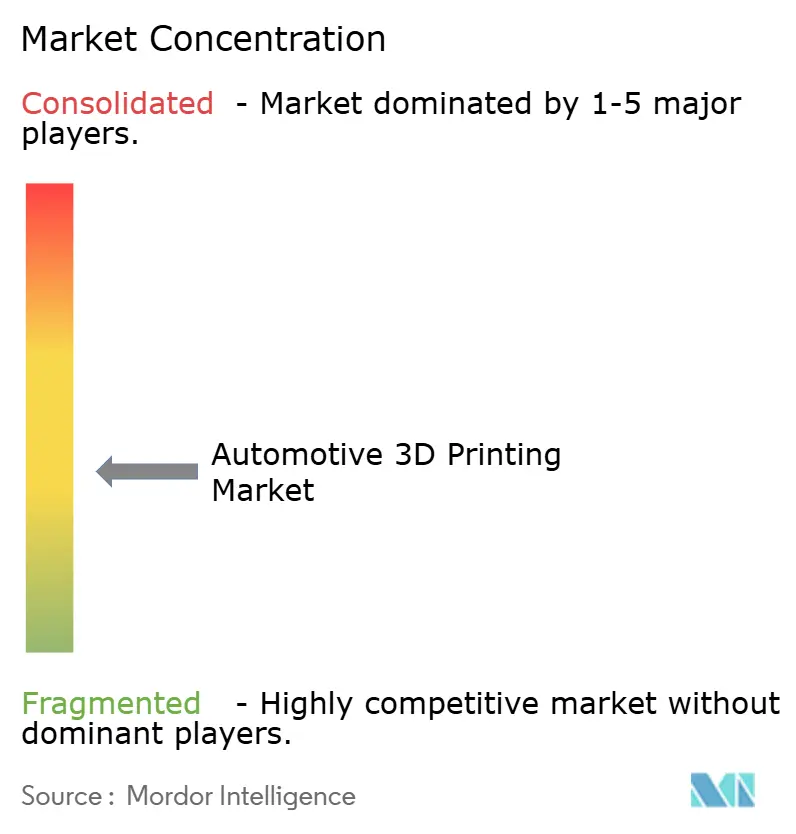
| Market Concentration | Medium |
Major Players *Disclaimer: Major Players sorted in no particular order Image © Mordor Intelligence. Reuse requires attribution under CC BY 4.0. | |
Automotive 3D Printing Market Analysis by Mordor Intelligence
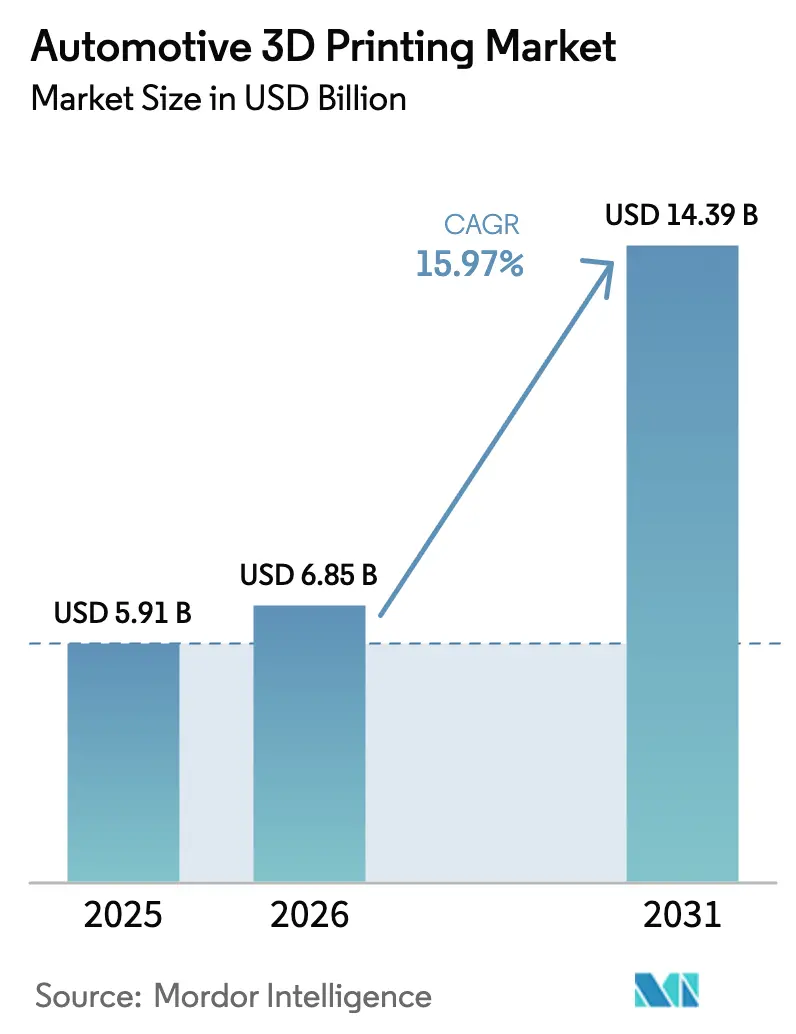
The Automotive 3D printing market size was valued at USD 5.91 billion in 2025 and estimated to grow from USD 6.85 billion in 2026 to reach USD 14.39 billion by 2031, at a CAGR of 15.97% during the forecast period (2026-2031). The shift from prototyping toward full-scale production is accelerating as breakthroughs in multi-material processing, digital supply-chain orchestration, and artificial-intelligence-driven quality control redefine manufacturing economics. Demand for lightweight components that meet stringent emissions rules, illustrated by BMW’s 27% emissions reduction using wire-arc additive manufacturing, underpins growth[1]“Wire-Arc Additive Manufacturing Cuts Emissions,”, BMW Group Press Office, bmwgroup.com. Hardware advances in fused deposition modeling (FDM) and selective laser sintering (SLS) improve throughput, while cost-effective iron–silicon powders open metal applications for electric-vehicle (EV) motor parts. Regulatory pressure, on-shoring strategies, and the availability of sustainable feedstocks align to expand the Automotive 3D printing market across established and emerging economies.
Key Report Takeaways
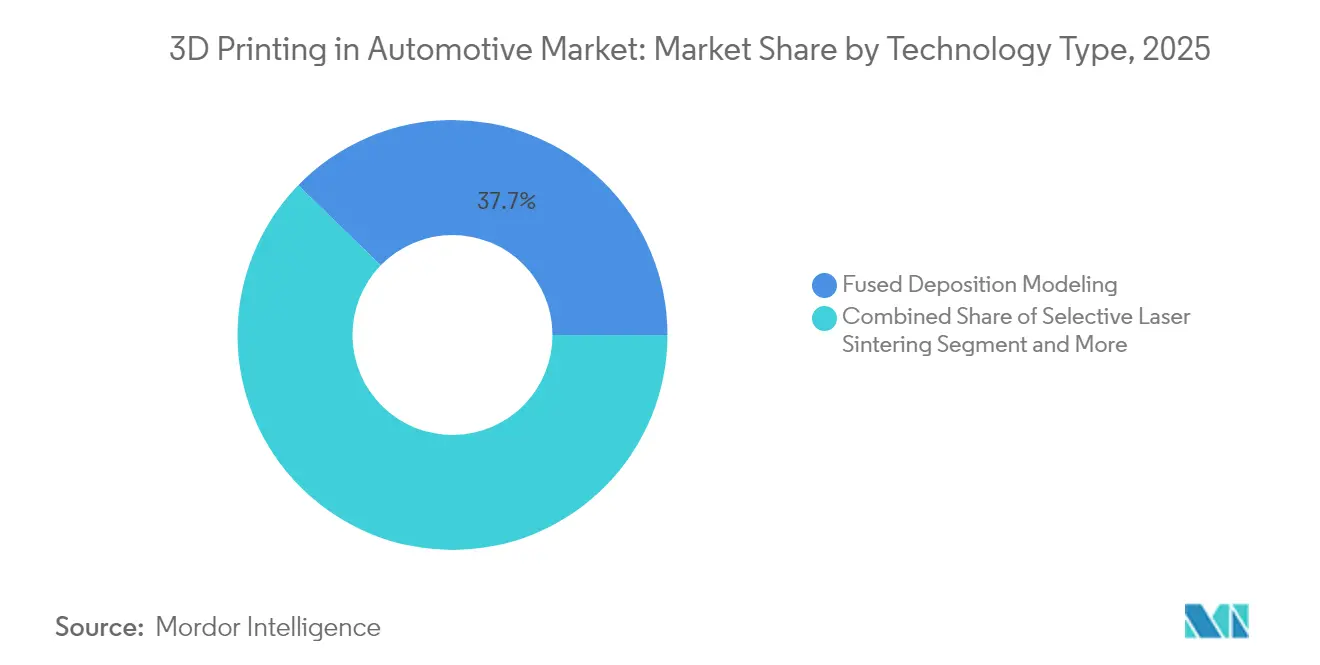
- By technology, FDM commanded 37.74% of the Automotive 3D printing market share in 2025, SLS is poised to grow fastest at an 18.02% CAGR to 2031.
- By component, hardware led with 56.61% revenue share in 2025, while software is forecast to expand at 18.21% CAGR through 2031.
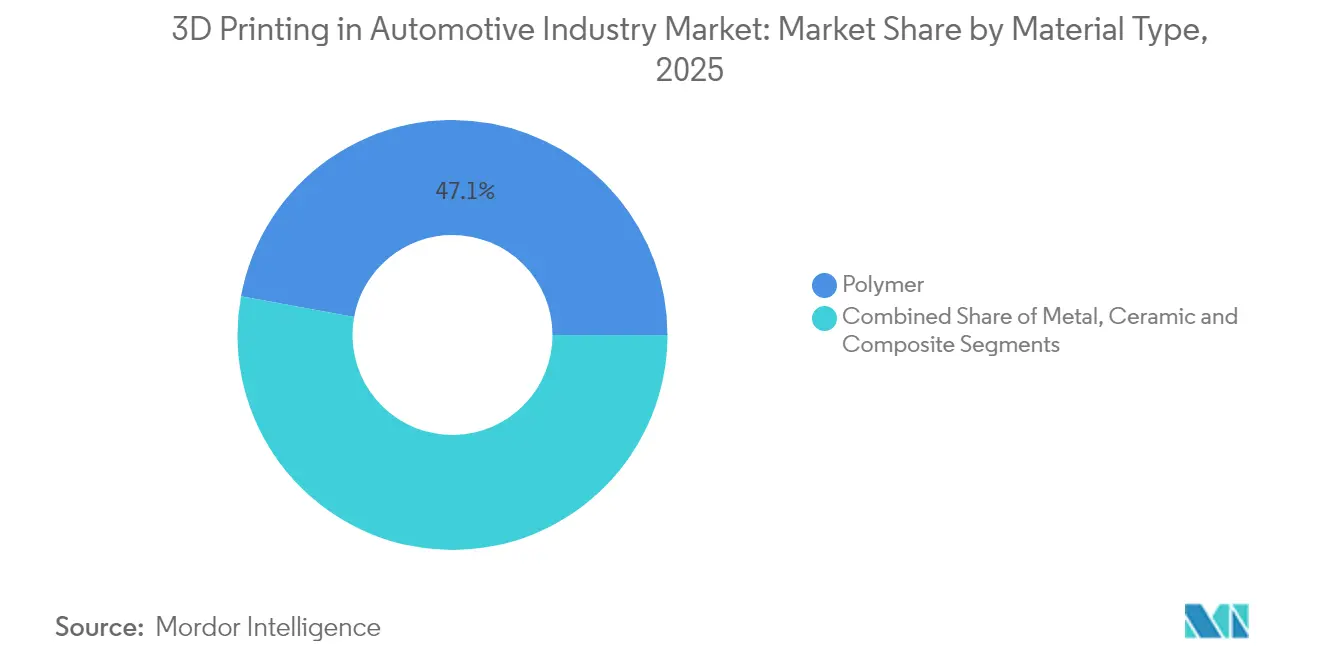
- By material, polymers held a 47.12% share of the Automotive 3D printing market in 2025, metal printing is projected to grow at a 19.05% CAGR between 2026 and 2031.
- By application, production parts are advancing at 25.11% CAGR through 2031, outpacing prototyping’s 43.12% revenue share in 2025.
- By geography, North America accounted for 38.02% of the Automotive 3D printing market share in 2025, whereas Asia-Pacific is the fastest-growing region at a 18.96% CAGR to 2031.
Note: Market size and forecast figures in this report are generated using Mordor Intelligence’s proprietary estimation framework, updated with the latest available data and insights as of 2026.
Global Automotive 3D Printing Market Trends and Insights
Drivers Impact Analysis*
| Driver | (~) % Impact on CAGR Forecast | Geographic Relevance | Impact Timeline |
|---|---|---|---|
| EV Lightweight Parts Demand | +3.2% | Global, focused in North America & Europe | Medium term (2-4 years) |
| Rapid Prototyping Cost-Cuts | +2.8% | Global, strongest in Asia-Pacific manufacturing | Short term (≤ 2 years) |
| Custom Production Tooling | +2.5% | North America & EU industrial corridors | Medium term (2-4 years) |
| Digital Spare-Parts Inventory | +2.1% | Global, early in aerospace & automotive | Long term (≥ 4 years) |
| Multi-Material AM Integration | +1.9% | Advanced manufacturing regions worldwide | Long term (≥ 4 years) |
| Supply-Chain on-Shoring Push | +1.7% | North America & EU, ripple into Asia-Pacific | Medium term (2-4 years) |
| Source: Mordor Intelligence | |||
EV Lightweight-Parts Demand
Electric vehicle makers pursue weight optimization to extend their range and comply with emissions standards. General Motors integrates more than 130 printed parts in the Cadillac Celestiq, including the largest additively manufactured aluminum component in automotive production[2]Scott Wolff, “Iron–Silicon Powders for EV Motors,” Assembly Magazine, assemblymag.com. Europe’s Euro 7 norms accelerate adoption for brake-disc coatings and structural elements. Sand-based 3D printing shortens mold-development cycles, enabling casting designs that reduce mass while preserving tolerance targets. The need to offset battery weight intensifies competitive incentives to remove every gram across vehicle platforms.
Rapid Prototyping Cost-Cuts
Enterprises report up to 90% reductions in prototype lead times and sharp declines in single-part costs as additive manufacturing replaces machining for early-stage design iterations. Stereolithography’s high dimensional accuracy supports low-cost investment casting alternatives, while AI-based build-parameter optimization elevates first-time-right success rates. Desktop SLS printers priced below USD 3,000 broaden access for small and midsize suppliers, compressing innovation cycles across Asia-Pacific manufacturing clusters.
Custom Production Tooling
BMW leverages wire-arc additive manufacturing for bespoke tooling that cuts material waste by 70% and accommodates conformal-cooling channels otherwise impossible with subtractive techniques. Rocket-engine nozzle programs illustrate multi-material builds where thermal and structural properties are co-optimized within one part. The ability to produce jigs, fixtures, and dies on demand slashes inventory costs and supports sustainability objectives through metal-powder recyclability. These capabilities lift the Automotive 3D printing market CAGR by another 2.5 percentage points.
Digital Spare-Parts Inventory
Manufacturers deploying cloud-linked digital inventories have cut engineering-monitoring time by 98% and scrap by 18% through automated workflows that trigger printing only when sensors flag component wear[3]“Oqton Deployment at Baker Hughes,” 3D Systems Application Note, 3dsystems.com. During the COVID-19 crisis, on-demand production mitigated supply-chain breakdowns, underscoring additive’s resilience benefits. As companies migrate from reactive to predictive maintenance, additive printing lowers the total cost of ownership for legacy fleets.
Restraints Impact Analysis*
| Restraint | (~) % Impact on CAGR Forecast | Geographic Relevance | Impact Timeline |
|---|---|---|---|
| High Cost of Metal Printers | -2.4% | Global, greatest in emerging markets | Short term (≤ 2 years) |
| Material-Qualification Gaps | -1.8% | Regulated sectors worldwide, notably aerospace & medical | Medium term (2-4 years) |
| Energy-Intensive Laser Systems | -1.5% | Regions with high energy tariffs | Medium term (2-4 years) |
| IP-Security Concerns | -1.2% | Defense and aerospace verticals globally | Long term (≥ 4 years |
| Source: Mordor Intelligence | |||
High Cost of Metal Printers
Industrial SLS printers list between USD 12,000 and USD 33,000, while specialty metal powders average USD 300–600 per kg, limiting adoption among cost-sensitive suppliers. Helium-atomized powder production offers the most sustainable route, yet capital outlays remain steep. Lifecycle analyses show powder-bed fusion is economical for high-complexity components, but up-front capital still deters wide deployment. Lower-cost metal-filament processes mitigate entry barriers but add post-processing complexity, reducing the Automotive 3D printing market CAGR by 2.4 percentage points
Material-Qualification Gaps
Safety-critical industries require certified datasets for additive-specific alloys, which takes 3–5 years per material. Incomplete mechanical-property databases delay design approval, especially in aerospace, medical, and automotive applications. Academic consortia and standards bodies are accelerating test-protocol harmonization, yet the qualification backlog dampens adoption by 1.8 percentage points.
*Our forecasts treat driver/restraint impacts as directional, not additive. The impact forecasts reflect baseline growth, mix effects, and variable interactions.
Segment Analysis
By Technology Type: FDM Dominance Challenged by SLS Innovation
FDM accounted for 37.74% of the Automotive 3D printing market share in 2025, owing to low system costs and broad material selection. SLS is projected to grow at an 18.02% CAGR through 2031 as desktop powder-bed systems below USD 3,000 democratize high-performance nylon and composite printing. Advances in nanoscale photopolymerization have pushed stereolithography resolution to 100 nm at 100 µm per second, extending its use into microfluidic and optics applications. Digital Light Processing (DLP) increasingly supports jewelry and dental models, while electron-beam melting serves aerospace titanium parts. The Automotive 3D printing market size for SLS-based parts is forecast to expand sharply as EV manufacturers adopt durable nylon gears and under-hood components.
Hybrid manufacturing that blends additive and subtractive techniques is gaining ground. FDM toolpaths integrate continuous-fiber reinforcement, improving tensile strength without secondary operations. Holographic volumetric printing demonstrates up-to-20-fold speed gains by curing entire layers simultaneously, holding promise for high-volume automotive interiors. Continual improvements in process simulation software reduce trial iterations, ensuring FDM retains relevance even as the SLS installed base rises.


By Component Type: Software Growth Outpaces Hardware Expansion
Hardware captured 56.61% of 2025 revenue, encompassing printers, post-processing stations, and scanners. However, software is expanding at 18.21% CAGR as machine-learning algorithms cut defect rates and orchestrate multi-factory fleets. Manufacturing operations platforms deployed at Baker Hughes trimmed monitoring time by 98% and scrap by 18%. Service bureaus flourish when automakers outsource specialty materials or small production runs that do not justify capital spending.
AI-driven build-parameter engines reduce engineering labor by 80%, contributing to a rising software share within the Automotive 3D printing market. Browser-based collaboration suites allow design iterations across continents, enabling simultaneous engineering and rapid release to production. As cloud connectivity scales, subscription revenue offers vendors a high-margin annuity, shifting the competitive balance from machines to digital ecosystems
By Material Type: Metal Printing Accelerates Despite Polymer Leadership
Polymers maintained a 47.12% share of total revenue in 2025, supported by biocompatible resins and high-temperature composites for under-hood applications. Nonetheless, metal printing is growing at 19.05% CAGR to 2031, propelled by iron–silicon powder for EV motors and aluminum-scandium alloys for structural parts. The Automotive 3D printing market size for metal components is projected to exceed USD 4 billion by the end of the decade.
Powder reuse rates surpass 85% in selective-laser-melting processes, reducing material overhead and environmental impact. Ceramic formulations address thermal-barrier requirements for turbocharger housings, while carbon-fiber-reinforced composites decrease vehicle mass without exotic metals. Sustained R&D into recycled polymers and bio-based feedstocks aligns additive manufacturing with circular-economy objectives.
By Application Type: Production Surge Transforms Industry Dynamics
Prototyping commanded 43.12% revenue in 2025, yet production parts are growing fastest at 25.11% CAGR as design-for-additive principles mature. The Automotive 3D printing market size for series parts is expected to match prototyping by 2028. Tooling and fixtures benefit from conformal cooling, achieving 30% cycle-time reductions. GE Aerospace’s USD 1 billion commitment to domestic additive capacity underscores the shift to end-use production.
Medical-grade PEEK cranial implants, cleared by the FDA, exemplify high-value patient-specific components produced on industrial printers. Automotive OEMs now integrate additively manufactured brackets, ducts, and interior trims directly into assembly lines, reducing part counts and accelerating vehicle personalization. As certification barriers diminish, spare-parts printing will reshape after-sales supply chains for legacy models.
Geography Analysis
North America leads the Automotive 3D printing market with a 38.02% share in 2025, supported by the United States’ dominant aerospace and EV supply chains. GE Aerospace’s USD 1 billion investment in additive facilities signals long-term confidence in domestic productio. Reshoring initiatives combined with the Inflation Reduction Act incentivize localized manufacturing, accelerating printer installations across automotive tiers. Canada and Mexico contribute through lightweight truck components and aerospace casting molds, leveraging cross-border trade frameworks.
Asia-Pacific is the fastest-growing region at a 18.96% CAGR through 2031, propelled by China’s manufacturing digitalization and India’s emerging bioprinting startups. Chinese five-year plans earmark additive manufacturing as a strategic pillar, spurring installation growth across automotive hubs and battery factories. India’s collaboration between EOS and Godrej accelerates aerospace applications, while public-private R&D centers foster skill development. Japan and South Korea push materials innovation, developing heat-resistant polymers tailored to hybrid-electric powertrains. Southeast Asian electronics clusters adopt 3D printing for tooling, aided by government tax incentives.
Europe holds a significant share, anchored by Germany where majority of manufacturers deploy additive processes. The region invests 30.6% of AM company turnover back into R&D, reinforcing leadership in metal-printer exports. France and Italy expand composite printing for supercars, while Scandinavia explores bio-based polymers for vehicle interiors. Regulatory alignment through ISO/ASTM standards supports cross-border qualification of printed parts, smoothing supply-chain flows. Emerging regions in South America and the Middle East pursue diversification; Saudi Arabia outfits SMEs with entry-level printers to decrease energy consumption in metal fabrication. Brazil pilots additive repair hubs for agricultural machinery, demonstrating the technology’s reach beyond high-income economies.

Competitive Landscape
The Automotive 3D printing market displays moderate fragmentation. Top players collectively control significant chunk, yet consolidation is accelerating. Stratasys reinforced its balance sheet via a USD 120 million equity infusion from Fortissimo Capital to finance acquisitions and polymer-system R&D. Nano Dimension spent USD 179.3 million buying Desktop Metal and USD 116 million acquiring Markforged, forming a USD 200 million-revenue group with polymer, metal, and electronics capabilities. The combined entity rationalizes overlapping portfolios to capture in software and powder production.
Software differentiation is an intensifying battleground. 3D Systems’ Oqton platform secured large industrial wins after delivering 98% monitoring-time cuts at Baker Hughes. EOS integrates AI into its printer fleet, reducing parameter setup iterations by 80%. HP partners with Materialise to embed proprietary datasets into cloud toolchains, fostering closed-loop process control.
Niche disruptors target desktop SLS and resin systems. Formlabs’ acquisition of Micronics accelerates sub-USD 10,000 powder-bed units, extending the Automotive 3D printing market into design studios and service garages. Hybrid machine builders combine additive and five-axis milling to achieve surface finishes rivaling CNC at reduced cycle times. Patent filings concentrate on multi-material printheads and AI-generated lattice geometries, positioning innovators to license core technologies to automotive OEMs seeking mass-production scale.
Automotive 3D Printing Industry Leaders
Stratasys Ltd
3D Systems Corporation
EOS GmbH
HP Inc.
Materialise NV
- *Disclaimer: Major Players sorted in no particular order

Recent Industry Developments
- June 2025: General Motors confirmed that the Cadillac Celestiq will enter limited-series production with more than 130 additively manufactured parts, including the industry’s largest 3D-printed aluminum structural component, solidifying AM’s role in luxury-vehicle body construction.
- April 2025: Nano Dimension finalized its acquisition of Markforged for USD 116 million, strengthening metal and composite capabilities while consolidating the additive manufacturing market.
- March 2024: HP released HP 3D HR PA 12 S, a nylon material with an 85% reuse rate engineered for durable, lightweight car-interior parts, supporting automaker sustainability goals.


Research Methodology Framework and Report Scope
Market Definitions and Key Coverage
Our study defines the automotive 3D printing market as all revenue earned from industrial-grade additive-manufacturing printers, qualified materials, and related software or on-demand services that are deployed to design, prototype, tool, or directly manufacture automotive parts and assemblies. Coverage spans polymers, metals, ceramics, and composite feedstocks across passenger and commercial vehicle programs, from concept through service parts.
Scope exclusion: consumer desktop printers sold for hobby use and standalone material sales not traceable to automotive applications are kept outside the sizing.
Segmentation Overview
- By Technology Type
- Selective Laser Sintering (SLS)
- Stereolithography (SLA)
- Digital Light Processing (DLP)
- Electron Beam Melting (EBM)
- Selective Laser Melting (SLM)
- Fused Deposition Modeling (FDM)
- By Component Type
- Hardware
- Software
- Service
- By Material Type
- Metal
- Polymer
- Ceramic
- Composite
- By Application Type
- Production
- Prototyping
- Tooling and Fixtures
- Spare-Parts / MRO
- Geography
- North America
- United States
- Canada
- Rest of North America
- South America
- Brazil
- Argentina
- Rest of South America
- Europe
- Germany
- United Kingdom
- France
- Italy
- Spain
- Russia
- Rest of Europe
- Asia-Pacific
- China
- Japan
- India
- South Korea
- Rest of Asia-Pacific
- Middle East and Africa
- United Arab Emirates
- Saudi Arabia
- South Africa
- Egypt
- Rest of Middle East and Africa
- North America
Detailed Research Methodology and Data Validation
Primary Research
Structured interviews were held with printer OEM product managers, tier-one tooling heads in Europe and North America, material formulators in Asia-Pacific, and purchasing managers at electric-vehicle programs. Their guidance refined utilization rates, typical annual part volumes, and average selling prices, and helped test early growth assumptions.
Desk Research
Mordor analysts began with structured reviews of public data issued by bodies such as the International Organisation of Motor Vehicle Manufacturers, the US Bureau of Labor Statistics, Eurostat's PRODCOM series, and trade groups like VDMA's Additive Manufacturing Association. Patent analytics from Questel, customs shipment records pulled through Volza, and filings lodged with the SEC and Tofler supplied company-level signals on installed printer bases and material volumes. Supplementary insights flowed from peer-reviewed journals covering laser sintering of metal powders and from investor briefings of listed printer OEMs. This mix offered baseline demand indicators, pricing bands, and growth cues for each material-technology pairing.
The sources cited here illustrate only a portion of the wider document review pool consulted for sense-checking and data validation.
Market-Sizing & Forecasting
A top-down build starts with global light- and heavy-vehicle production, which is then filtered through adoption coefficients for rapid prototyping, tooling, and serial part printing. We corroborate totals with selective bottom-up checks, including sampled printer shipments, material throughput per machine, and service-bureau billings. Key model drivers include: Annual EV production share (lighter-weight objectives elevate AM use), average polymer and metal powder pricing trends, printer install-base expansion by technology cluster (FDM, SLS, DMLS), lead-time savings targets that push tooling conversion rates, and regional energy costs influencing on-shoring decisions. Forecasts to 2030 employ multivariate regression blended with scenario analysis to capture sensitivity to vehicle output cycles and material cost swings; parameters are fine-tuned with consensus ranges gathered in interviews.
Data Validation & Update Cycle
Outputs undergo sequential peer review inside Mordor, variance checks against historical ratios, and anomaly flags when interim indicators deviate beyond preset thresholds. The database is refreshed every twelve months, with mid-cycle tweaks triggered by material regulatory or capacity announcements, ensuring clients receive an up-to-date baseline.
Why Our Automotive 3D Printing Baseline Inspires Confidence
Published market values rarely align because researchers adopt different scopes, currencies, and refresh cadences. Component inclusion rules, printer-only versus full-ecosystem views, and contrasting ASP assumptions all move the needle.
Key gap drivers surface when others exclude software and service revenue, apply uniform pricing across materials, or freeze adoption coefficients despite accelerating EV launches; meanwhile, Mordor's page reflects the latest 2025 vehicle outlook, distinct material price curves, and an annual update rhythm that limits data drift.
Benchmark comparison
| Market Size | Anonymized source | Primary gap driver |
|---|---|---|
| USD 5.91 B (2025) | Mordor Intelligence | - |
| USD 4.11 B (2025) | Global Consultancy A | Focuses on prototyping only; omits service bureau revenue |
| USD 4.35 B (2025) | Industry Association B | Uses constant polymer ASP; excludes metal printing growth in EV platforms |
| USD 4.64 B (2024) | Regional Consultancy C | Applies 2023 currency rates and has biennial refresh cadence |
In sum, comparing these figures shows that Mordor's disciplined scope definition, dual-path modeling, and yearly refresh produce a balanced, transparent baseline that decision-makers can confidently trace back to clear variables and repeatable steps.


Key Questions Answered in the Report
What is the current size of the Automotive 3D printing market?
The market is valued at USD 6.85 billion in 2026 and is projected to grow to USD 14.39 billion by 2031 at a 15.97% CAGR.
Which technology leads the Automotive 3D printing market?
Fused Deposition Modeling leads with a 37.74% market share in 2025, though Selective Laser Sintering is growing fastest at 18.02% CAGR.
How are software platforms shaping the Automotive 3D printing industry?
AI-enabled manufacturing-operations software can cut monitoring time by 98% and scrap by 18%, making software the fastest-growing component segment at 18.21% CAGR.
What restraints limit wider adoption of metal 3D printing in automotive applications?
High printer and powder costs, lengthy material-qualification cycles, and energy-intensive laser systems collectively reduce forecast CAGR.
Which companies are driving consolidation in the Automotive 3D printing market?
Nano Dimension, Stratasys, GE Aerospace, and Formlabs are leading acquisitions and strategic investments that reshape competitive dynamics.
Page last updated on:


