Zeolites Market Size and Share
Market Overview
| Study Period | 2026 - 2031 |
|---|---|
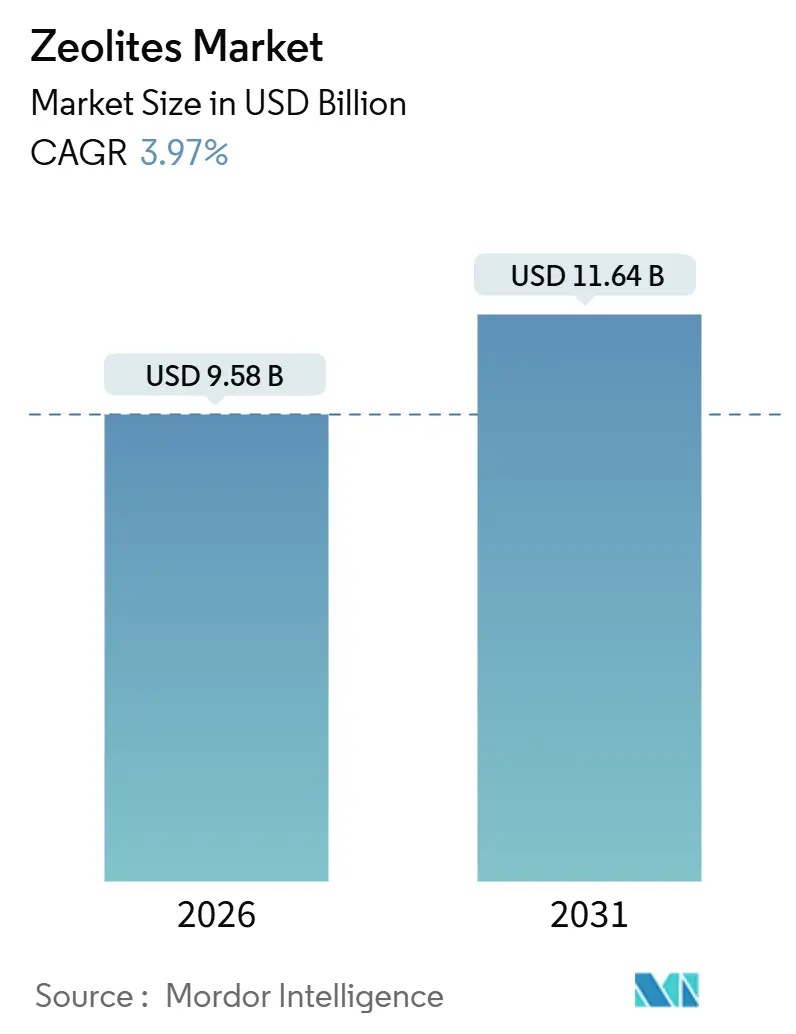
| Market Size (2026) | USD 9.58 Billion |
| Market Size (2031) | USD 11.64 Billion |
| Growth Rate (2026 - 2031) | 3.97% CAGR |
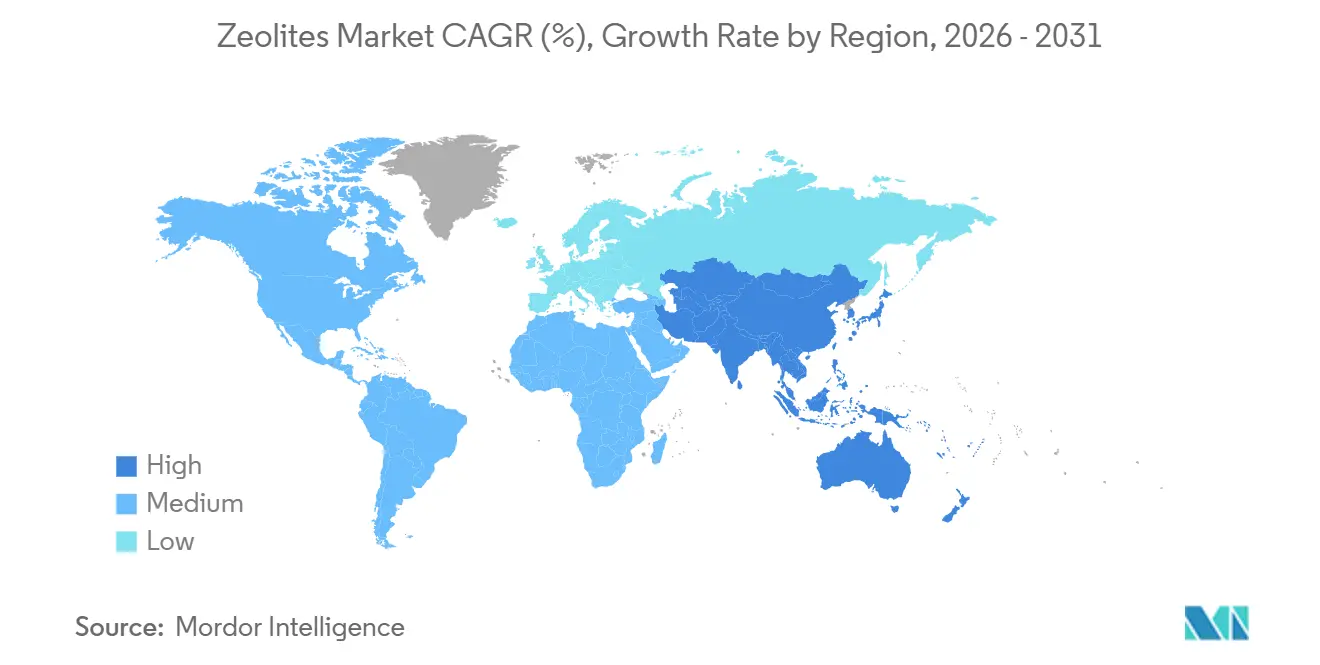
| Fastest Growing Market | Asia Pacific |
| Largest Market | Asia Pacific |
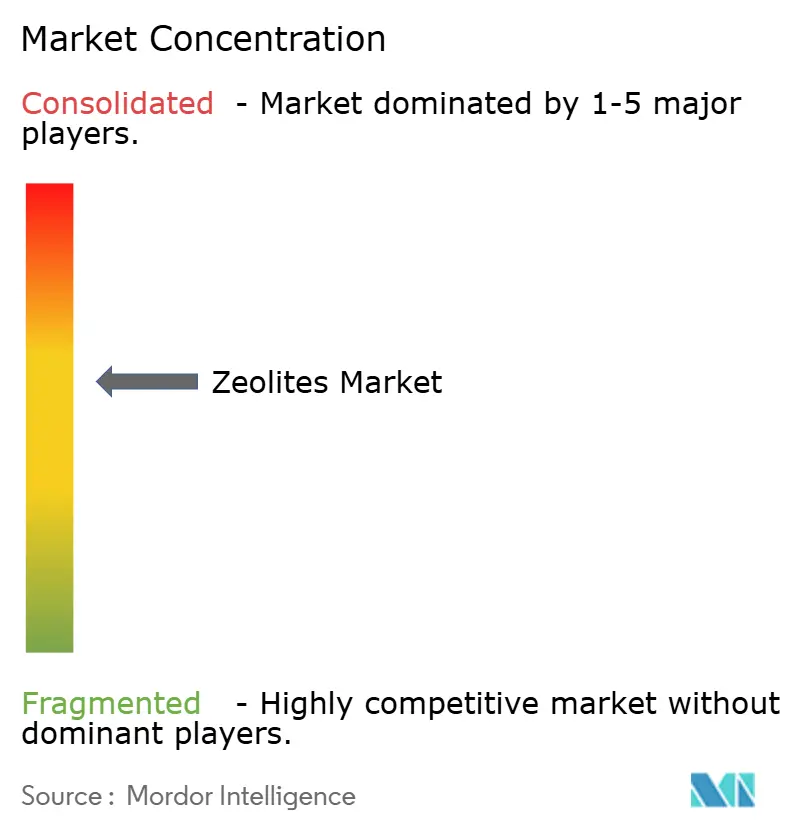
| Market Concentration | Medium |
Major Players *Disclaimer: Major Players sorted in no particular order Image © Mordor Intelligence. Reuse requires attribution under CC BY 4.0. | |
Zeolites Market Analysis by Mordor Intelligence
The Zeolites Market size is estimated at USD 9.58 billion in 2026, and is expected to reach USD 11.64 billion by 2031, at a CAGR of 3.97% during the forecast period (2026-2031). This steady trajectory masks a clear pivot toward high-value niches, as fluid catalytic cracking (FCC) catalysts, molecular-sieve adsorbents, and emerging membrane grades capture the bulk of incremental spending. Natural clinoptilolite still underpins bulk volumes, yet synthetic frameworks gain share because petrochemical operators demand tight Si/Al ratios and cation-exchange capacity tolerances. Consolidation is reshaping competitive dynamics after W.R. Grace divested its catalysts unit to CCMP Capital in 2024, signaling that incumbents want to exit low-margin commoditized products. Parallel research and development investments in hierarchical crystal engineering, notably BASF’s X3D platform, aim to defend catalyst margins against cost-focused Asian entrants.
Key Report Takeaways
- By product type, natural grades led with 55.12% Zeolites market share in 2025; synthetic grades are forecast to expand at a 5.67% CAGR through 2031.
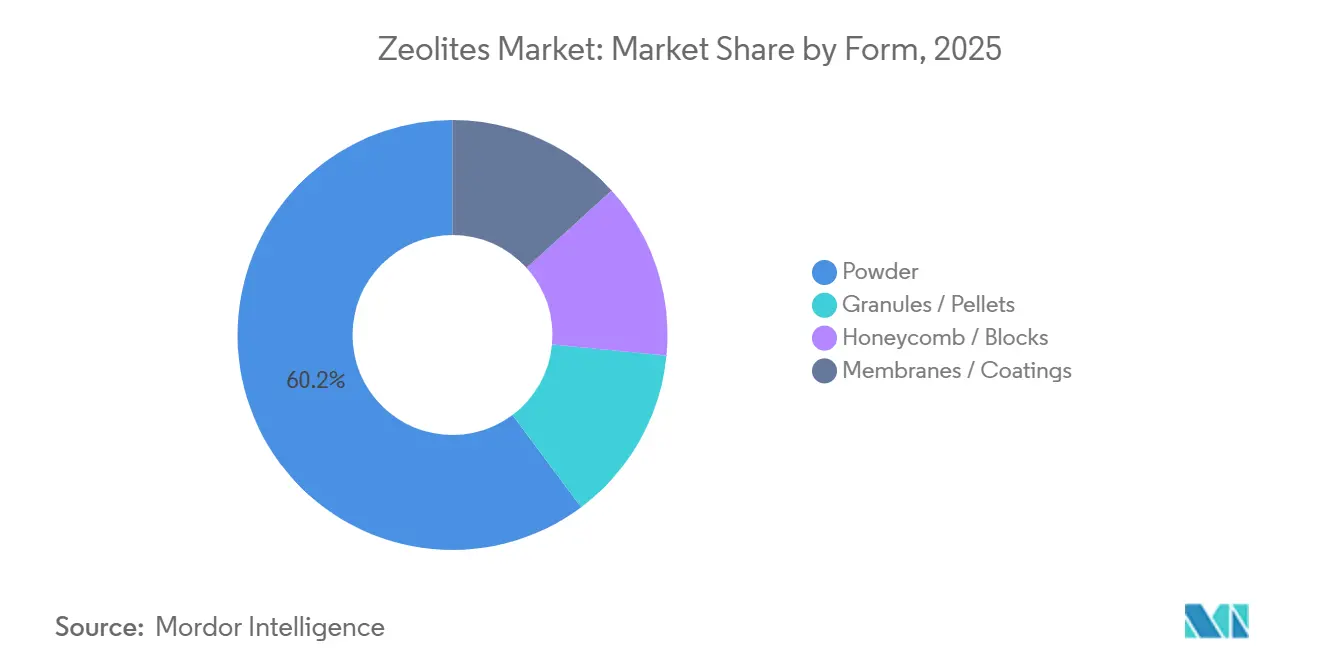
- By form, powders held 60.23% of the Zeolites market size in 2025, whereas membranes and coatings recorded the fastest 6.21% CAGR to 2031.
- By application, catalysts commanded 35.27% revenue share in 2025, while adsorbents are projected to advance at a 5.69% CAGR through 2031.
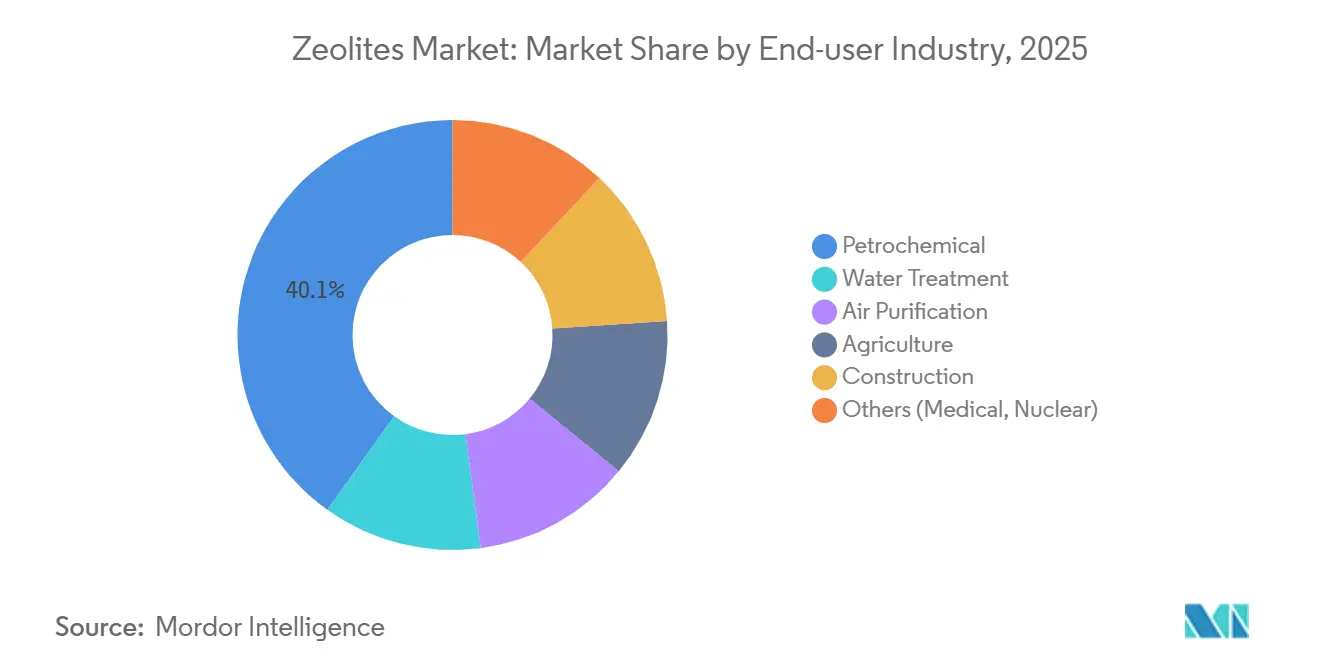
- By end-user, petrochemicals accounted for 40.12% of demand in 2025, yet water treatment is set to grow at a 6.68% CAGR out to 2031.
- By geography, Asia-Pacific captured 45.26% of the Zeolites market demand in 2025 and is expected to grow at a 6.23% CAGR, the fastest among all regions.
Note: Market size and forecast figures in this report are generated using Mordor Intelligence’s proprietary estimation framework, updated with the latest available data and insights as of January 2026.
Global Zeolites Market Trends and Insights
Drivers Impact Analysis*
| Drivers | (~) % Impact on CAGR Forecast | Geographic Relevance | Impact Timeline |
|---|---|---|---|
| Regulatory push for phosphate-free detergents | +0.8% | Europe, North America, select Asia-Pacific markets | Medium term (2-4 years) |
| Increasing demand from water and wastewater treatment | +1.1% | Global, with concentration in North America and EU | Long term (≥ 4 years) |
| Significant usage in FCC catalytic cracking | +1.3% | Asia-Pacific core, GCC, spill-over to South America | Medium term (2-4 years) |
| Petrochemical capacity additions in China and GCC | +1.5% | China, Saudi Arabia, UAE | Short term (≤ 2 years) |
| Zeolite membranes for low-carbon hydrogen purification | +0.4% | Europe, Japan, South Korea | Long term (≥ 4 years) |
| Source: Mordor Intelligence | |||
Regulatory Push for Phosphate-Free Detergents
European Regulation 648/2004 mandates labeling of zeolite A, prompting Procter & Gamble, Unilever, and Henkel to switch more than 80% of powder detergents to phosphate-free formulations[1]European Parliament, “Regulation 648/2004 on Detergents,” EUR-Lex, eur-lex.europa.eu. Detergent producers enjoy dual functionality because zeolites buffer alkalinity while sequestering hardness ions, letting formulators lower overall surfactant loads by up to 15%. The rule lifts replacement demand across Europe and North America and is now mirrored in Southeast Asian markets, notably Indonesia and Vietnam. As a result, the Zeolites market secures a vital, policy-driven growth floor for detergent builders. Synthetic producers such as Zeolyst International benefit from long-term supply contracts that stabilize utilisation rates even when the commodity chemicals cycle.
Increasing Demand from Water and Wastewater Treatment
Updated U.S. National Pollutant Discharge Elimination System permits tightened ammonia limits below 1 mg/L, steering utilities toward clinoptilolite columns that deliver predictable ion-exchange isotherms[2]U.S. Environmental Protection Agency, “NPDES Permit Updates,” EPA, epa.gov. St. Cloud Mining reports that water-treatment volumes rose to 35% of shipments in 2024, up from 28% in 2022. Regeneration economics also favor zeolites because brine cycling restores up to 90% exchange capacity, while activated-sludge retrofits can cost multiples more. Parallel European Union Urban Wastewater revisions keep the compliance spotlight on ammonium and heavy-metal discharge, sustaining long-run growth.
Significant Usage in FCC Catalytic Cracking
FCC units consume roughly 600,000 t of rare-earth-exchanged ultrastable Y-type zeolites each year, underpinning gasoline and propylene yields at modern refineries. Saudi Aramco demonstrated a 12% propylene uplift by pairing USY with ZSM-5 additives at Ras Tanura. Honeywell UOP and Albemarle deploy proprietary spray-drying to embed crystals in attrition-resistant matrices, winning multi-year supply deals in China and the GCC. This usage secures a stable, high-margin backbone for the Zeolites market even as global gasoline demand plateaus.
Petrochemical Capacity Additions in China and GCC
Chinese refining capacity reached 18.5 million bpd in 2023, and projects such as Yulong Petrochemical’s 400,000 bpd complex widen FCC catalyst pull-through. GCC expansions at Ruwais and Jafurah anchor similar demand, and most operators qualify catalysts at least a year before mechanical completion, front-loading orders onto suppliers. Local catalyst makers such as Huiying Chemical and Ningbo Jiahe gain share through proximity and cost advantages, challenging Western incumbents and accelerating regional sourcing realignment.
Restraints Impact Analysis*
| Restraints | (~) % Impact on CAGR Forecast | Geographic Relevance | Impact Timeline |
|---|---|---|---|
| Availability of low-cost silica gel and activated carbon | -0.6% | Global, emphasis on cost-sensitive markets | Medium term (2-4 years) |
| Rare-earth zeolite (La, Ce) supply-chain fragility | -1.0% | Global | Long term (>2-4 years) |
| Source: Mordor Intelligence | |||
Availability of Low-Cost Silica Gel and Activated Carbon
Silica gel undercuts synthetic zeolites by 20-30% in moisture-control packs, while activated carbon dominates VOC removal due to its macroporosity. For cost-sensitive buyers in construction desiccants, the price advantage often outweighs zeolite regeneration benefits, trimming Zeolites market expansion. Catalyst-grade producers respond with hybrid adsorbents that fuse zeolite selectivity with carbon capacity, but adoption remains niche.
Rare-Earth Zeolite Supply-Chain Fragility
China refines up to 95% of global lanthanum and cerium, and 2025 export controls lifted lanthanum oxide prices by 31%. FCC catalyst makers tested low-La formulations, yet early runs revealed coke selectivity penalties that refineries reject. Non-Chinese projects at Lynas and MP Materials will not exceed 15% share before 2027, prolonging exposure and clipping Zeolites market margins tied to rare-earth inputs.
*Our forecasts treat driver/restraint impacts as directional, not additive. The impact forecasts reflect baseline growth, mix effects, and variable interactions.
Segment Analysis
By Product Type: Synthetic Grades Outpace Natural Counterparts
Synthetic frameworks represented 44.88% of 2025 revenue and are forecast to grow at a 5.67% CAGR, double the pace of natural counterparts. The Zeolites market size attributed to synthetic grades is driven by petrochemical catalysts, where compositional precision improves yield economics. BASF’s X3D catalyst embeds nano-zeolites in hierarchical alumina, boosting diffusion and lowering coke laydown, a clear premium feature. Natural clinoptilolite retains cost advantages in agriculture and basic water treatment, yet downstream users seek tighter ion-exchange reproducibility that mines cannot guarantee.
Price differentials remain stark, with synthetic crystals commanding 2-3 times higher unit pricing, a dynamic that keeps natural zeolite tonnage dominant but revenue mixed. Sustainable messaging aids natural-grade sales because mining consumes 40-50% less energy than hydrothermal synthesis, yet regulatory scrutiny now requires trace-metal assays even for agricultural use. Over the forecast horizon, the split likely rebalances toward an even 50-50 volume share as specialty catalysts scale faster than bulk products.
By Form: Powders Lead While Membranes Accelerate
Powder grades retained 60.23% of the Zeolites market share in 2025 by serving detergent, catalyst, and adsorbent producers that prize narrow particle-size distributions. Granules and pellets dominate packed-bed dryers where low pressure drop matters. Membrane and coating formats, though only mid-single-digit volume, will expand at a 6.21% CAGR, propelled by decarbonization projects that require kinetic separations.
DDR-type tubular elements from Resonac Holdings already purify hydrogen streams at 99.99% purity in Japanese pilot plants. ISO 22734 guidelines standardize gas-separation membrane tests, adding certification rigor that should speed broader uptake. Investment hurdles persist, as installed module costs hover near USD 800 per m², but early adopters in petrochemical hubs value lower energy intensity versus pressure-swing adsorption.


By Application: Catalysts Anchor Revenue, Adsorbents Lead Growth
Catalysts accounted for 35.27% of 2025 sales, reflecting heavy FCC usage where USY and ZSM-5 frameworks tune gasoline and propylene targets. The Zeolites market size attached to adsorbents, however, posts a robust 5.69% CAGR, outstripping all other applications. Utilities retrofit clinoptilolite columns to meet stringent ammonia limits, while industrial gas producers install molecular-sieve beds for dehydration and CO₂ removal.
Detergent demand remains stable because zeolite A is entrenched as the primary phosphate substitute in powder formulations. Biogas upgrading appears niche but promising, as zeolite beds can strip CO₂ and H₂S simultaneously, offering capex relief versus amine systems. Catalyst exposure to rare-earth volatility remains the primary headwind that could temper overall segment margins.
By End-User: Petrochemicals Dominate, Water Treatment Surges
Petrochemical operators absorbed 40.12% of 2025 consumption, driven by refinery and steam-cracker installations across China and the GCC. Water utilities, however, register the fastest 6.68% CAGR as aging plants in North America and Europe overhaul tertiary treatment lines. Agriculture absorbs mid-single-digit volumes for feed supplements and soil conditioners.
Construction uptake is steady, with natural zeolites substituted into concrete mixes to mitigate alkali-silica reaction and lower Portland-cement usage. Air-purification niches, including VOC abatement in semiconductor fabs, offer higher margins but low absolute tonnage. The Zeolites industry increasingly tailors composite products to address multiple contaminants, a strategy that resonates with municipal buyers constrained by capex limits.
Geography Analysis
Asia-Pacific commanded 45.26% of the Zeolites market demand in 2025 and will rise at a 6.23% CAGR to 2031. China’s Shenghong Petrochemical and Yulong complexes add sizeable FCC units, while Aramco-SINOPEC-Fujian plans lock in local catalyst sourcing. Japan and South Korea spearhead membrane pilots for hydrogen refueling, and India accelerates clinoptilolite adoption as part of nationwide wastewater upgrades.
The North America zeolites market is influenced by St. Cloud Mining’s 42,000-45,000 tons per year natural-zeolite output and stringent EPA ammonia rules. Canada’s oil-sands upgraders keep catalyst demand steady, whereas Mexican refinery modernization under Pemex adds incremental volumes. Europe’s share mirrors North America, with detergent builders and water regulations supporting baseline growth; membrane pilots tied to the EU Hydrogen Strategy could unlock upside once module pricing falls.
South America plus the Middle East and Africa collectively contribute the balance. Brazilian agribusiness values clinoptilolite for soil moisture retention, while Chilean copper mines deploy zeolite beds in tailings-pond water treatment. GCC petchem megaprojects such as Ruwais and Jafurah secure multi-year synthetic-zeolite contracts that underpin supplier capacity planning. South African utilities test zeolite columns for heavy-metal removal, and Egyptian refinery upgrades expand catalyst pull-through despite softer regional gasoline demand.

Competitive Landscape
The zeolite market exhibits moderate consolidation, with strategic alliances driving the integration of catalyst technology into circular-economy initiatives. Regional players in China and India are expanding their production capacities at double-digit growth rates, leveraging cost advantages to compete with established incumbents in commodity powder grades. Additionally, some companies are diversifying into high-value segments such as membrane products and biomedical applications, as demonstrated by PMA-Zeolite’s gastrointestinal detox formulations. As the membrane and specialty adsorbent markets mature, acquisition opportunities are expected to rise. Smaller firms lacking operational scale may become acquisition targets, enabling larger players to accelerate the commercialization of advanced products.
Zeolites Industry Leaders
W. R. Grace & Co.
BASF
Honeywell International Inc.
Clariant
Tosoh Corporation
- *Disclaimer: Major Players sorted in no particular order

Recent Industry Developments
- January 2026: BASF unveiled pilot production of its third-generation X3D hierarchical zeolite catalyst, targeting FCC units seeking higher propylene yields at lower rare-earth levels.
- June 2024: Resonac Holdings confirmed the scale-up of DDR-type membrane modules and set a USD 600 m² cost target by 2027 to strengthen hydrogen-refueling penetration.


Research Methodology Framework and Report Scope
Market Definitions and Key Coverage
Our study treats the global zeolites market as the value generated from sales of naturally mined or industrially synthesized aluminosilicate frameworks that function as molecular sieves, ion exchangers, and solid-acid catalysts in bulk and specialty applications. According to Mordor Intelligence, sizing covers powder, pellet, block, and membrane forms sold into detergents, catalysts, adsorbents, water treatment, petrochemicals, construction, agriculture, and related end uses across 15 major countries.
Scope exclusion: Other crystalline aluminosilicates that are not classified by the International Zeolite Association are left outside the boundary.
Segmentation Overview
- By Product Type
- Natural Zeolite
- Synthetic Zeolite
- By Form
- Powder
- Granules / Pellets
- Honeycomb / Blocks
- Membranes / Coatings
- By Application
- Adsorbents
- Catalysts
- Detergents
- Other Applications (Refining and Biogas)
- By End-user Industry
- Water Treatment
- Air Purification
- Agriculture
- Petrochemical
- Construction
- Others (Medical, Nuclear)
- By Geography
- Asia-Pacific
- China
- India
- Japan
- South Korea
- ASEAN
- Rest of Asia-Pacific
- North America
- United States
- Canada
- Mexico
- Europe
- Germany
- United Kingdom
- France
- Italy
- Nordics
- Rest of Europe
- South America
- Brazil
- Argentina
- Chile
- Rest of South America
- Middle East and Africa
- Saudi Arabia
- United Arab Emirates
- South Africa
- Egypt
- Rest of Middle East and Africa
- Asia-Pacific
Detailed Research Methodology and Data Validation
Primary Research
Structured interviews with producers, detergent formulators, refinery catalyst buyers, and water-utility engineers across Asia-Pacific, North America, and Europe enabled us to cross-check volume spreads, typical contract prices, substitute pressure, and forward capacity plans. Follow-up email surveys captured average selling-price corridors and emerging purity specifications, allowing Mordor analysts to resolve data gaps and refine scenario assumptions.
Desk Research
We began with public statistical portals, UN Comtrade shipment codes for aluminosilicate minerals, USGS Minerals Yearbook tonnage trends, and Eurostat PRODCOM output because they reveal trade flows and regional production clusters. Trade-association briefs from the International Zeolite Association and American Chemistry Council then helped us align framework nomenclature and purity grades with commercial classifications. Company 10-Ks, select patent families accessed via Questel, and press releases archived on Dow Jones Factiva rounded out price, capacity, and technology cues.
To benchmark demand pull, analysts screened regulatory documents, EU Detergent Regulation and China's phosphate-free mandates, alongside World Bank wastewater investment dashboards, thereby tying policy triggers to consumption. The sources listed are illustrative; dozens of other public and proprietary references informed data gathering, validation, and clarification.
Market-Sizing & Forecasting
A calibrated top-down model starts with regional production plus net trade to reconstruct apparent consumption, followed by application-specific penetration factors (e.g., zeolite kg per ton of powdered detergent, catalysts per barrel of oil refined). Bottom-up supplier roll-ups and sampled ASP × volume checks act as guardrails, and gaps in lightly reported niches are bridged through triangulated averages from interview price bands. Key variables like crude-throughput trends, detergent powder output, industrial water reuse spending, standard ASP drift, and natural-to-synthetic substitution rates feed a multivariate-regression engine that projects demand to 2030. Where statistical series are missing, we interpolate using three-year moving averages validated in expert calls.
Data Validation & Update Cycle
Before release, outputs pass anomaly screens, variance checks against external indices, and a two-step peer review. We refresh every twelve months or sooner if raw-material shocks, major capacity additions, or regulatory shifts move the baseline. An analyst re-runs the model just prior to client delivery so you receive the most current view.
Why Mordor's Zeolites Baseline Commands Confidence
Published figures often diverge because firms differ on what counts as zeolite, which applications they tally, and how quickly they refresh models.
Key gap drivers include: some publishers roll detergent-builder ASPs into broader surfactant pools, others apply aggressive refinery throughput growth or rely on unpublished supplier interviews without public trade validation, and many lock models for three-year intervals whereas Mordor updates annually. Currency conversion years and inflation treatments further widen spreads.
Benchmark comparison
| Market Size | Anonymized source | Primary gap driver |
|---|---|---|
| USD 9.56 B, 2025 | Mordor Intelligence | - |
| USD 14.74 B, 2024 | Global Consultancy A | Includes zeolite-like aluminosilicates and lumps specialty catalysts, limited trade cross-checks |
| USD 8.96 B, 2024 | Market Data Firm B | Excludes construction-grade natural zeolites and uses static ASPs fixed in 2022 |
The comparison shows that while other estimates swing wide, Mordor's disciplined scope, mixed-method modeling, and yearly refresh deliver a balanced, transparent baseline that decision-makers can trace back to clear variables and repeatable steps.


Key Questions Answered in the Report
What is the projected size of the global Zeolites market by 2031?
The value is forecast to reach USD 11.64 billion in 2031, reflecting a 3.97% CAGR from the 2026 baseline.
Which end-use segment is expected to expand the fastest through 2031?
Water treatment leads with a 6.68% compound annual growth rate, fueled by stricter ammonia-discharge limits in North America and Europe.
Why are synthetic Zeolites gaining share over natural grades?
Petrochemical catalysts and molecular-sieve adsorbents require precise Si/Al ratios and consistent cation-exchange capacity, advantages that underpin a 5.67% CAGR for synthetic frameworks.
What rare-earth supply risk affects FCC catalyst producers?
Lanthanum and cerium refining is heavily concentrated in China, and 2025 export controls drove lanthanum oxide prices up 31%, tightening margins for rare-earth-exchanged FCC catalysts.
How fast are zeolite membranes expected to grow?
Membrane and coating formats are projected to post a 6.21% CAGR as hydrogen-purification pilots scale and costs decline toward USD 600 per square meter.
Which region will add the most incremental demand by 2031?
Asia-Pacific is set to expand at a 6.23% CAGR, driven by ongoing refinery and petrochemical capacity additions in China and the GCC.
Page last updated on:


