Plastic Additives Market Size and Share
Market Overview
| Study Period | 2021 - 2031 |
|---|---|
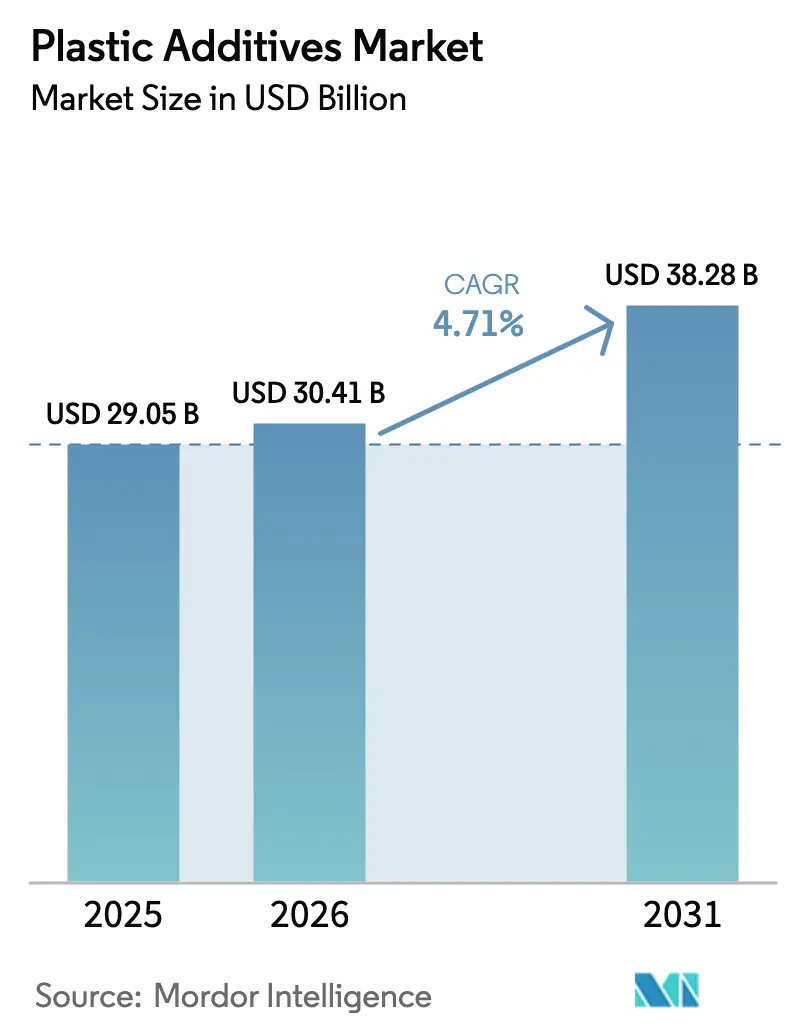
| Market Size (2026) | USD 30.41 Billion |
| Market Size (2031) | USD 38.28 Billion |
| Growth Rate (2026 - 2031) | 4.71% CAGR |
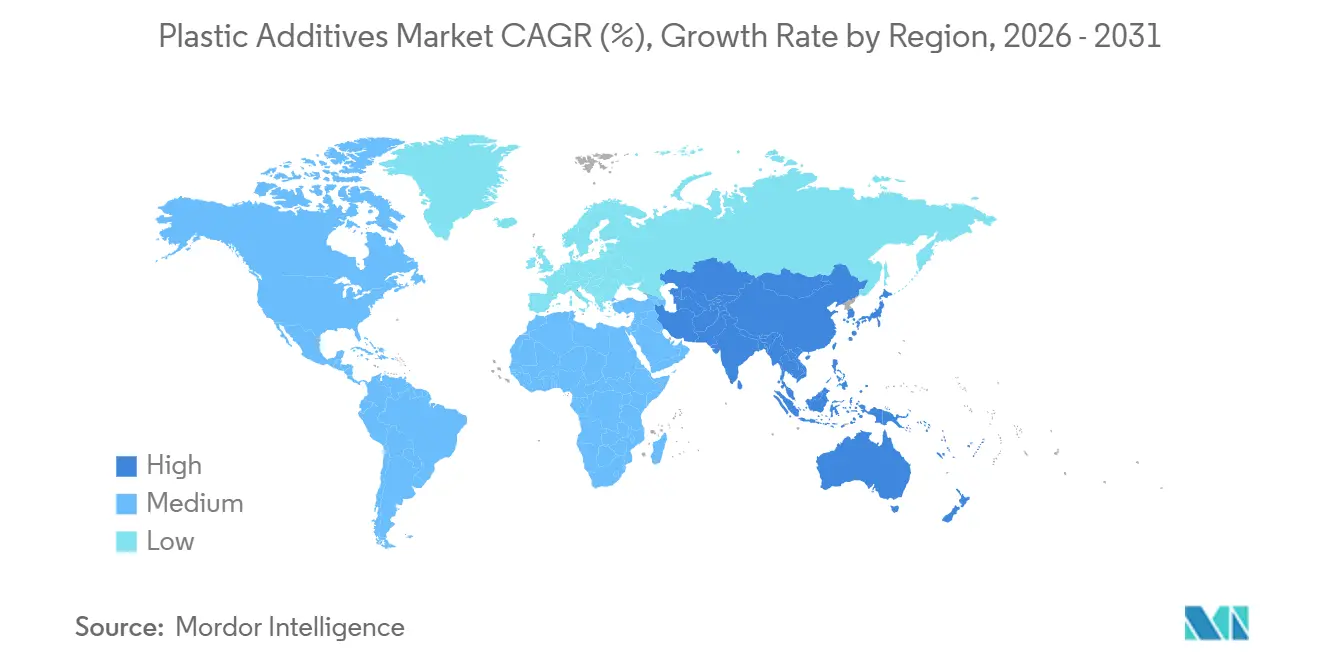
| Fastest Growing Market | Asia Pacific |
| Largest Market | Asia Pacific |
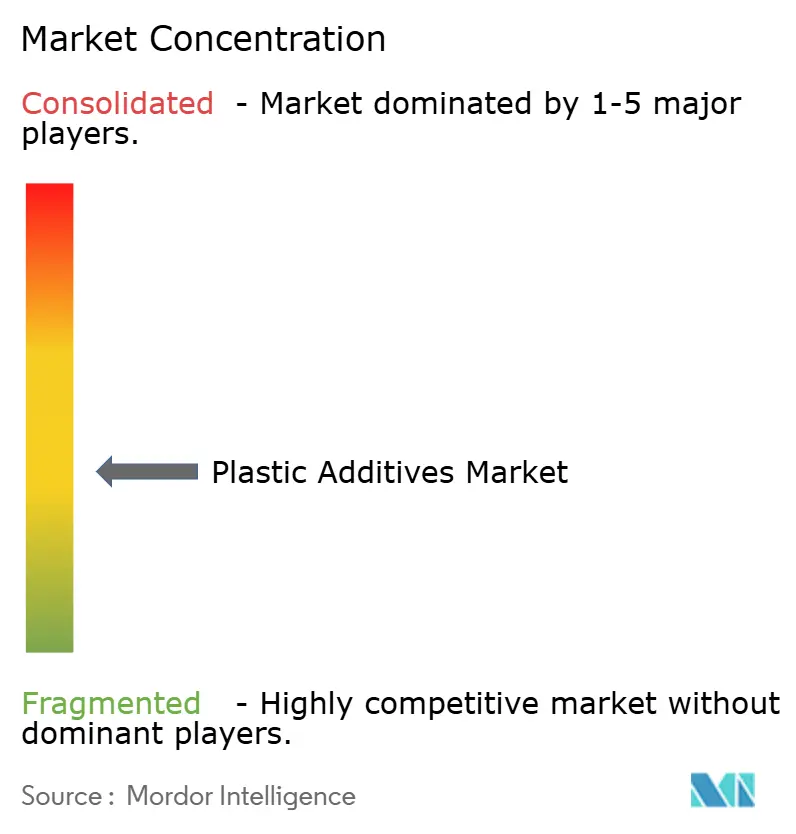
| Market Concentration | Medium |
Major Players *Disclaimer: Major Players sorted in no particular order Image © Mordor Intelligence. Reuse requires attribution under CC BY 4.0. | |
Plastic Additives Market Analysis by Mordor Intelligence
The Plastic Additives Market size is projected to be USD 29.05 billion in 2025, USD 30.41 billion in 2026, and reach USD 38.28 billion by 2031, growing at a CAGR of 4.71% from 2026 to 2031. Robust demand for higher-performance formulations that answer lightweight-vehicle, compostable-packaging, and antimicrobial-surface requirements is steering value creation from commodity volume toward specialty grades. Electric-vehicle makers are specifying heat-stable, flame-retardant additive packages that tolerate 150 °C operating environments, driving price realization that outpaces resin cost inflation. Meanwhile, compostable-packaging mandates in the European Union and California are lifting bio-derived masterbatch demand, where 20%–30% price premiums over titanium-dioxide blends remain defendable. Post-pandemic hygiene protocols have permanently embedded silver-ion and copper-infused synergists into food-contact and healthcare plastics, expanding what were niche categories before 2024. Competitive intensity is accelerating as integrated petrochemical players leverage feedstock control to squeeze independent formulators, prompting a race for acquisitions and patents in non-fluoropolymer processing aids ahead of looming PFAS curbs.
Key Report Takeaways
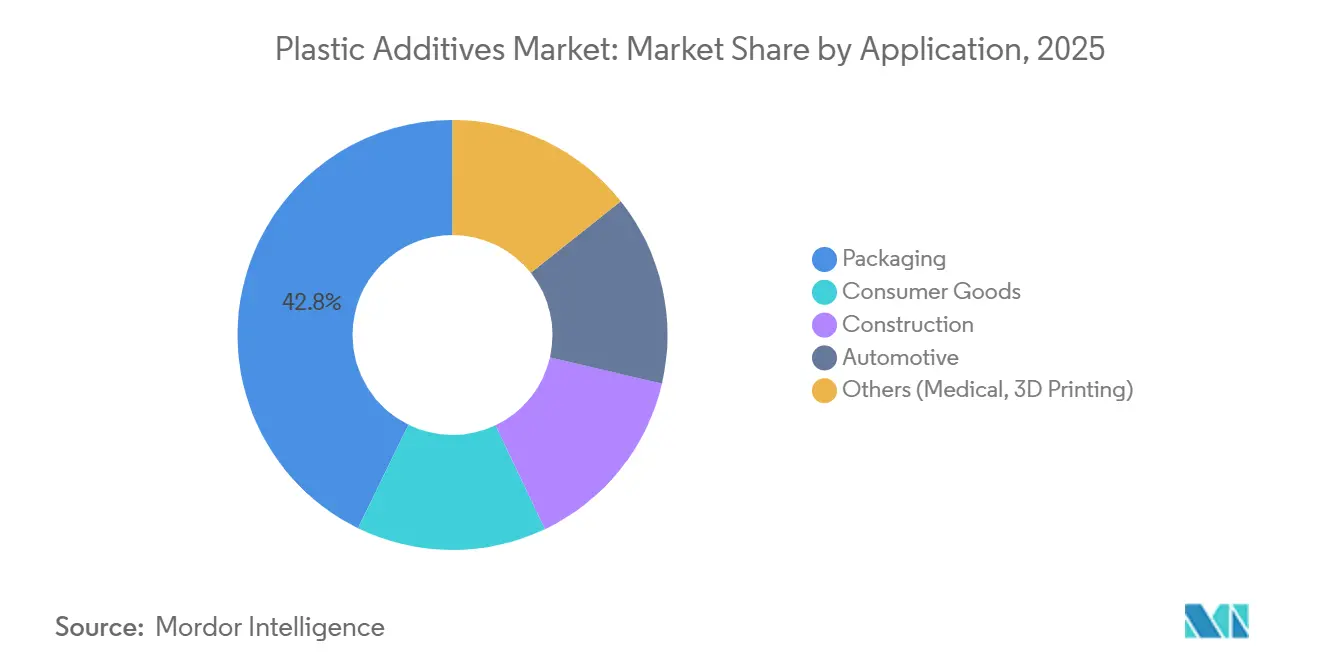
- By application, packaging led with 42.76% revenue share in 2025, while consumer goods are forecast to advance at a 5.15% CAGR through 2031.
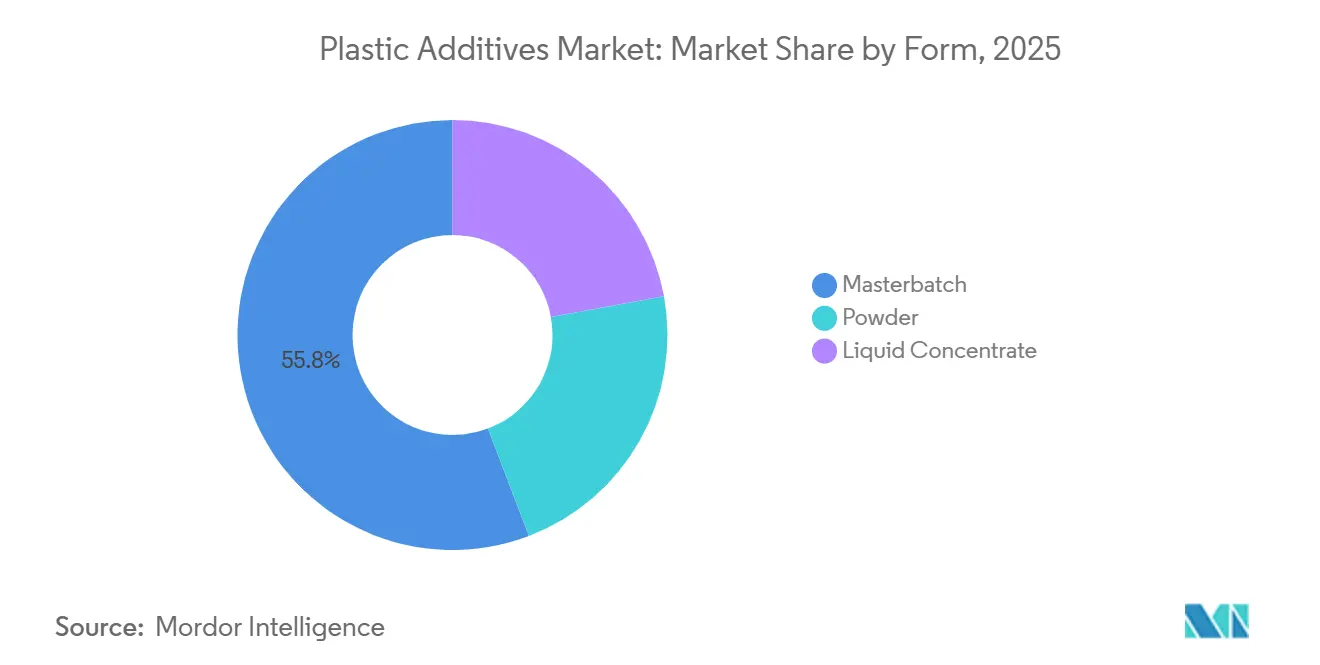
- By form, masterbatch captured 55.78% of the plastics additives market share in 2025; liquid concentrates are projected to grow at a 4.91% CAGR to 2031.
- By type, colorants accounted for 45.87% value in 2025; the dedicated processing aids segment itself is predicted to expand at 4.78% CAGR through 2031.
- By plastic type, polyethylene dominated with 17.87% of the plastics additives market size in 2025, whereas polystyrene is poised to register the quickest 4.66% CAGR during the forecast period.
- By geography, Asia-Pacific commanded 53.12% of global value in 2025 and is expected to grow at a 5.27% CAGR to 2031.
Note: Market size and forecast figures in this report are generated using Mordor Intelligence’s proprietary estimation framework, updated with the latest available data and insights as of January 2026.
Global Plastic Additives Market Trends and Insights
Drivers Impact Analysis*
| Drivers | (~) % Impact on CAGR Forecast | Geographic Relevance | Impact Timeline |
|---|---|---|---|
| Lightweight-EV Components Boosting High-Performance Additives | +0.8% | China, the EU, and North America | Medium term (2–4 years) |
| Plastics Replacing Metals Across Uses | +0.9% | Asia-Pacific, North America | Long term (≥ 4 years) |
| Asia-Pacific Urbanisation Expanding Packaging Demand | +0.7% | Core Asia-Pacific, spill-over to Middle East | Short term (≤ 2 years) |
| Mandatory Compostable-Packaging Laws | +0.6% | EU, California, Canada, emerging India | Medium term (2–4 years) |
| Rapid Adoption of Antimicrobial Surfaces | +0.5% | North America, Europe, Global | Short term (≤ 2 years) |
| Source: Mordor Intelligence | |||
Lightweight-EV Components Boosting High-Performance Additives
Battery-electric platforms demand polymer parts that tolerate temperatures above 150 °C without adding weight. Polyamide and polycarbonate housings for power electronics now require heat stabilizers and impact modifiers that preserve tensile and flammability performance at elevated service temperatures. Lubricant formulators are introducing fluorinated and silicone chemistries that cut injection-molding cycle times by 8%–12% while improving surface finish. Tesla’s 2025 supplier code mandates UL 94 V-0 compliance using halogen-free solutions, inflating specialty-package selling prices by up to 35%. Producers with integrated research and development are consequently securing long-term supply contracts, shielding margins from raw-material swings. As automakers publish stricter sustainability scorecards, additive suppliers that can certify low-VOC and recyclability credentials are positioned to capture a disproportionate share of incremental volume in the plastics additives market.
Plastics Replacing Metals Across Consumer and Industrial Uses
Corrosion resistance, lightweighting, and shape versatility are accelerating the substitution of metals with reinforced plastics in pump housings, valve bodies, and appliance components. Appliance OEMs that swapped zinc die-casts for impact-modified ABS achieved 40% cost savings and reduced component and part count through mold-in design freedom. The European Union’s Ecodesign Regulation, effective 2025, assigns higher circularity scores to mono-material goods, catalyzing single-polymer assemblies that rely on advanced additive packages for mechanical strength[1]European Commission, “Ecodesign for Sustainable Products Regulation,” ec.europa.eu. As design engineers pursue ever-thinner wall sections, nucleating agents and long-term heat stabilizers gain favor, elevating formulation complexity. This dynamic widens the capability gap between global formulators and regionally focused blenders, reinforcing consolidation trends inside the plastics additives market.
Asia-Pacific Urbanisation Expanding Packaging Demand
Rapid urban migration across India, China, and Southeast Asia is lifting packaged-goods consumption—and with it, demand for barrier, slip, and antiblock packages inside multilayer films[2]World Bank, “Urban Population Data,” worldbank.org . India added 35 million urban residents between 2023 and 2025, spurring flexible-film volume that incorporates EVA masterbatch to maintain low-temperature impact strength. China’s cold-chain warehouse footprint rose 18% in 2025, requiring polyethylene films infused with antifog and moisture-barrier additives to preserve visual clarity at sub-zero storage. Southeast Asian converters are co-developing oxygen-scavenger blends that triple shelf life for shelf-stable meals, highlighting the market’s shift toward collaborative product-development agreements. These trends firmly support continued 5%-plus regional growth in the plastics additives market through 2031.
Mandatory Compostable-Packaging Laws Lifting Bio-Additive Masterbatch
The EU Packaging and Packaging Waste Regulation finalized in 2024 mandates that all single-use food-service articles be compostable by 2027, accelerating demand for PLA and PHA masterbatch fortified with bio-derived plasticizers and nucleators. California’s SB 1046 bans petroleum-based additives in compostable articles from 2026 onward, forcing reformulators to adopt plant-wax matrices that retain melt flow without compromising biodegradability. India’s updated EPR credits incentivize brands adopting bio-masterbatch, unlocking subsidized credits that lower payback periods for new production lines. Announced global capacity additions of 45,000 t/y underline the momentum. Price differentials remain 25% above conventional masterbatch, yet brands accept the premium to pre-empt future landfill fees, underscoring a growing profit pool within the plastics additives market.
Restraint Impact Analysis*
| Restraints | (~) % Impact on CAGR Forecast | Geographic Relevance | Impact Timeline |
|---|---|---|---|
| Tin and Phosphorus Feedstock Volatility Compressing Margins | -0.4% | Asia-Pacific, Europe | Short term (≤ 2 years) |
| Phthalate Plasticiser Phase-Out in United States and Europe | -0.5% | North America, Europe | Medium term (2–4 years) |
| PFAS-Based Processing-Aid Restrictions Curbing Adoption | -0.3% | Europe, North America, pending Asia-Pacific | Medium term (2–4 years) |
| Source: Mordor Intelligence | |||
Tin and Phosphorus Feedstock Volatility Compressing Margins
Indonesia cut its tin export quota by 15% in 2025, driving LME spot prices from USD 25,000/ton to USD 30,500/ton by year-end. Concurrently, Myanmar’s political turbulence disrupted phosphorus pentoxide shipments, forcing European stabilizer makers to source from Morocco at 22% premiums. Organotin stabilizers remain indispensable for rigid PVC pipe, yet calcium-zinc alternatives need 30% higher dosages, undermining converter economics. Margin squeeze is most acute for mid-tier formulators lacking long-term contracts, compelling exit or diversification. The plastics additives market, therefore, confronts short-run cost volatility that discourages capital deployment in tin-intensive product lines.
Phthalate Plasticiser Phase-Out in United States and Europe Shrinking Addressable Volume
The U.S. EPA restricted DEHP, DBP, and BBP in December 2024, requiring phase-out by January 2027 across consumer goods. ECHA added four more phthalates to REACH Annex XIV in 2025, effectively banning their use without authorization in medical devices and food-contact articles. Replacement adipate and citrate esters require 10%–15% higher loadings and offer weaker low-temperature flexibility, raising costs while trimming elasticity of demand. Global phthalate consumption is set to fall by 180,000 tons annually, suppressing overall growth potential in the plastics additives market until performance-neutral substitutes emerge.
*Our forecasts treat driver/restraint impacts as directional, not additive. The impact forecasts reflect baseline growth, mix effects, and variable interactions.
Segment Analysis
By Type: Processing Aids Lead Innovation Race
Processing aids captured the fastest 4.78% CAGR outlook between 2026 and 2031 as converters prioritize melt-flow improvements that do not migrate to part surfaces. Fluoropolymer-based aids, historically entrenched in PVC, now grapple with PFAS scrutiny that has accelerated the rise of acrylic and silicone replacements delivering 90% comparable performance. The plastics additives market size for lubricants, slip, and antistatic agents, collectively grouped under “other types,” reached the largest value pool in 2025 due to their ubiquity in polyethylene film and molded packaging. As extrusion lines target 5%–8% shorter cycles, flow improvers specifically enable thinner polypropylene panels for vehicle interiors, a direct contribution to OEM lightweight targets.
In 2025, colorants held a 45.87% share of the plastic additives market, driven by demand for aesthetic differentiation, branding, and functional coloration in packaging, construction, and mobility. The adoption of recycled polymer-compatible masterbatches and innovations in heat-stable, UV-resistant, and food-contact-compliant pigments are boosting usage. Advanced colorants for high recycled-content films and molded parts further expand their applications, cementing their key role in the market.
By Plastic Type: Polyethylene Dominates, Polystyrene Accelerates
Polyethylene commanded 17.87% of the global plastics additives market share in 2025 thanks to expansive use in films, agricultural wraps, and blow-molded containers that rely on slip and UV systems for shelf integrity. Demand for polyethylene continues to build as recycled content targets advance, necessitating additive packages that re-establish melt viscosity and IR barrier performance. Polystyrene, particularly in its expanded form, is expected to post a 4.66% CAGR through 2031 after flame-retardant innovations enabled code-compliant absence of halogens in building insulation.
Polypropylene benefits from electric-vehicle interior applications where talc-filled grades need coupling agents to maintain ductility below –20 °C, underpinning mid-single-digit growth in plastics additives market size across Asia-Pacific. Polyvinyl chloride’s ongoing dependence on heat stabilizers faces headwinds from phthalate withdrawals, yet rigid-pipe demand in infrastructure projects supports baseline volume. Polyethylene terephthalate, transitioning toward high-PCR blends, uses chain extenders and acetaldehyde scavengers to restore mechanical properties. Polycarbonate and polyamide serve high-value niches in under-hood components and industrial machinery, where premium additive packages enable 150 °C dimensional stability and UL 94 V-0 compliance, locking in superior margin opportunities for suppliers in the plastics additives market.
By Form: Masterbatch Holds Share, Liquids Gain Efficiency Edge
Masterbatch remained the preferred form at 55.78% in 2025, favored for handling convenience, accurate dosing, and global compounding infrastructure compatibility. However, liquid concentrates are predicted to grow 4.91% annually as processors install gravimetric feeders capable of metering fluids directly into extruder throats, eliminating an entire pre-compounding step and lowering holding costs by up to 18%. Liquid systems also minimize REACH reporting burdens by consolidating substance tracking into single-component solutions.
In response, masterbatch providers are commercializing ultra-high-concentration pellets with carrier-resin content reduced to 20%, compressing the cost gap with liquids. Powder additives, though smallest in volume, still dominate dry-blend PVC and thermoset workflows, where liquid carriers interfere with cure kinetics. The plastics additives market is therefore bifurcating: large processors favor efficient liquid systems, while small-to-mid converters continue to prefer ready-to-use masterbatch granules.


By Application: Consumer Goods Outpaces Packaging
Although packaging retained 42.76% revenue in 2025, consumer goods are forecast to exhibit the quickest 5.15% CAGR, propelled by antimicrobial, color, and tactile-enhancing additives injected into personal-care and houseware components. Automotive demand is pivoting from interior trim toward structural battery plastics that call for flame-retardant and impact-modifier packages. Construction remains reliant on rigid PVC profiles fortified by heat-stabilizer and impact-modifier systems that assure multi-decade weatherability.
Medical devices and additive-manufacturing uses, grouped under “others,” provide double-digit growth albeit from a small base, thanks to ISO 10993-certified stabilizers and flame-retardant powders formulated for layer-by-layer printing. This broadening of end-use diversity reduces cyclicality and safeguards revenue streams across the plastics additives market, particularly as housing starts and packaging volumes fluctuate with macroeconomic cycles.
Geography Analysis
Asia-Pacific held 53.12% of the plastics additives market share in 2025 and is projected to expand at a 5.27% CAGR through 2031. China’s dual-circulation agenda steers compounders toward local additive suppliers, supporting rapid capacity additions in Shandong and Zhejiang provinces that logged 12% new polypropylene throughput in 2025. India’s Production-Linked Incentive disbursed USD 1.2 billion to advanced-chemistry investors, catalyzing projects that will add 85,000 ton/year of additive output by 2028. Japan sustains specialty demand for engineering resin additives despite flat volume, while South Korea’s electronics majors specify halogen-free flame systems, lifting local consumption growth to the mid-single digits.
North America benefits from reshoring and the Inflation Reduction Act, which underwrites domestic specialty-chemical lines in Texas and Louisiana, slated to total 40,000 tons/year by 2026. Canada aligns its phthalate bans with U.S. policy, accelerating citrate adoption, whereas Mexico’s vehicle exports stimulate polypropylene modifier use in bumper fascia and dashboards. Europe’s circular-economy laws prioritize mono-material designs, pushing demand for high-function additive packages that replace metal-plastic hybrids. Germany, France, and Italy lead bio-masterbatch penetration for compostable packaging, while Scandinavia mandates halogen-free flame retardants in construction panels, securing premium opportunities for specialized formulators.
South America’s growth is led by Brazil, where a 4.5 million-hectare expansion in planted area during 2025 increased agricultural-film demand that employs UV and light-diffusion systems. Argentina’s auto-parts exports propel incremental polypropylene and polyamide additive uptake, although currency volatility tempers capital spending. The Middle East invests downstream via Saudi Arabia’s local compounding push, opening a nascent plastics additives market centered on processing aids for newly commissioned PE and PP lines. South Africa’s retailers specify antimicrobial packages for extended shelf life, marking early adoption in a region still constrained by cold-chain limitations.

Competitive Landscape
The plastics additives market is moderately fragmented, with a meaningful share for regional players. Integrated petrochemical majors such as BASF, Dow, and Evonik leverage feedstock control to underwrite cost leadership in commodity stabilizers and plasticizers, while specialty houses like Clariant and Avient differentiate through rapid formulation services tailored to local converters. Patent filings for non-fluoropolymer processing aids surged 40% during 2024-2025, signaling a scramble to replace PFAS ahead of regulatory cutoffs. Technology investments focus on high-throughput pilot extruders and AI-driven formulation engines that cut lab cycles by one-third, boosting speed-to-market for customer-specific blends. Small-to-mid players lacking capital for compliance testing and global technical service are consolidating or exiting, evidenced by three European mid-size formulators being absorbed in 2025. White-space remains in bio-based plasticizers, antimicrobial masterbatches, and polycarbonate-compatible flame retardants where regulatory pull meets limited industrial-scale capacity. Companies able to scale fermentation or bio-refining processes will likely capture a disproportionate share as sustainability metrics tighten across end markets, reinforcing the strategic imperative for capacity realignment inside the plastics additives market.
Plastic Additives Industry Leaders
BASF
Evonik Industries AG
Clariant
Dow
Songwon Industrial Co. Ltd.
- *Disclaimer: Major Players sorted in no particular order

Recent Industry Developments
- January 2026: BASF started up a EUR 150 million bio-plasticizer unit in Ludwigshafen with 50,000 tons/year capacity, focused on phthalate-free PVC formulations.
- December 2025: Dow partnered with a Chinese EV producer to co-develop high-temperature polyamide compounds using proprietary stabilizers; first commercial output is slated for Q3 2026.
- July 2025: Arkema formed a joint venture with a Japanese PE producer to deliver liquid concentrates for high-speed film extrusion aimed at 15% faster cycles and 10% lower waste.


Research Methodology Framework and Report Scope
Market Definitions and Key Coverage
Our study defines the global plastic additives market as the revenue earned by suppliers of chemical substances deliberately blended with virgin or recycled polymers to ease processing, boost durability, or endow new functions across all resin families, whether shipped as neat powders, liquids, or masterbatches. Figures represent ex-factory sales to compounders, converters, and formulators in 27 countries covered in Mordor's scope.
Scope Exclusion: Values omit base resin sales, pure color concentrates marketed solely as pigments, and bio-based additives produced in-house by branded end users.
Segmentation Overview
- By Type
- Lubricants
- Processing Aids (Fluro-polymer-based)
- Flow Improvers
- Slip Additives
- Antistatic Additives
- Pigment Wetting Agents
- Colorants
- Antifog Additives
- Plasticizers
- Other Types (Filler Dispersants, Blowing Agent, Anti-blocking Agents, Coupling agents, etc.)
- By Plastic Type
- Polyethylene (PE)
- Polypropylene (PP)
- Polyvinyl Chloride (PVC)
- Polystyrene (PS)
- Polyethylene Terephthalate (PET)
- Polycarbonate (PC)
- Polyamides (PA)
- Other Plastic Types
- By Form
- Masterbatch
- Powder
- Liquid Concentrate
- By Application
- Packaging
- Consumer Goods
- Construction
- Automotive
- Others (Medical, 3D Printing)
- By Geography
- Asia-Pacific
- China
- India
- Japan
- South Korea
- Rest of Asia-Pacific
- North America
- United States
- Canada
- Mexico
- Europe
- Germany
- United Kingdom
- France
- Italy
- NORDIC Countries
- Rest of Europe
- South America
- Brazil
- Argentina
- Rest of South America
- Middle East and Africa
- Saudi Arabia
- South Africa
- Rest of Middle East and Africa
- Asia-Pacific
Detailed Research Methodology and Data Validation
Primary Research
We interviewed formulation chemists at packaging and automotive converters, procurement heads at regional distributor houses, and regulatory specialists across Asia-Pacific, Europe, and North America. Their insights refined dosage assumptions, validated price bands, and flagged timing for PFAS and REACH-driven reformulations, ensuring that model pivots reflect field realities.
Desk Research
We mapped demand and trade flows using United Nations Comtrade codes, Eurostat PRODCOM production tables, US ITC import data, and China's polymer output bulletins. Industry papers from the Plastics Industry Association, CEFIC, and peer-reviewed journals on phthalate-free plasticizers clarified additive loading norms, while 10-K filings of leading suppliers revealed capacity shifts and average selling prices. Our analysts pulled company financials through D&B Hoovers and scanned Dow Jones Factiva for plant outages and regulatory milestones. The sources named are illustrative; many other repositories informed data gathering, cross-checks, and clarifications.
Market-Sizing & Forecasting
We built the base-year value by reconstructing global polymer production and trade, which is then filtered through resin-specific additive loading factors before multiplying by average selling prices. Supplier roll-ups and channel checks provided bottom-up stress tests that adjusted totals where captive use or force-majeure events skewed volumes. Key variables include regional polypropylene and PVC output, packaging-film demand, electric-vehicle lightweighting trends, tin-free stabilizer premiums, and regulatory phase-out timelines. A multivariate regression anchored to GDP, construction spending, and virgin polymer production underpins the 2025-2030 outlook, while scenario analysis captures substitution toward bio-based chemistries.
Data Validation & Update Cycle
Every estimate passes a three-layer review that screens anomalies against historical series, reconciles currency shifts monthly, and triggers expert re-contact when variance tops five percent. Reports refresh annually, and before release, one analyst re-runs the model so clients receive our latest view.
Why Mordor's Plastic Additives Market Baseline Is Dependable
Published numbers often differ because providers group dissimilar additive families, select earlier base years, or fold compounding mark-ups into totals. By keeping a tight product scope and anchoring calculations to current polymer output and verified loading factors, Mordor analysts offer a clearer picture.
Key gap drivers include scope breadth, treatment of captive production, and the balance between price and volume signals.
Benchmark comparison
| Market Size | Anonymized source | Primary gap driver |
|---|---|---|
| USD 29.06 B (2025) | Mordor Intelligence | - |
| USD 43.5 B (2023) | Global Consultancy A | Includes color masterbatch and wider additive families; older base year; limited primary validation |
| USD 48.86 B (2023) | Trade Journal B | Rolls compounder mark-ups into additive value; applies uniform loading rate across all plastics |
Taken together, the comparison shows that Mordor's disciplined scope selection, fresh base year, and continuous validation give decision-makers a balanced, traceable baseline they can trust.


Key Questions Answered in the Report
What is the global value of the plastics additives market?
The global plastics additives market is estimated at USD 30.41 billion in 2026 and is forecast to rise to USD 38.28 billion by 2031.
Which region drives most demand for plastics additives?
Asia-Pacific led with 53.12% value share in 2025 and is projected to grow at a 5.27% CAGR through 2031.
Why are liquid concentrates gaining popularity over masterbatch?
Automated gravimetric feeders allow direct dosing, cutting inventory costs by up to 18% and supporting a projected 4.91% CAGR for liquids.
How will PFAS regulation affect additives suppliers?
Planned restrictions in Europe and North America force the development of acrylic and silicone alternatives, subtracting 0.3 percentage points from the overall CAGR.
Which additive type is growing fastest?
Processing aids, helped by EV lightweighting and thin-wall packaging, are set to expand at 4.78% per year through 2031.
What opportunities exist in bio-based additives?
Compostable-packaging laws in the EU, California, and India are triggering investments that will add 45,000 ton/year of bio-masterbatch capacity by 2027.
Page last updated on:


