Yield Monitoring Devices Market Size and Share
Market Overview
| Study Period | 2020 - 2031 |
|---|---|
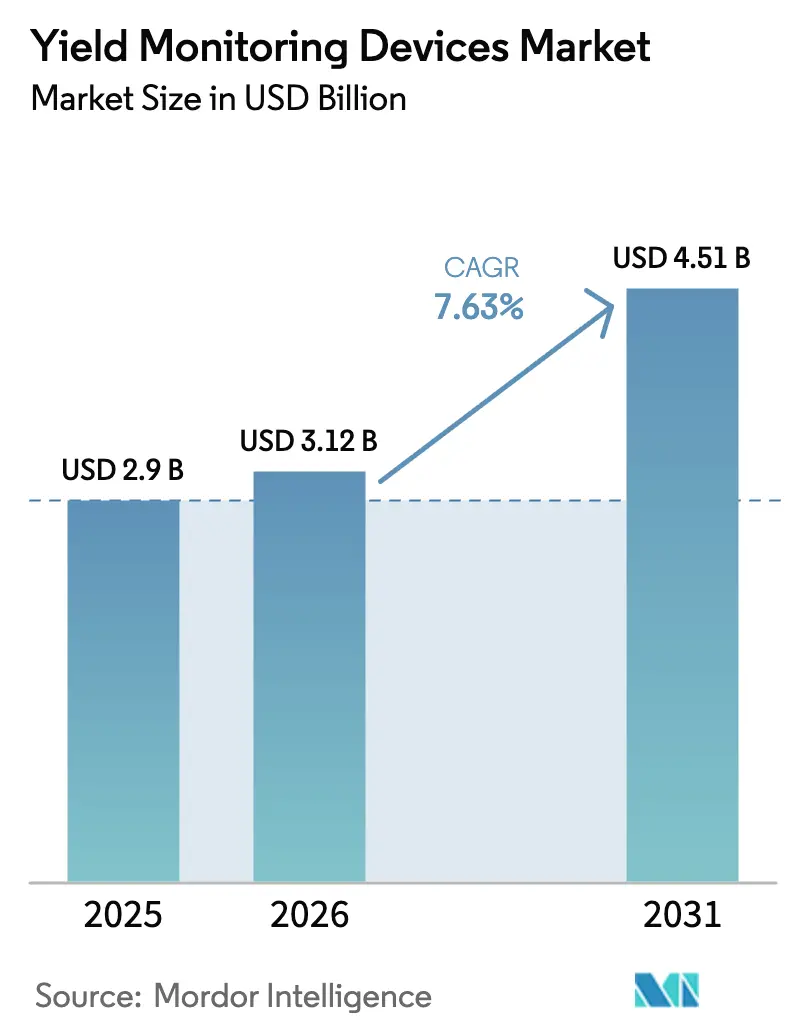
| Market Size (2026) | USD 3.12 Billion |
| Market Size (2031) | USD 4.51 Billion |
| Growth Rate (2026 - 2031) | 7.63% CAGR |
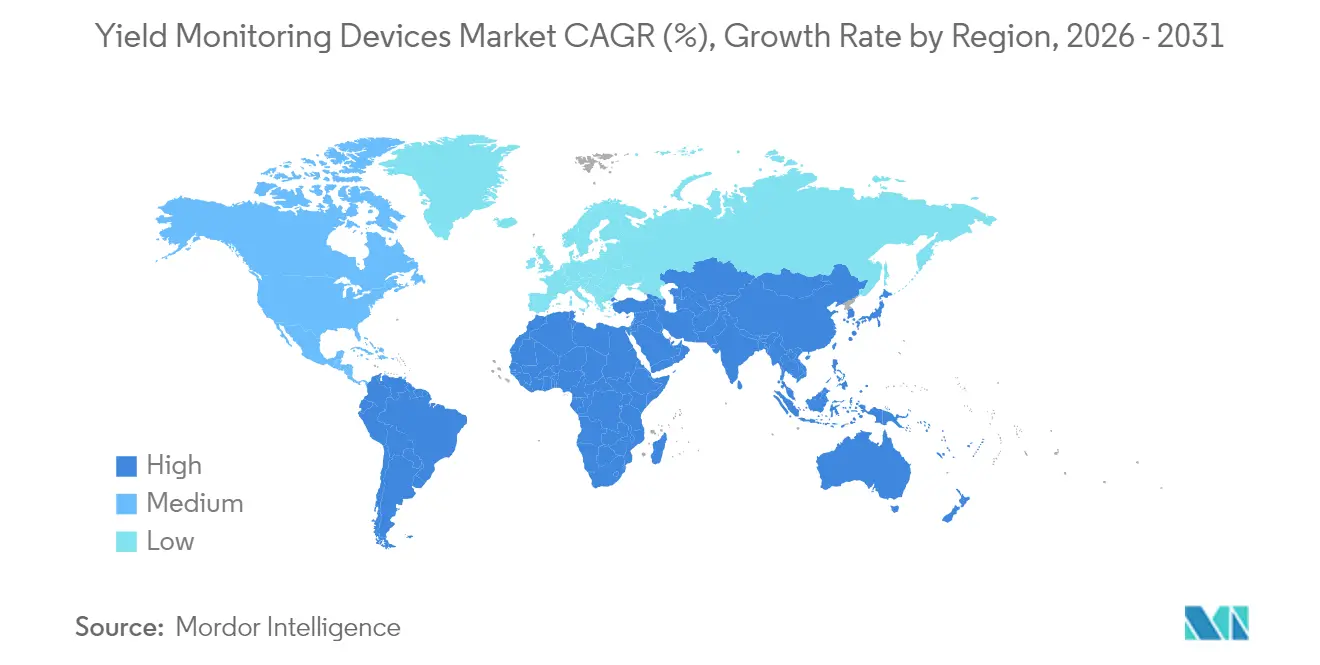
| Fastest Growing Market | Middle East and Africa |
| Largest Market | North America |
| Market Concentration | Medium |
Major Players *Disclaimer: Major Players sorted in no particular order Image © Mordor Intelligence. Reuse requires attribution under CC BY 4.0. | |
Yield Monitoring Devices Market Analysis by Mordor Intelligence
The Yield Monitoring Devices Market size was valued at USD 2.9 billion in 2025 and estimated to grow from USD 3.12 billion in 2026 to reach USD 4.51 billion by 2031, at a CAGR of 7.63% during the forecast period (2026-2031). Steady growth stems from stricter nutrient loss regulations, rapidly falling sensor costs, and the expansion of satellite broadband, which removes long-standing rural connectivity gaps. Corporations still account for the largest installed base, yet small and mid-sized operations now view real-time data as basic infrastructure rather than a premium add-on. Hardware upgrades are increasingly incorporating AI edge chips that deliver in-cab recommendations within seconds, thereby trimming decision latency during harvest. Meanwhile, monetization of carbon credits encourages farms to verify yields for baseline productivity claims, turning monitoring systems from a compliance expense into a revenue enabler.
Key Report Takeaways
- By device type, mass flow sensors held 38.20% of the yield monitoring market share in 2025, while moisture sensors are expected to expand at a 9.18% CAGR through 2031.
- By technology, GPS commanded a 41.55% share of the yield monitoring market size in 2025, and IoT-enabled monitoring systems are forecast to grow at an 8.32% CAGR to 2031.
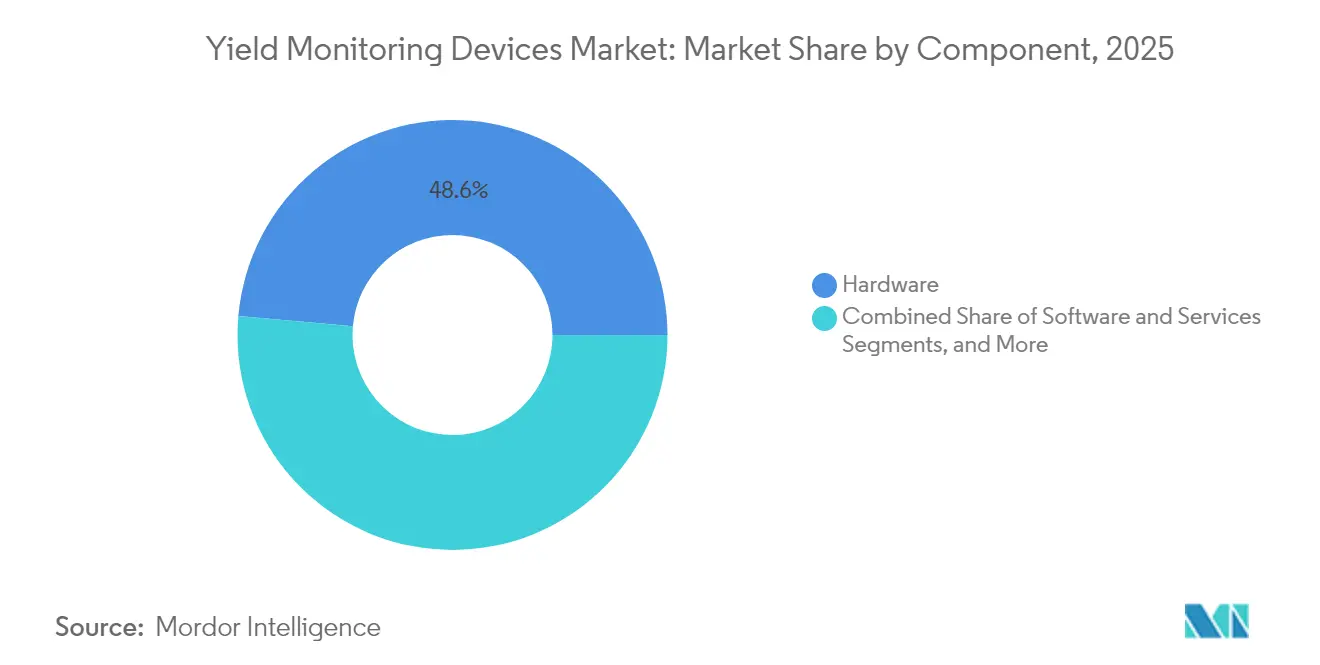
- By component, hardware accounted for a 48.60% share in 2025; services are advancing at a 8.86% CAGR through 2031.
- By application, yield analysis captured a 33.65% share of the yield monitoring market size in 2025, whereas soil monitoring shows the fastest 8.62% CAGR to 2031.
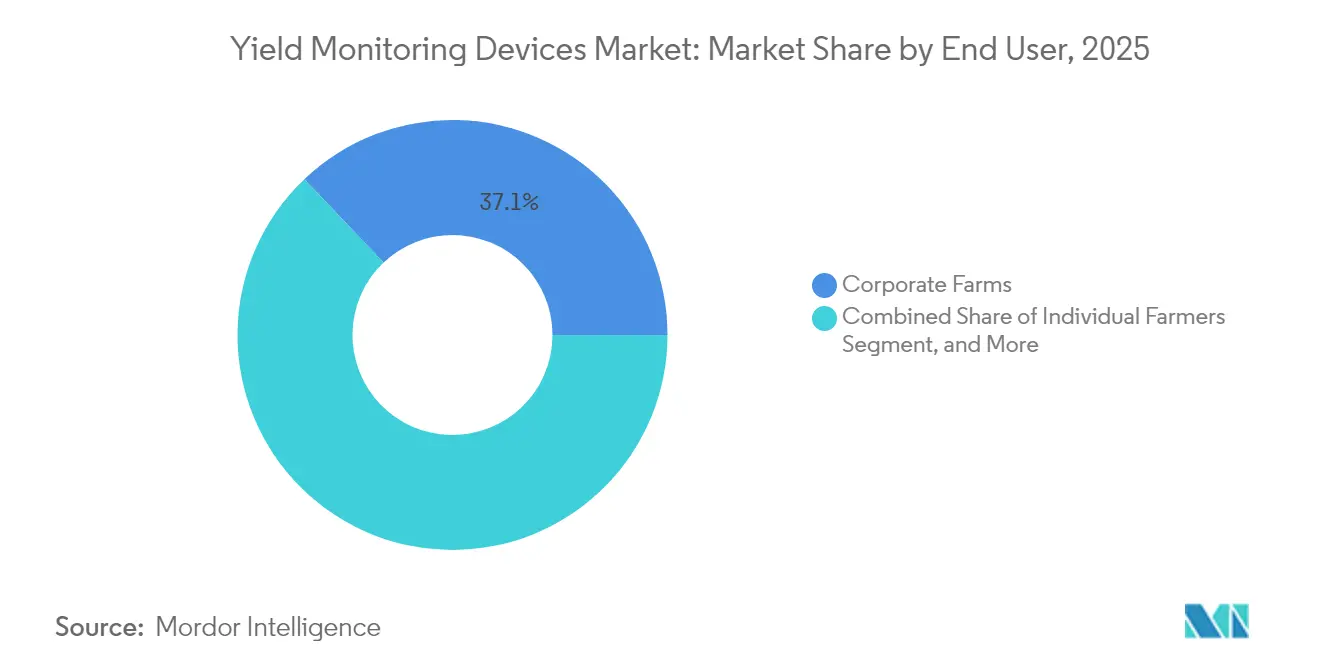
- By end user, corporate farms led with a 37.10% share in 2025, yet individual farmers posted a 9.55% CAGR through 2031.
- By sales channel, OEMs contributed a 61.40% share in 2025, and aftermarket solutions recorded an 8.55% CAGR to 2031.
- By geographically, North America represented 38.40% share in 2025, while the Middle East and Africa regional segment is set to climb at a 8.98% CAGR up to 2031.
Note: Market size and forecast figures in this report are generated using Mordor Intelligence’s proprietary estimation framework, updated with the latest available data and insights as of 2026.
Global Yield Monitoring Devices Market Trends and Insights
Drivers Impact Analysis*
| Driver | (~) % Impact on CAGR Forecast | Geographic Relevance | Impact Timeline |
|---|---|---|---|
| Rapid adoption of precision agriculture hardware in mid-sized farms | +2.10% | Global, with concentration in North America and Europe | Medium term (2-4 years) |
| Rising satellite-based connectivity lowering black-spot data gaps | +1.80% | Global, particularly benefiting rural areas in emerging markets | Short term (≤ 2 years) |
| Mandatory nutrient-loss reduction rules in North American states | +1.20% | North America, with spillover to EU regulatory frameworks | Long term (≥ 4 years) |
| Carbon-credit monetization pushing yield verification demand | +0.90% | Global, with early adoption in developed markets | Medium term (2-4 years) |
| Integration of on-combine AI edge chips for real-time insights | +0.80% | North America and Europe, expanding to Asia Pacific | Medium term (2-4 years) |
| Emergence of open API data ecosystems linking OEMs and agr-fintech | +0.60% | Global, led by North America | Short term (≤ 2 years) |
| Source: Mordor Intelligence | |||
Rapid Adoption of Precision Agriculture Hardware in Mid-Sized Farms
Mid-sized holdings, covering 500-2,000 acres, are now equipping combines with multisensory kits that were once considered affordable only for corporate operations.[1]U.S. Department of Agriculture, “USDA Announces New Climate-Smart Agriculture Initiatives,” USDA.gov Equipment leasing programs with 60% lower upfront cash needs encourage owners to modernize fleets before the next planting cycle. Simple touchscreen interfaces replace complex desktop software, reducing training time from weeks to days. Growing peer examples drive a domino effect as neighbouring growers observe profit gains. This cohort’s shift from optional curiosity to baseline expectation will sustain hardware demand through the forecast horizon.
Rising Satellite-Based Connectivity Lowering Black-Spot Data Gaps
Low Earth Orbit constellations supply broadband to 85% of previously unserved farmland, allowing continuous uploads of sensor feeds during field operations.[2]Federal Communications Commission, “2024 Broadband Deployment Report,” FCC.gov Latency drops from hours to minutes, turning yield maps into real-time dashboards visible on mobile devices. Seamless backhaul lets agronomic advisers intervene mid-harvest rather than post-season. Providers now bundle connectivity with analytics subscriptions, removing a stand-alone telecom expense line. With coverage expanding into the tropics and arid belts, remote regions leapfrog to the same data parity enjoyed in Iowa or Bavaria.
Mandatory Nutrient-Loss Reduction Rules in North America
Watershed programs, such as the Chesapeake Bay Total Maximum Daily Load, demand audited records that link fertilizer rates to uptake efficiency.[3]Environmental Protection Agency, “Chesapeake Bay TMDL,” EPA.gov Non-compliance fines that can exceed USD 100,000 annually make yield monitoring systems far more cost-effective than risk exposure. Farmers now integrate application logs with harvest data to prove nutrient stewardship. States distribute cost-share grants for sensor purchases, accelerating diffusion among budget-constrained operators. The rule set is influencing draft legislation in the European Parliament, hinting at a wider compliance wave that favours data-rich farms.
Carbon-Credit Monetization Pushing Yield Verification Demand
Voluntary carbon markets pay USD 15-25 per ton of sequestered carbon, but verification protocols insist on accurate yield baselines.[4]Climate Action Reserve, “Carbon Credit Pricing and Protocols,” ClimateActionReserve.org Growers, therefore, deploy sensors to demonstrate that regenerative practices do not compromise yield. Blockchain credit registries require continuous, tamper-proof data streams, further nudging the adoption of OEM-certified devices. Income generated through credits helps offset subscription fees, framing monitoring as a profit center instead of overhead. The trend extends beyond corn and soy to specialty crops, thereby widening the addressable acreage.
Restraints Impact Analysis*
| Restraint | (~) % Impact on CAGR Forecast | Geographic Relevance | Impact Timeline |
|---|---|---|---|
| Inter-brand data-format incompatibility elongating integration cycles | -1.30% | Global, particularly affecting mixed-equipment operations | Medium term (2-4 years) |
| Sensor-calibration drift under extreme humidity in Asia Pacific | -0.70% | Asia Pacific, with secondary effects in tropical regions | Short term (≤ 2 years) |
| Acute talent shortage of geo-analytics agronomists in Africa | -0.50% | Africa, with spillover to emerging markets in Asia Pacific | Long term (≥ 4 years) |
| Geo-political export controls limiting GNSS chip availability | -0.40% | Global, with acute impact on Russia, China, and Middle East | Medium term (2-4 years) |
| Source: Mordor Intelligence | |||
Inter-Brand Data-Format Incompatibility Elongating Integration Cycles
Multi-vendor operations often juggle proprietary file types from John Deere, AGCO, and CNH machines that refuse to speak the same digital language. Middleware coding can inflate deployment windows to 12-18 months, eroding the return on investment. Some farmers consolidate around one OEM to dodge the hassle, but that sacrifices price competition. Industry committees are drafting JSON field data schemas; however, commercial pressure to maintain lock-in is slowing consensus. Until true plug-and-play arrives, upgrade spending may pause for growers managing mixed fleets.
Sensor-Calibration Drift Under Extreme Humidity in Asia Pacific
High humidity accelerates the corrosion of electronic traces, necessitating quarterly recalibrations that increase service bills. Moisture sensor accuracy degrades exactly when monsoon-timed crops need precise readings. Smallholders often lack access to mobile technicians, so downtime stretches into critical growth phases. Vendors are adding conformal coatings and self-check algorithms, but higher component costs challenge entry-level price points. Consequently, adoption lags in tropical belts despite evident agronomic value.
*Our forecasts treat driver/restraint impacts as directional, not additive. The impact forecasts reflect baseline growth, mix effects, and variable interactions.
Segment Analysis
By Device Type: Mass Flow Sensors Anchor Hardware Demand
Mass flow units delivered 38.20% of the yield monitoring market share in 2025. Their direct integration inside the combine elevators produces instant volume and weight readings that feed GIS maps before the grain reaches the bin. That immediacy supports variable-rate seeding plans for upcoming seasons. Moisture sensors, which account for only 24.25% of revenue, expand at the fastest rate of 9.18% CAGR, thanks to tighter storage specifications and intensifying drought cycles. Secondary sensor categories covering compaction and canopy height find niche uptake among specialty crops, but still complement core mass flow data sets. Future upgrades will incorporate AI chips that detect sensor drift and trigger mobile alerts, reducing troubleshooting times during peak harvest periods.
In the medium term, farmers increasingly purchase multi-sensor bundles to maximize data synchronization. ISO 11783 ensures baseline communication, yet cross-brand add-ons can still lose metadata during transfer. Start-ups now market adapter harnesses that convert proprietary pinouts, retaining warranty coverage without firmware hacks. These retrofit kits sustain hardware revenue even as new combine sales fluctuate with commodity cycles. As a result, the yield monitoring market continues relying on mass flow sensors as cornerstone components, with incremental accessories broadening overall platform stickiness.


By Technology: GPS Core Spurs IoT Uptake
Global Positioning System (GPS) receivers underpinned 41.55% of 2025 revenue, as every spatial data layer begins with accurate coordinates. Real-time kinematic corrections shrink error margins to below 2 cm, enabling row-level profitability analysis. Additionally, IoT-enabled networks are scaling at an 8.32% CAGR as growers embed low-power radios in tillage implements, grain carts, and even weather stations. Each node streams to cloud dashboards, turning the field into a live sensor mesh. Integration with yield maps transforms one-time snapshots into continuous decision engines that trigger variable irrigation or nitrogen side-dress events automatically.
Geographic Information System analytics stack atop positioning layers, rendering multi-year heat maps that reveal chronic underperformers. UAV-based remote sensing expands coverage above tree lines or flooded areas where ground rigs cannot operate. Guidance systems close the loop by steering equipment along optimized passes, minimizing overlaps and fuel spend. Vendors now bundle guidance licenses with IoT platform subscriptions, encouraging stepwise adoption. Over time, the yield monitoring market size attributed to standalone GPS receivers will gradually shift toward hybrid packages that embed connectivity by default.
By Component: Hardware Leads, Services Accelerate
Physical components still captured 48.60% of 2025 spending, reflecting the necessity of sensors, harnesses, displays, and control boards situated on machinery. Economies of scale and chip supply normalization have cut list prices 18% since 2023, expanding addressable budgets among individual growers. Yet, service revenue is climbing at a 8.86% CAGR, driven by data analytics packages that translate terabytes of readings into field-specific prescriptions. Subscription dashboards utilize machine learning to identify anomalies, such as sudden yield dips or moisture spikes, that warrant mid-season intervention.
Software licenses straddle both worlds by remaining tethered to hardware serial numbers, ensuring renewals when displays are replaced every five years. Consulting arms of OEMs now deploy agronomists who interpret reports and draft compliance files for state regulators. As regulatory paperwork increases, service contracts help reduce the administrative load. Vendors that execute seamless hand-offs between hardware install and agronomy insights position themselves to capture lifetime customer value beyond initial box sales.
By Application: Yield Analysis Dominates while Soil Monitoring Surges
Yield analysis accounted for 33.65% of 2025 revenue because it speaks directly to the core profit metric, tonnes per acre. Combines stream geo-tagged grain weight to tablets, allowing operators to tweak machine settings on the go. The data also validates seed hybrid choices and fine-tunes variable-rate scripts for the next season. Soil monitoring, although smaller today, is rising at an 8.62% CAGR as policy and weather extremes tighten focus on nutrient balance and water use. Integrated probes now feed moisture curves into irrigation pivots that throttle water flow on a minute-by-minute basis.
Field mapping and crop scouting remain foundational layers that support more specialized use cases such as pest hot-spot prediction. Variable-rate application modules are increasingly leveraging live sensor input rather than solely relying on pre-season prescription maps, thereby shortening feedback loops from months to minutes. Start-ups are packaging end-to-end suites that integrate yield data, drone imagery, and soil telemetry within a single interface, reducing user friction for smaller farms with limited technical staff.
By End User: Corporate Scale Persists yet Smallholders Accelerate
Corporate enterprises retained 37.10% of installed systems in 2025, leveraging finance teams and centralized IT to drive fleet-wide standardization. Their multi-region portfolios justify enterprise analytics that benchmark performance across states or provinces. Individual farmers, however, exhibit the fastest uptrend at a 9.55% CAGR, as declining prices align with household budgets. Smartphone-based calibrators eliminate the need for rugged laptops, and dealer co-ops now host training sessions that demystify analytics.
Consultants and research institutions deploy high-resolution sensors for trial plots, refining input recipes that are eventually filtered down to farm clients. Equipment dealers are increasingly bundling monitoring devices with used combine resales, tapping into a different buyer tier. Government extension programs issue vouchers covering up to 40% of sensor hardware, further lowering entry barriers for rural adopters. Collectively, these shifts diversify the yield monitoring market customer base, balancing the dominance previously held by conglomerates.
By Sales Channel: Aftermarket Gains Ground
OEMs shipped 61.40% of units in 2025 by embedding monitoring kits directly on new harvesters, balers, and sprayers. Factory integration guarantees wiring integrity and protects warranties. Nonetheless, aftermarket vendors are posting an 8.55% CAGR, catering to legacy equipment still productive after a decade in service. Retrofit kits snap into CAN-bus harnesses and connect over Bluetooth to operator phones, bypassing proprietary screens. This path lets farms spread capital costs by upgrading sensors long before purchasing replacement machines.
Independent dealers differentiate through multi-brand system design, matching best-in-class sensors with open-source software. Online direct-to-farmer storefronts further compress margins, although buyers assume the installation risk. As commodity prices fluctuate, producers prize flexibility, so aftermarket market share is predicted to keep climbing, although OEM leadership is expected to persist at least through the forecast period.
Geography Analysis
North America generated 38.40% of global revenue in 2025, underpinned by GPS adoption dating back two decades and near-universal rural broadband that guarantees live sensor streaming. State nutrient rules and rapidly forming carbon markets reinforce technology uptake by tying subsidies to verifiable yield data. Dealer networks span from Manitoba to Mississippi, supplying parts within 24 hours during peak harvest periods.
Europe maintains steady demand through the Common Agricultural Policy's green requirements, which offer bonuses for documented soil stewardship. High land costs push intensive management, making yield maps indispensable for squeezing value from every hectare. Eastern member states pivot from small parcels toward consolidated corporate farms, unlocking larger sensor purchase orders. Asia Pacific shows heterogeneous patterns. Japan and Australia are already approaching North American penetration, while India and China rush to modernize through government-backed mechanization grants. The Middle East and Africa are the fastest-growing regions at a 8.98% CAGR. Satellite internet bypasses fiber scarcity, and ministries roll out food security roadmaps that prioritize water-efficient cropping. Donor agencies co-finance sensor kits for date palm plantations and emerging grain belts, pairing them with solar-powered gateways. South America remains sizable thanks to soybean and sugarcane estates exceeding 10,000 acres, though macroeconomic swings occasionally defer upgrade cycles.

Competitive Landscape
The market remains moderately fragmented. Agricultural machinery giants like John Deere, AGCO, and CNH Industrial bundle proprietary displays, leveraging equipment footprints to cross-sell upgrades. Technology specialists Trimble, Topcon, and Ag Leader counter with brand-agnostic retrofit kits that preserve farmer freedom of choice. Cloud analytics has become the new battleground. Players race to ingest sensor, satellite, and weather data into unified dashboards that push prescriptive insights back to machines.
AI-driven anomaly detection and autonomous sensor calibration patents increased by 18% year-over-year, indicating potential upcoming feature advancements. This surge reflects the growing emphasis on leveraging artificial intelligence to enhance operational efficiency and accuracy across industries. The increase in patent activity also underscores the competitive landscape, as companies race to innovate and secure intellectual property in this rapidly evolving domain.
Equipment manufacturers are forming strategic partnerships with hyperscale cloud providers, aiming to leverage computing power without the overhead of building data centers. These alliances enable manufacturers to focus on core competencies while accessing scalable and cost-effective computing resources. Meanwhile, fresh players are capitalizing on the widespread use of smartphones in developing nations, introducing pay-as-you-go schemes that break down hardware expenses into harvest-tied payments. However, it's the deep industry expertise and close dealer relationships that fortify the position of established players, particularly when regulatory checks mandate certified devices.
Yield Monitoring Devices Industry Leaders
Deere & Company
Trimble Inc.
CNH Industrial N.V.
AGCO Corporation
Topcon Corporation
- *Disclaimer: Major Players sorted in no particular order


Recent Industry Developments
- February 2025: John Deere began shipping its Machine Sync guidance upgrade, allowing multiple combines and grain carts to coordinate harvest speed and positioning in real time, even across mixed-brand fleets.
- February 2025: Trimble introduced the Advisor Prime agronomic decision platform, bundling yield-monitor data, satellite imagery, and weather analytics into a single subscription for row-crop growers.
- February 2025: John Deere rolled out the Precision Essentials aftermarket kit, pairing a G5 display, StarFire 7500 receiver, and JDLink modem so older or non-Deere machines can stream live yield and equipment data to the Operations Center.
- January 2025: Deere also unwrapped new planter options, seed-level and fertilizer-level sensors, plus active-vacuum automation, delivering in-cab visibility of tank volumes and automatic vacuum adjustments to maintain target seed populations.


Global Yield Monitoring Devices Market Report Scope
The Yield Monitoring Devices Market Report is Segmented by Device Type (Mass Flow Sensors, Moisture Sensors, GPS Receivers, Other Sensor Types), Technology (GPS, GIS, Remote Sensing Systems, Guidance Systems, IoT-enabled Monitoring Systems), Component (Hardware, Software, Services), Application (Crop Scouting, Field Mapping, Variable Rate Application, Yield Analysis, Soil Monitoring, Others), End User (Individual Farmers, Corporate Farms, Agricultural Consultants, Research Bodies, Others), Sales Channel (OEMs, Aftermarket/Retail), and Geography (North America, South America, Europe, Asia Pacific, Middle East, Africa). The Market Forecasts are Provided in Terms of Value (USD), Based on Availability.
| Mass Flow Sensors |
| Moisture Sensors |
| GPS Receivers |
| Other Sensor Types |
| Global Positioning System (GPS) |
| Geographic Information System (GIS) |
| Remote Sensing Systems (Satellite, UAVs) |
| Guidance Systems |
| IoT-Enabled Monitoring Systems |
| Hardware | Sensors (Yield, Moisture, Flow) |
| GPS/GNSS Devices | |
| Display Units | |
| Control Units | |
| Software | Data Analytics Platforms |
| Farm Management Systems | |
| Mapping Software | |
| Services | System Integration |
| Maintenance and Support | |
| Consulting |
| Crop Scouting |
| Field Mapping |
| Variable Rate Application (Map-Based and Sensor-Based) |
| Yield Analysis |
| Soil Monitoring (Nutrient and Moisture Monitoring) |
| Other Applications |
| Individual Farmers |
| Corporate Farms |
| Agricultural Consultants |
| Research Bodies |
| Other End-Users |
| OEMs |
| Aftermarket/Retail |
| North America | United States |
| Canada | |
| Mexico | |
| South America | Brazil |
| Argentina | |
| Rest of South America | |
| Europe | Germany |
| United Kingdom | |
| France | |
| Russia | |
| Italy | |
| Spain | |
| Rest of Europe | |
| Asia Pacific | China |
| India | |
| Japan | |
| South Korea | |
| Australia | |
| Rest of Asia Pacific | |
| Middle East | Saudi Arabia |
| United Arab Emirates | |
| Turkey | |
| Rest of Middle East | |
| Africa | South Africa |
| Nigeria | |
| Egypt | |
| Rest of Africa |
| By Device Type | Mass Flow Sensors | |
| Moisture Sensors | ||
| GPS Receivers | ||
| Other Sensor Types | ||
| By Technology | Global Positioning System (GPS) | |
| Geographic Information System (GIS) | ||
| Remote Sensing Systems (Satellite, UAVs) | ||
| Guidance Systems | ||
| IoT-Enabled Monitoring Systems | ||
| By Component | Hardware | Sensors (Yield, Moisture, Flow) |
| GPS/GNSS Devices | ||
| Display Units | ||
| Control Units | ||
| Software | Data Analytics Platforms | |
| Farm Management Systems | ||
| Mapping Software | ||
| Services | System Integration | |
| Maintenance and Support | ||
| Consulting | ||
| By Application | Crop Scouting | |
| Field Mapping | ||
| Variable Rate Application (Map-Based and Sensor-Based) | ||
| Yield Analysis | ||
| Soil Monitoring (Nutrient and Moisture Monitoring) | ||
| Other Applications | ||
| By End User | Individual Farmers | |
| Corporate Farms | ||
| Agricultural Consultants | ||
| Research Bodies | ||
| Other End-Users | ||
| By Sales Channel | OEMs | |
| Aftermarket/Retail | ||
| By Geography | North America | United States |
| Canada | ||
| Mexico | ||
| South America | Brazil | |
| Argentina | ||
| Rest of South America | ||
| Europe | Germany | |
| United Kingdom | ||
| France | ||
| Russia | ||
| Italy | ||
| Spain | ||
| Rest of Europe | ||
| Asia Pacific | China | |
| India | ||
| Japan | ||
| South Korea | ||
| Australia | ||
| Rest of Asia Pacific | ||
| Middle East | Saudi Arabia | |
| United Arab Emirates | ||
| Turkey | ||
| Rest of Middle East | ||
| Africa | South Africa | |
| Nigeria | ||
| Egypt | ||
| Rest of Africa | ||


Key Questions Answered in the Report
How large is the yield monitoring market in 2026?
It stands at USD 3.12 billion in 2026 and is projected to reach USD 4.51 billion by 2031.
Which segment shows the highest yield monitoring market share by device type?
Mass flow sensors accounted for 38.20% of 2025 revenue.
Which geography is expanding fastest for yield monitoring solutions?
The Middle East and Africa region is growing at a 8.98% CAGR through 2031.
Why are individual farmers adopting yield monitoring faster than corporations?
Falling sensor prices, lease-to-own financing, and simplified user interfaces cut barriers for smallholders.
What key restraint affects adoption in tropical climates?
High humidity accelerates sensor calibration drift, increasing maintenance cycles and costs.
How does carbon credit monetization influence sensor uptake?
Verified yield data is required to claim credits, turning monitoring systems into revenue enablers for regenerative practices.
Page last updated on:


