X-ray Security Scanner Market Size and Share
Market Overview
| Study Period | 2020 - 2031 |
|---|---|
| Market Size (2026) | USD 6.42 Billion |
| Market Size (2031) | USD 10.64 Billion |
| Growth Rate (2026 - 2031) | 10.64% CAGR |
| Fastest Growing Market | Asia Pacific |
| Largest Market | North America |
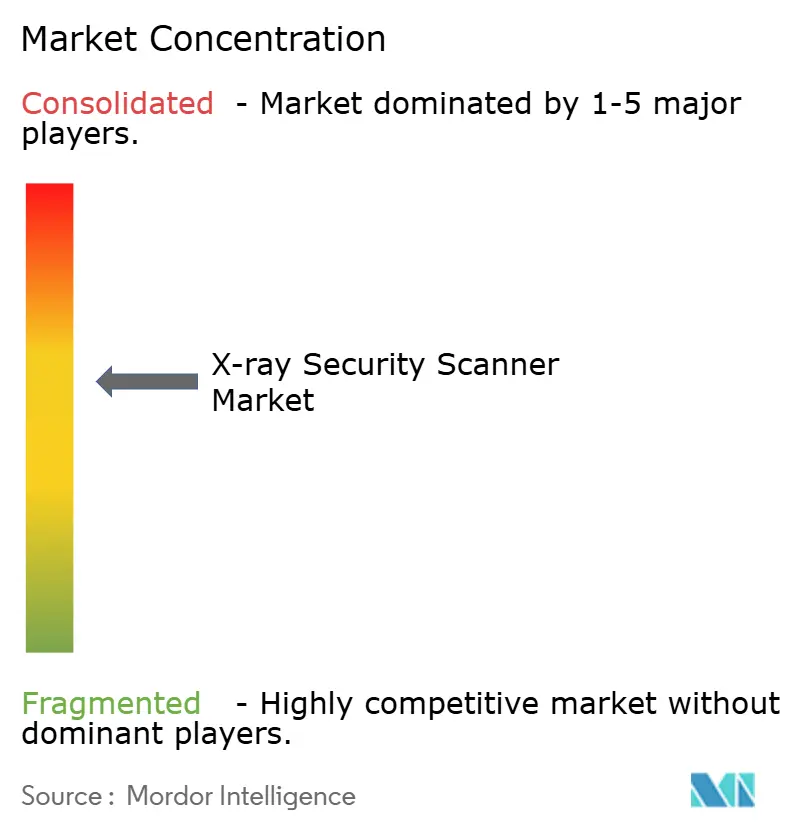
| Market Concentration | Medium |
Major Players *Disclaimer: Major Players sorted in no particular order Image © Mordor Intelligence. Reuse requires attribution under CC BY 4.0. | |

X-ray Security Scanner Market Analysis by Mordor Intelligence
The X-ray security scanner market size reached USD 6.42 billion in 2026 and is forecast to rise to USD 10.64 billion by 2031, reflecting a 10.64% CAGR across the period. Demand is accelerating as aviation regulators enforce 100% air-cargo screening, the European Union relaxes its 100 ml liquid rule for airports equipped with computed-tomography (CT) lanes, and cross-border e-commerce parcel flows drive postal operators toward high-throughput dual-view tunnels. At the same time, subscription-based screening-as-a-service contracts are shifting costs from capital budgets to operating budgets, while open-architecture mandates give buyers leverage to mix vendors within a single checkpoint. Competitive intensity is increasing as spectral-imaging startups enter border-patrol and event-security niches, and export-control regimes reshape the global supplier map. Airports, logistics hubs, and urban metros are therefore accelerating refresh cycles, lifting order backlogs for CT, dual-view, and portable systems.
Key Report Takeaways
- By application, cargo and baggage screening led with 46.2% revenue share in 2025, while mail and parcel inspection is projected to expand at a 10.87% CAGR through 2031.
- By end-user industry, aviation and transportation held 52.8% of the X-ray security scanner market share in 2025, yet commercial venues are forecast to grow at an 11.41% CAGR through 2031.
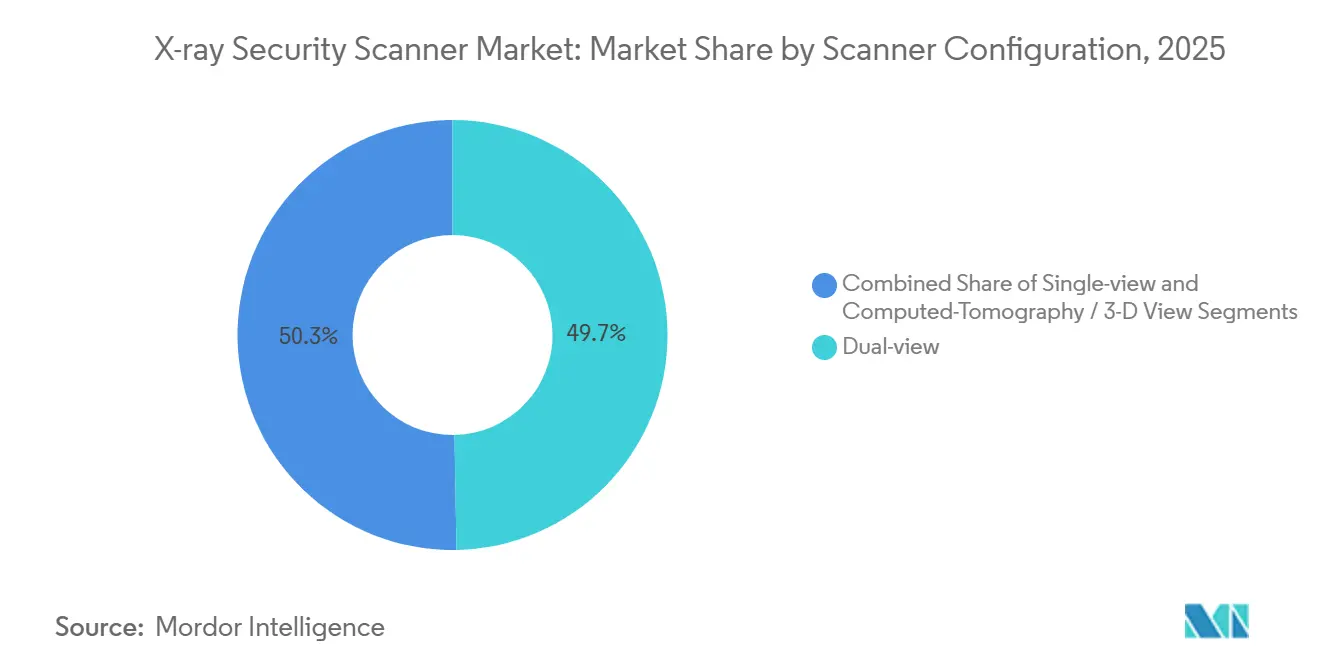
- By scanner configuration, dual-view systems captured 49.7% of the X-ray security scanner market size in 2025, whereas CT and 3-D platforms are advancing at an 11.73% CAGR to 2031.
- By imaging dimension, 2-D systems accounted for 58.4% share in 2025, but 3-D and volumetric imaging is expected to register a 10.98% CAGR through 2031.
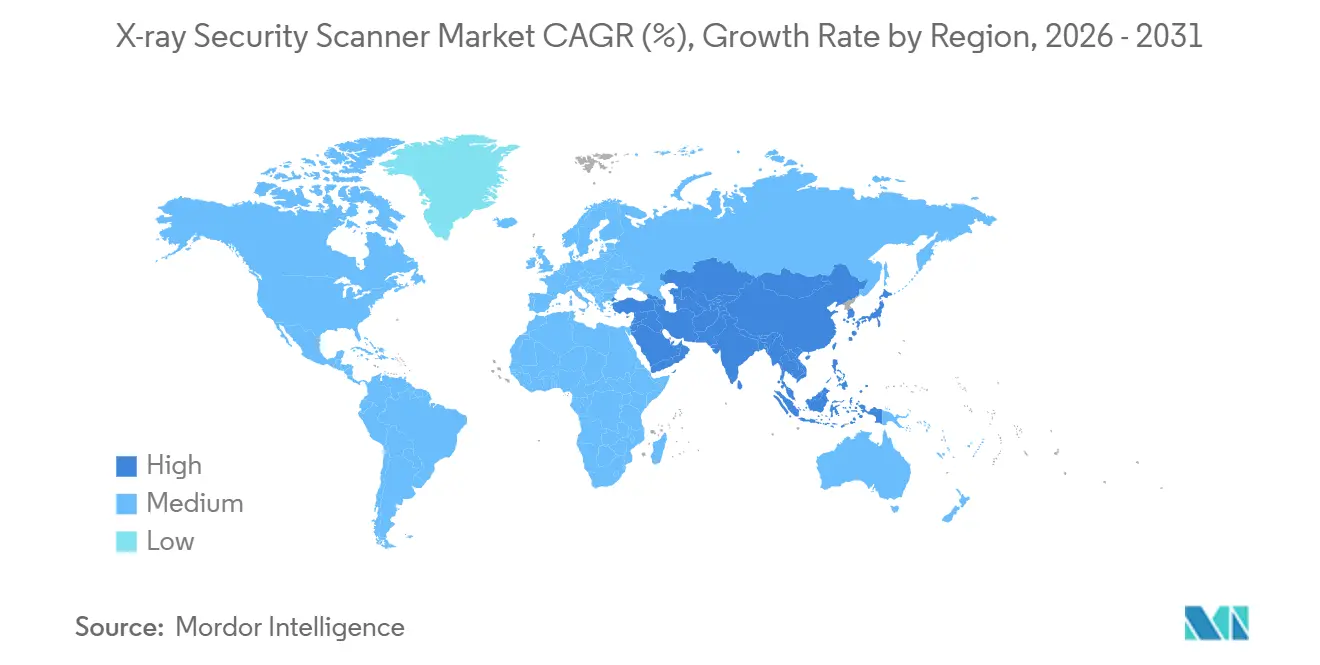
- By geography, North America accounted for 35.1% of 2025 revenue, while Asia Pacific is expected to post the fastest 11.26% CAGR to 2031.
Note: Market size and forecast figures in this report are generated using Mordor Intelligence’s proprietary estimation framework, updated with the latest available data and insights as of January 2026.
Global X-ray Security Scanner Market Trends and Insights
Drivers Impact Analysis*
| Driver | (~) % Impact on CAGR Forecast | Geographic Relevance | Impact Timeline |
|---|---|---|---|
| Heightened Enforcement of 100% Air-Cargo Screening Mandates | +2.30% | Global, with North America and Europe leading implementation | Medium term (2-4 years) |
| Relaxation of 100 ml Liquid Ban Driving EU Airport CT Scanner Roll-outs | +1.90% | Europe, with spillover to Middle East and Asia Pacific | Short term (≤ 2 years) |
| E-commerce Parcel Volumes Forcing High-Throughput Dual-View Systems | +2.10% | Global, concentrated in North America, Europe, and Asia Pacific | Medium term (2-4 years) |
| Urban Metro Expansions in Asia Pacific Requiring Compact Drive-Through Scanners | +1.70% | Asia Pacific core, with emerging adoption in Middle East and Africa | Long term (≥ 4 years) |
| Spectral Imaging Integration Enabling Automated Contraband Classification | +1.40% | Global, early adoption in North America and Europe | Medium term (2-4 years) |
| Subscription-Based Screening-as-a-Service Models for Tier-2 Airports | +1.20% | Global, with initial traction in North America and Europe | Short term (≤ 2 years) |
| Source: Mordor Intelligence | |||
Heightened Enforcement of 100% Air-Cargo Screening Mandates
Freight forwarders and airlines have lost exemptions that once allowed known-shipper cargo to bypass X-ray inspection. The Transportation Security Administration enlarged its Air Cargo Advance Screening program in 2024, requiring electronic manifests a full day before loading, then routing higher-risk pallets to CT or dual-energy units capable of detecting sheet explosives under 100 g.[1]Transportation Security Administration, “Capital Investment Plan Fiscal Year 2025,” TSA.GOV In 2025 the European Union Aviation Safety Agency imposed a volumetric-imaging requirement for cargo over 150 kg, covering 78% of wide-body belly freight.[2]European Union Aviation Safety Agency, “Cargo Screening Technical Specifications 2025,” EASA.EUROPA.EU Legacy single-view tunnels cannot meet these criteria because they lack atomic-number segmentation, so airports and ground-handling agents are accelerating refresh cycles. Integrators report that inline CT retrofits now represent 44% of new cargo projects in North America, compressing procurement timelines to under 18 months. Vendors that offer modular control software compatible with federal risk-based targeting interfaces are winning bids because they minimize integration risk.
Relaxation of 100 ml Liquid Ban Driving EU Airport CT Scanner Roll-outs
In 2024 the European Commission permitted member states to scrap the 100 ml carry-on liquid limit if checkpoints deploy C3-certified CT. Frankfurt Airport finished 42 CT lanes by December 2025, boosting passenger throughput 18% after laptops and liquids stayed inside bags. Charles de Gaulle Airport allocated EUR 120 million (USD 128 million) to refit 68 lanes by 2027.[3]Groupe ADP, “Paris Airports Modernization Program,” PARISAEROPORT.FR Although London Heathrow and Amsterdam Schiphol briefly reinstated the liquid rule in mid-2024 because of false-positive rates above 8%, software patches have since cut alarms below 4%, clearing a path to resume phase-in. Airport operators now view CT as essential not only for security compliance but also for customer-experience metrics that airlines use in slot-allocation negotiations.
E-commerce Parcel Volumes Forcing High-Throughput Dual-View Systems
The Universal Postal Union recorded 1.2 billion international parcels in 2023 and projects 1.8 billion by 2027, a compound growth trajectory of 10.8%. U.S. postal facilities reacted by installing 127 conveyor-integrated dual-view scanners in 2024, each processing 1,800 parcels per hour, while UPS embedded artificial-intelligence models that cut manual inspection from 22% to 9%. Dual-view tunnels strike a cost-performance balance: the orthogonal perspective catches concealed lithium batteries without the three-fold capital premium of CT. Parcel operators also prize the smaller footprint, which fits within space-constrained sortation centers. These investments are pushing the X-ray security scanner market toward predictive-maintenance contracts that guarantee uptime above 97%, since parcel hubs run 24/7 and stoppages ripple across global delivery timelines.
Urban Metro Expansions in Asia Pacific Requiring Compact Drive-Through Scanners
Asia Pacific metros logged 28 billion trips in 2024; security directives after the 2024 Kunming and 2008 Mumbai incidents now oblige X-ray bag screening at station entrances. Space limitations have driven suppliers to fold beam paths into 60 cm-wide tunnels capable of 400 bags per hour. Delhi Metro Rail Corporation alone installed 288 units by 2024, while Singapore’s Land Transport Authority integrated software templates for 12,000 contraband classes, lowering false alarms 34%. Vendors are developing hot-swap detector modules that operators can replace in 15 minutes, essential for lines that dispatch trains every 90 seconds. The metro pivot is broadening the X-ray security scanner market’s customer base beyond aviation and logistics, creating repeat orders for mid-tier OEMs.
Restraints Impact Analysis*
| Restraint | (~) % Impact on CAGR Forecast | Geographic Relevance | Impact Timeline |
|---|---|---|---|
| High CAPEX of CT and Dual-Energy Systems for Tier-2 Airports | -1.80% | Global, most acute in South America, Africa, and Southeast Asia | Medium term (2-4 years) |
| Public Health and Privacy Pushback on People Scanners at Stadiums | -0.90% | North America and Europe, with emerging concerns in Asia Pacific | Short term (≤ 2 years) |
| Export-Control Barriers on Dual-Use Detector Exports | -0.70% | Global, concentrated impact on China, Russia, and Middle East | Long term (≥ 4 years) |
| Millimeter-Wave Alternatives Reducing X-ray Scanner Adoption in Low-Dose Scenarios | -0.60% | Global, primarily affecting people-screening applications | Medium term (2-4 years) |
| Source: Mordor Intelligence | |||
High CAPEX of CT and Dual-Energy Systems for Tier-2 Airports
CT checkpoint scanners carry unit prices of USD 2.5 million to USD 3.2 million, about four times dual-view tunnels, and regional airports that process under 5 million passengers annually struggle to fund upgrades. In 2025 the Transportation Security Administration allocated USD 1.3 billion for 469 CT units, but U.S. tier-2 airports lacked matching grants and deferred projects. European operators face similar hurdles: 62% of airports below 3 million passengers postponed CT adoption in 2024, opting to extend the life of single-view tunnels through software patches. Leasing programs spread payments over seven to ten years yet add about 30% to total cost of ownership, squeezing operating margins. Without new financing tools, many smaller airports will remain outside the CT upgrade cycle through the medium term.
Public Health and Privacy Pushback on People Scanners at Stadiums
Full-body X-ray scanners installed at sports venues emit doses below 0.1 microsieverts per scan, but civil-liberties groups argue any ionizing radiation paired with detailed anatomical images violates privacy rights. The American Civil Liberties Union filed a 2024 lawsuit against deployments at National Football League stadiums, and the case remains in federal court. Concern intensified after leaked checkpoint images showed older backscatter models storing scans despite vendor deletion claims, prompting the National Institute of Standards and Technology to issue encryption and 24-hour purge mandates. Venue operators now favour millimeter-wave portals that use non-ionizing energy and display generic avatar silhouettes, yet these cost 20% more and slow throughput when heavy clothing requires additional scans. The controversy is delaying widespread rollout of X-ray people scanners in entertainment venues, limiting market penetration outside aviation and transit.
*Our forecasts treat driver/restraint impacts as directional, not additive. The impact forecasts reflect baseline growth, mix effects, and variable interactions.
Segment Analysis
By Application: Parcel Surge Reshapes Screening Priorities
Mail and parcel inspection is forecast to advance at a 10.87% CAGR through 2031, overtaking many legacy aviation projects. Universal Postal Union data show that international parcels will reach 1.8 billion by 2027, forcing postal operators to add orthogonal-view tunnels that scan at belt speeds above 1 m/s. United States Postal Service hubs adopted 127 high-speed systems in 2024, and UPS paired them with neural-network triage that cut secondary manual reviews to single-digit levels. These shifts underline how parcel operators, not airlines, are now dictating image-analysis roadmaps to vendors.
Cargo and baggage screening still represents the largest slice of the X-ray security scanner market size, powered by regulators that insist on 100% cargo inspection. The Transportation Security Administration bought 469 CT units for checkpoints in 2025, each averaging USD 2.77 million. Meanwhile, EASA rules require freight above 150 kg to undergo volumetric imaging, accelerating the replacement of single-view tunnels. People-screening deployments continue in urban transit, but privacy objections have slowed backscatter use in stadiums, nudging operators toward millimeter-wave alternatives.


By End-User Industry: Commercial Venues Accelerate Adoption
Commercial facilities (retail, hospitality, and corporate campuses) are projected to grow at an 11.41% CAGR through 2031 as insurers link lower premiums to perimeter screening. Data-center operators now place portals at loading docks after a 2024 breach in Virginia, and hotels follow Department of Homeland Security guidance designating them soft targets. Some retailers pilot exit-lane tunnels tied to RFID tags, cutting shrink by 12% in test stores, evidence that security scanners are migrating from high-risk aviation to everyday commercial settings.
Aviation remains dominant, with 52.8% 2025 market share, propelled by Transportation Security Administration CT contracts and Leidos’s USD 2.6 billion services deal covering 440 airports. Border agencies are also modernizing: U.S. Customs and Border Protection awarded USD 198 million for next-generation cargo scanners in 2024, embedding dual-energy discrimination to spot narcotics precursors. Critical-infrastructure sectors such as power plants now install portals to comply with North American Electric Reliability Corporation physical-security rules.
By Scanner Configuration: CT Systems Gain Despite Cost Premium
CT and 3-D scanners will post an 11.73% CAGR to 2031, fuelled by Europe’s C3 requirement that eliminates laptop and liquid removal at checkpoints. Frankfurt Airport measured 18% throughput gains after its 42-lane retrofit. The Transportation Security Administration’s 469-unit purchase validates a global shift toward volumetric imaging despite a four-fold price premium over dual-view systems.
Dual-view platforms, however, still dominated 49.7% of deployments in 2025. Parcel hubs prize their blend of cost efficiency and higher detection compared with single-view tunnels. Modular upgrade kits now let operators convert single-view models to dual-energy at 40% of replacement cost, extending legacy assets for five to seven years. These economical paths keep dual-view relevant in the X-ray security scanner market even as CT momentum builds.
By Imaging Dimension: Volumetric Systems Close Detection Gaps
Three-dimensional imaging is projected to advance at 10.98% CAGR through 2031, narrowing ground on 2-D imaging’s 58.4% 2025 share. The Transportation Security Administration raised its acceptance bar in 2024 by demanding 95% detection of threats under 50 g, a standard 2-D systems struggle to meet without double-digit false alarms. Volumetric imaging lets operators rotate digital objects, revealing thin-profile explosives invisible in planar views.
Two-dimensional imaging still prevails in metro stations and land borders where budgets are tight, and threat profiles favour bulk contraband. Delhi Metro’s 288 tunnels remain 2-D because riders must clear checkpoints in under 5 seconds. Customs officers at U.S. land crossings seized 127 tons of fentanyl precursors in 2024 using 2-D dual-energy portals. Agencies now pilot software that fuses multiple 2-D angles into pseudo-volumes, reaching 70% of CT capability at 30% of its cost.
Geography Analysis
Asia Pacific is expected to deliver an 11.26% CAGR to 2031, the fastest trajectory worldwide. China operated 10,287 km of urban rail in 2024, while India added 614 km between 2020 and 2025, and both require X-ray bag checks at metro entrances. Delhi Metro’s 288 tunnels scan 400 bags per peak-hour cycle, and Singapore reduced false alarms 34% by adding AI classifiers. Airport modernizations remain selective; India’s tier-2 airports continue to favour dual-view retrofits while awaiting federal funding for CT.
North America held 35.1% of 2025 revenue. The Transportation Security Administration’s 469-unit CT order and Leidos’s USD 2.6 billion logistics contract underline steady federal spending. U.S. border modernization also accelerates: Customs and Border Protection ordered USD 198 million in portals for land crossings. Canada allocated CAD 89 million (USD 66 million) to refresh scanners at the Ambassador Bridge and Peace Arch, while Mexico pilots CT lanes in Mexico City and Cancún.
Europe captured roughly 28% of 2025 turnover. Frankfurt and Paris airports are on track for full CT coverage by 2027, yet Heathrow and Schiphol resets show rollout risks. Middle Eastern hubs align with Gulf infrastructure spending: Dubai and Abu Dhabi expansions under UAE Vision 2030 prioritize CT and dual-energy deployments. Saudi Arabia’s Public Investment Fund earmarked USD 800 billion for general infrastructure, including aviation security upgrades. South America and Africa remain nascent, though South Africa’s Airports Company installed 14 CT lanes in 2024.

Competitive Landscape
Five suppliers: Smiths Detection, OSI Systems, Leidos, L3Harris Technologies, and Nuctech command roughly 60% of global revenue, underpinning a moderately consolidated structure. The Transportation Security Administration's open-architecture mandates, effective since 2024, allow airports to mix vendors in a checkpoint, eroding historic lock-in and letting tier-2 airports negotiate lower per-lane costs. Leidos secured a USD 2.6 billion logistics contract in January 2025, guaranteeing 98% uptime across 440 U.S. airports for seven years. OSI Systems reported USD 159 million in scanner orders during fiscal 2024-2025, including a USD 76 million turnkey program for a Middle Eastern client.
Smaller challengers target niches. VOTI Detection obtained Transportation Security Administration certification for a 3-D checkpoint scanner in 2024, opening U.S. federal bids. Viken Detection markets portable backscatter units for border patrol.
Export-control rules from the U.S. Department of Commerce now limit certain dual-use detector exports to China and Russia, while the European Commission continues due-diligence reviews of Nuctech deals at external borders. Competitive edge is shifting toward proprietary AI for automated contraband recognition: Smiths Detection’s iCMORE software, trained on 2.4 million threat images, achieved 92% accuracy with 5% false alarms in U.S. testing.
X-ray Security Scanner Industry Leaders
Rapiscan Systems Inc.
L3 Security and Detection Systems, Inc.
Astrophysics Inc.
Westminster International Limited
Smiths Detection Inc.
- *Disclaimer: Major Players sorted in no particular order

Recent Industry Developments
- May 2025: LINEV Systems rolled out AI-enhanced X-ray body scanners to 1,000 U.S. correctional facilities, cutting contraband incidents
- April 2025: Smiths Detection introduced the SDX 10060 XDi using X-ray diffraction for precise material identification
- February 2025: Leidos partnered with SeeTrue to embed AI threat-detection software in ClearScan CT platforms
- October 2024: TSA deployed 267 CT scanners at U.S. checkpoints to shorten screening time.


Research Methodology Framework and Report Scope
Market Definitions and Key Coverage
Our study defines the X-ray security scanner market as revenue generated from fixed, mobile, and portable X-ray systems deployed to screen people, baggage, mail, cargo, and vehicles at transportation hubs, border crossings, critical infrastructure, and commercial venues, identifying organic, inorganic, and metallic threats.
Scope exclusion: medical diagnostic X-ray devices and industrial quality-control inspection machines are outside the present scope.
Segmentation Overview
- By Application
- People Screening
- Product Screening
- Mail and Parcel
- Cargo and Baggage
- By End-user Industry
- Aviation and Transportation
- Law Enforcement
- Commercial (Retail, Hospitality, Corporate)
- Government and Border Security
- Critical Infrastructure (Energy, Nuclear, Data Centers)
- By Scanner Configuration
- Single-view
- Dual-view
- Computed-Tomography / 3-D View
- By Imaging Dimension
- 2-D Imaging
- 3-D / Volumetric Imaging
- By Geography
- North America
- United States
- Canada
- Mexico
- Rest of North America
- South America
- Brazil
- Argentina
- Chile
- Rest of South America
- Europe
- United Kingdom
- Germany
- France
- Italy
- Rest of Europe
- Asia Pacific
- China
- India
- Japan
- South Korea
- Rest of Asia Pacific
- Middle East
- Saudi Arabia
- United Arab Emirates
- Qatar
- Rest of Middle East
- Africa
- South Africa
- Nigeria
- Kenya
- Rest of Africa
- North America
Detailed Research Methodology and Data Validation
Primary Research
Our team interviewed checkpoint supervisors, homeland-security procurement officers, and regional distributors across the United States, Germany, the United Arab Emirates, India, China, and Brazil. These discussions tested lane-per-terminal ratios, confirmed typical replacement cycles, and flagged local price deviations that desk research alone could not capture.
Desk Research
We mined public-domain datasets such as Transportation Security Administration screening throughput, Eurostat airport freight tonnage, UN Comtrade HS 9022 trade flows, and International Air Transport Association passenger forecasts to construct baseline demand pools. Industry briefs from Airports Council International and the International Security Industry Organization clarified regulatory timelines for computed-tomography retrofits, while company 10-Ks, investor decks, and patent filings traced pricing and innovation curves. Dow Jones Factiva and D&B Hoovers supplied contract values and supplier financials that refined average selling prices. The sources listed illustrate the mix; many additional public records supported verification throughout the project.
Market-Sizing & Forecasting
A top-down model begins with annual passenger movements, parcel volumes, and container entries, applies observed scanner penetration rates, and then multiplies by region-specific ASPs that our primary contacts validated. Supplier revenue roll-ups, selective installation counts, and channel checks act as bottom-up reference points to adjust totals. Critical variables include airport passenger CAGR, e-commerce parcel growth, mandatory CT lane conversion schedules, unit ASP shifts, and average device life. Multivariate regression employing these drivers projects figures through 2030, while scenario analysis tests upside cases linked to accelerated regulatory mandates. When bottom-up evidence diverges materially, our analysts prioritize the dataset with superior audit trails.
Data Validation & Update Cycle
Before sign-off, every model passes variance scans against import data, procurement announcements, and sampled financial statements, followed by a two-level analyst review. Mordor updates the dataset annually and issues interim revisions when large contracts, regulatory changes, or currency swings alter the baseline.
Why Mordor's X-Ray Security Scanner Baseline Commands Reliability
Published estimates often differ because research houses select distinct product mixes, geographic roll-ups, and price assumptions.
Key gap drivers include some studies bundling ancillary metal detectors, others pricing units at list rather than transacted levels, inconsistent refresh cadences, and varied currency-conversion dates.
Benchmark comparison
| Market Size | Anonymized source | Primary gap driver |
|---|---|---|
| USD 4.40 B (2025) | Mordor Intelligence | |
| USD 3.67 B (2023) | Global Consultancy A | Excludes dual-view upgrades, uses 2023 FX |
| USD 3.45 B (2023) | Industry Analytics B | Omits portable units, merges inspection with security |
The comparison shows how Mordor's disciplined scope alignment, blended price verification, and timed refresh provide a balanced, transparent baseline that decision-makers can trust.


Key Questions Answered in the Report
What is the current value of the X-ray security scanner market?
The market generated USD 6.42 billion in 2026 and is projected to reach USD 10.64 billion by 2031.
Which region is expected to grow fastest through 2031?
Asia Pacific is forecast to register an 11.26% CAGR, led by metro-rail and airport projects in China, India, Japan, and South Korea.
Why are airports shifting from dual-view to CT scanners?
CT lanes meet new European C3 rules, allow liquids and laptops to stay in bags, and improve detection of sheet explosives below 100 g.
How are parcel volumes influencing scanner demand?
Cross-border e-commerce growth requires postal hubs to install high-throughput dual-view tunnels that process up to 1,800 parcels per hour.
What factors limit adoption at tier-2 airports?
CT systems cost USD 2.5-3.2 million each, and many smaller airports cannot finance upgrades without federal grants or rental programs.
Which companies dominate the market?
Smiths Detection, OSI Systems, Leidos, L3Harris Technologies, and Nuctech collectively capture about 60% of revenue.
Page last updated on:


