
Workspace As A Service (WaaS) Market Size and Share
Market Overview
| Study Period | 2020 - 2031 |
|---|---|
| Market Size (2026) | USD 11.21 Billion |
| Market Size (2031) | USD 19.6 Billion |
| Growth Rate (2026 - 2031) | 11.84 % |
| Fastest Growing Market | Asia Pacific |
| Largest Market | North America |
| Market Concentration | Medium |
Major Players *Disclaimer: Major Players sorted in no particular order Image © Mordor Intelligence. Reuse requires attribution under CC BY 4.0. | |
Workspace As A Service (WaaS) Market Analysis by Mordor Intelligence
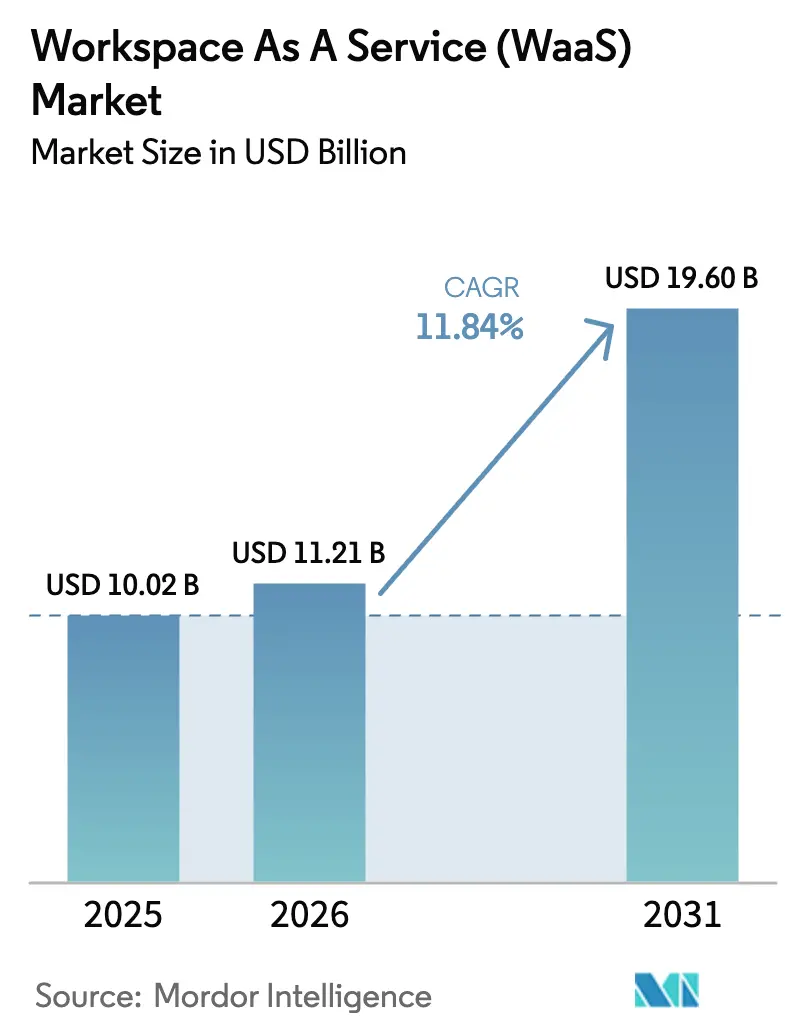
Workspace As A Service market size in 2026 is estimated at USD 11.21 billion, growing from 2025 value of USD 10.02 billion with 2031 projections showing USD 19.6 billion, growing at 11.84% CAGR over 2026-2031.
Growth is underpinned by enterprises shifting to cloud-first digital workplace architectures that converge security, compliance, and productivity tools into a single virtual experience. Hyperscaler capital spending exceeding USD 380 billion has unlocked global GPU capacity that supports AI-driven virtual desktops, while pay-as-you-go pricing keeps barriers low for small teams in every sector. Rapid adoption of zero-trust frameworks, rising compliance scrutiny, and secure hybrid-work requirements sustain demand across regulated verticals. Meanwhile, moderate market concentration encourages both incumbents and emerging cloud-native vendors to innovate around specialized workloads such as graphics design, financial trading, and real-time collaboration.
Key Report Takeaways
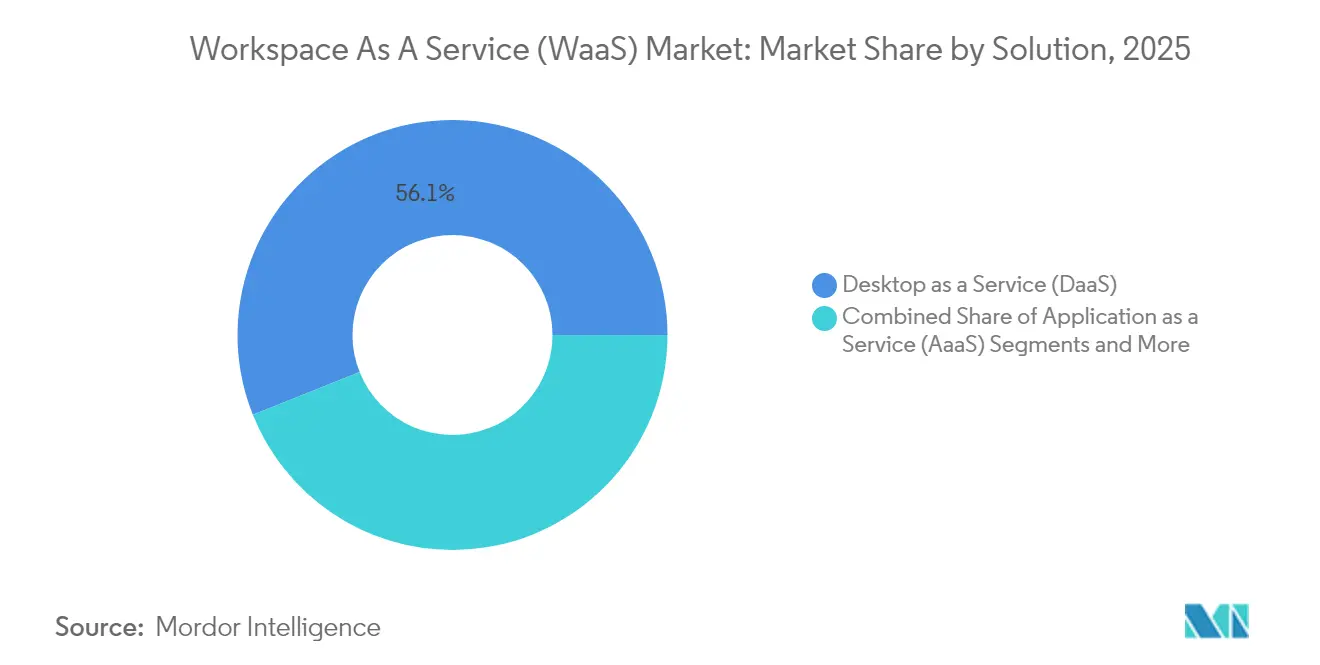
- By solution, Desktop as a Service led with 56.05% Workspace as a Service market share in 2025; Integrated Collaboration Suites are forecast to expand at a 12.72% CAGR through 2031.
- By deployment model, on-premise installations accounted for 66.80% of the Workspace as a Service market size in 2025; cloud deployment is set to grow at a 13.35% CAGR to 2031.
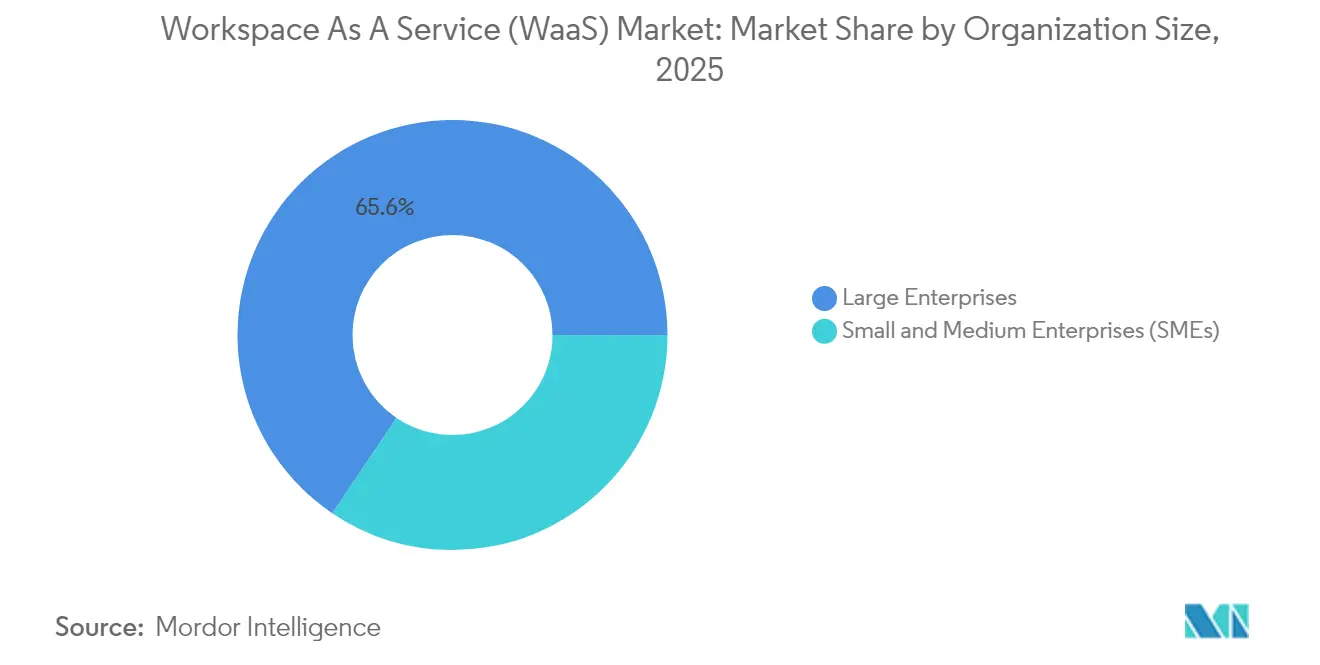
- By organization size, large enterprises held 65.55% share of the Workspace as a Service market in 2025, while the SME segment is projected to advance at a 13.1% CAGR through 2031.
- By end-user vertical, IT and Telecom captured 32.85% revenue share in 2025; BFSI is poised for the fastest 12.15% CAGR between 2026-2031.
- By geography, North America led with 35.15% Workspace as a Service market share in 2025; Asia-Pacific is projected to record the highest 12.32% CAGR through 2031.
Note: Market size and forecast figures in this report are generated using Mordor Intelligence’s proprietary estimation framework, updated with the latest available data and insights as of 2026.
Market Trends and Insights
Drivers Impact Analysis of Workspace As A Service (WaaS) Market*
| Driver | (~) % Impact on CAGR Forecast | Geographic Relevance | Impact Timeline |
|---|---|---|---|
| BYOD proliferation boosts WaaS demand | +2.8% | Global, with early gains in North America, Europe | Medium term (2-4 years) |
| Cloud-VDI cost and scalability advantages | +3.2% | Global, particularly Asia-Pacific SME markets | Short term (≤ 2 years) |
| Hybrid-work security requirements | +2.1% | North America and EU, spill-over to APAC | Short term (≤ 2 years) |
| Hyperscaler DaaS portfolio expansion | +2.5% | Global, concentrated in major cloud regions | Medium term (2-4 years) |
| ESG dashboards embedded in digital workplace | +0.8% | Europe, North America regulatory markets | Long term (≥ 4 years) |
| GPU-accelerated virtual workstations (AI/graphics) | +1.4% | North America, Europe, China AI hubs | Medium term (2-4 years) |
| Source: Mordor Intelligence | |||
BYOD Proliferation Boosts WaaS Demand
Organizations adopting Bring Your Own Device policies increasingly rely on centralized virtual desktops to protect data and enforce uniform security. Multi-factor authentication, granular conditional access, and session isolation embedded in WaaS reduce risks tied to unmanaged hardware. Accounting, legal, and design firms report faster onboarding of seasonal staff because virtual apps are delivered instantly to personal laptops and tablets. CIOs also cite improved IT asset visibility, since device-agnostic delivery keeps intellectual property inside the datacenter rather than on endpoints. This momentum positions BYOD as a mid-term driver across mature and emerging markets.
Cloud-VDI Cost and Scalability Advantages
Cloud-hosted virtual desktops lower total cost of ownership by removing bulk hardware refreshes and shifting expenditure to consumption-based models. Amazon WorkSpaces Thin Client devices start at USD 195 and stream encrypted pixels from the cloud, illustrating how central management reduces desk-side support[1]AWS, “Introducing WorkSpaces Thin Client,” aws.amazon.com. Microsoft Azure Virtual Desktop adds multi-session Windows 11 to maximize density, while global datacenter footprints enable instant scaling during mergers or peak project phases. These efficiencies resonate most strongly with Asia-Pacific SMEs that previously lacked capital for enterprise-grade infrastructure.
Hybrid-Work Security Requirements
Permanent hybrid workforces call for consolidated security stacks that enforce zero-trust principles. Virtual desktop infrastructure keeps sensitive data in the corporate cloud, applies centralized patching, and routes traffic through inspected channels. Financial institutions use PCI-DSS compliant VDI instances to allow traders, analysts, and support staff to operate from home without locally stored client data. Healthcare and public-sector agencies mirror this approach to protect electronic records and citizen information, making security a near-term catalyst for every regulated industry.
Hyperscaler DaaS Portfolio Expansion
AWS, Microsoft, and Google collectively earmarked over USD 380 billion for next-generation cloud hardware that powers GPU-accelerated virtual workstations. AWS leads with customer-committed outlays of USD 164 billion, closely followed by Microsoft Azure at USD 129.5 billion. Extended alliances—such as Citrix’s eight-year pact naming it Microsoft’s preferred Azure partner—bundle optimized storage, networking, and AI services for more than 100 million prospective users. GPU-focused neocloud providers including CoreWeave and Lambda Labs also gain ground by addressing AI and graphics jobs that benefit from low-contention clusters. This capital inflow broadens geographic reach and raises performance ceilings for the Workspace as a Service market.
Restraints Impact Analysis of Workspace As A Service (WaaS) Market*
| Restraint | (~) % Impact on CAGR Forecast | Geographic Relevance | Impact Timeline |
|---|---|---|---|
| Persistent network latency and bandwidth gaps | -1.8% | Rural areas globally, emerging markets | Short term (≤ 2 years) |
| Legacy-app integration complexity | -1.2% | Enterprise markets with established IT infrastructure | Medium term (2-4 years) |
| Rising cloud egress fees erode TCO | -0.9% | Global, particularly multi-cloud environments | Short term (≤ 2 years) |
| Data-sovereignty rules force local VDI footprint | -0.7% | Europe, regulated industries globally | Long term (≥ 4 years) |
| Source: Mordor Intelligence | |||
Persistent Network Latency and Bandwidth Gaps
Virtual desktops are highly sensitive to round-trip delay. Citrix benchmark testing shows user experience falls sharply once latency breaches 150 milliseconds and becomes unacceptable beyond 300 milliseconds. Many rural districts and emerging economies still rely on inconsistent broadband, leading to input lag, audio dropouts, and blurred graphics that discourage adoption. Hyperscalers mitigate constraints through nearby edge zones and adaptive UDP transport, yet last-mile infrastructure remains uneven. Government-sponsored fiber rollouts and 5G fixed-wireless pilots will be pivotal, especially for deployments involving high-definition video or CAD workloads.
Legacy-App Integration Complexity
Enterprises housing decades-old applications confront migration roadblocks. Older software often hard-codes device drivers or assumes specific operating systems, making virtual delivery arduous. IT teams must conduct compatibility testing, refactor code, or containerize executables—steps that inflate budgets and timelines. Heavily regulated sectors require additional validation before production use, adding to certification expenses. While modern Windows layering tools and application remoting brokers reduce some friction, the learning curve keeps a subset of mission-critical systems tied to on-premise silos longer than anticipated.
*Our forecasts treat driver/restraint impacts as directional, not additive. The impact forecasts reflect baseline growth, mix effects, and variable interactions.
Workspace As A Service (WaaS) Market Segment Analysis
By Solution:
Desktop Dominance Spurs Platform ConsolidationDesktop as a Service secured 56.05% share of the Workspace as a Service market in 2025, reflecting persistent demand for full operating-system images that support legacy line-of-business software. Enterprises favor the model because centralized patching, golden-image management, and instant rollback simplify compliance compared with individual laptops. DaaS adoption also scales smoothly for contractors and seasonal staff thanks to hourly billing. The segment’s leadership has prompted platform vendors to merge complementary functions such as identity, observability, and endpoint analytics into unified consoles.
Integrated Collaboration Suites represent the fastest-rising category at 12.72% CAGR through 2031. Bundles combining chat, calling, document co-authoring, and workflow automation reduce tool sprawl and encourage license consolidation. Microsoft Teams inside existing Office 365 agreements and Google Workspace in education and startup cohorts dominate volumes. Vendors now embed meeting-transcription AI, whiteboarding, and low-code process builders, positioning suites as a launchpad for broader digital experience platforms. This trajectory will gradually dilute standalone conferencing or storage solutions as firms gravitate toward cohesive ecosystems.



By Deployment Model:
Cloud Acceleration Reshapes InfrastructureOn-premise deployments controlled 66.80% of the Workspace as a Service market size in 2025 as enterprises leveraged sunk investments and asserted data sovereignty. Such estates often pair VDI software with hyperconverged clusters running in private datacenters. However, stringent capacity planning, hardware refresh cycles, and separate disaster-recovery sites keep capital costs high.
Cloud deployment is set to register the strongest 13.35% CAGR to 2031. Providers deliver enterprise-grade GPUs, automated elasticity, and global redundancy without upfront spend. Microsoft’s Azure Virtual Desktop on Azure Stack HCI bridges both worlds by hosting virtual session hosts on-premise while controlling them from the cloud. European organizations gravitate toward sovereign cloud regions that address GDPR and Schrems II data transfer rulings. Over time, the public-cloud operating model will dominate new greenfield deployments and workload expansion even among highly regulated entities.
By Organization Size:
SMEs Propel Incremental VolumeLarge enterprises accounted for 65.55% share of the Workspace as a Service market in 2025 thanks to expansive user counts and complex compliance regimes. Banks, telecom carriers, and global manufacturers deploy tens of thousands of virtual desktops to protect customer data, support merger transitions, and enable follow-the-sun engineering collaboration. Centralized management consoles, layered image strategies, and dedicated network circuits satisfy stringent performance SLAs.
Small and medium enterprises remain the most dynamic cohort with a 13.1% CAGR expected through 2031. SaaS-style subscription tiers allow growing businesses to access the same resilience and security as conglomerates without purchasing servers or hiring specialist administrators. Shared workspace operators and co-working brands in metropolitan hubs increasingly bundle virtual desktops alongside physical desks, enabling SMEs to spin up project-based teams overnight. As vendors simplify onboarding through browser-based setup wizards and integrated billing, SME demand will steadily widen overall addressable volume.
By End-user Vertical:
Regulated Sectors Command Early UptakeIT and Telecom secured 32.85% of Workspace as a Service market share in 2025 because software developers, network engineers, and support centers require secure lab environments reachable from any location. Frequent code builds and network-schema testing exploit the elasticity of VDI farms to shorten release cycles and reduce hardware investment.
BFSI is forecast to deliver the fastest 12.15% CAGR between 2026-2031. Financial institutions adopt hardened virtual desktops that retain sensitive data inside datacenter perimeters and automate compliance reporting. Zero-trust segmentation and built-in session recording satisfy audit mandates from regulators across North America, Europe, and the Middle East. Insurance carriers mirror banks by rolling out digital workspaces that permit remote claims processing and actuarial analysis under tight privacy rules. Education, government, and healthcare segments add incremental volume through distance learning, citizen services, and electronic medical record initiatives, respectively.
Geography Analysis
North America Workspace As a Service (WaaS) Market
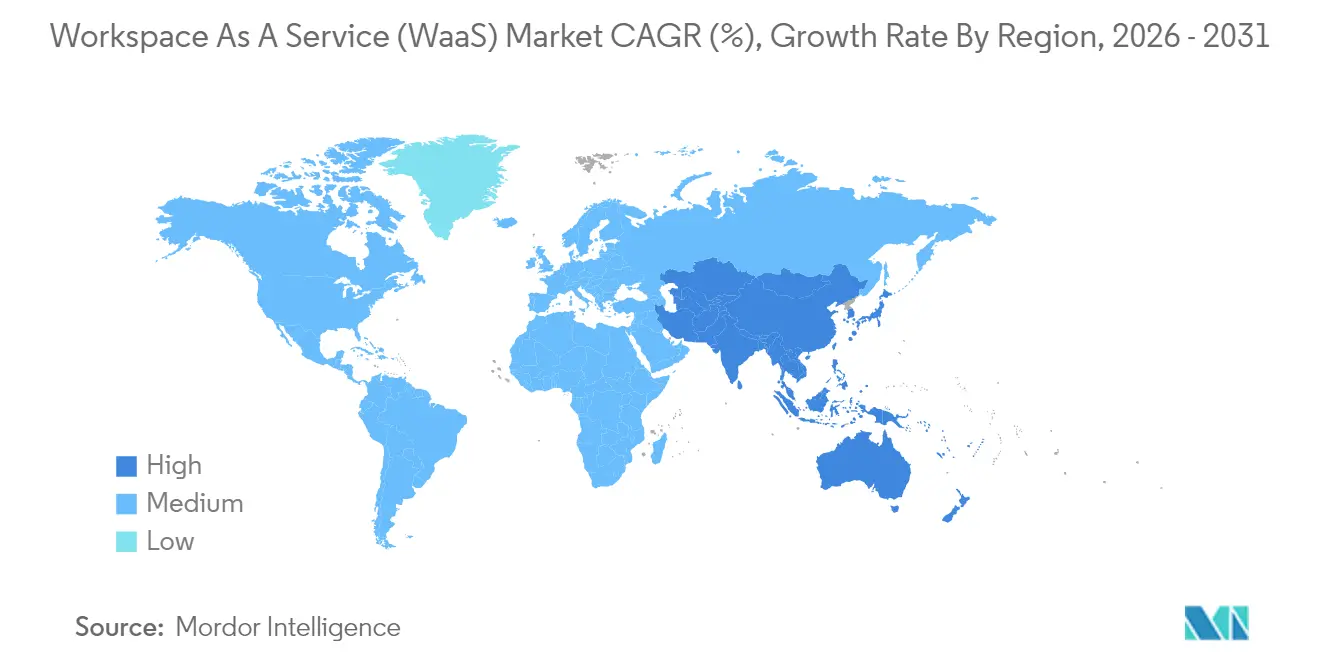
North America retained leadership with 35.15% share of the Workspace as a Service market in 2025, supported by mature cloud infrastructure, high broadband penetration, and early adoption across technology, finance, and media. Regulatory clarity around remote work data controls accelerated rollouts, while hyperscaler density in multiple metropolitan zones kept latency within optimal thresholds. Ongoing private-sector investments in AI-optimized datacenters, including Amazon’s USD 10 billion North Carolina campus, continue to reinforce the regional supply base.
APAC Workspace As a Service (WaaS) Market
Asia-Pacific is projected to record the fastest 12.32% CAGR to 2031. Governments in India, Indonesia, and Vietnam earmark grants and spectrum incentives to extend fiber and 5G coverage, enabling SMEs and public agencies to leapfrog on-premise IT in favor of cloud desktops. Amazon’s AU$20 billion allocation for Australian datacenters paired with new solar farms underscores regional appetite for green infrastructure. Domestic cloud providers in Japan and South Korea are also launching GPU-rich clusters to support language-model development and 3D design, fueling demand for high-performance workstations served from nearby zones.
EMEA and LATAM Workspace As a Service (WaaS) Market
Europe remains a growth pivot anchored on sovereign cloud frameworks. The European Data Act and sector-specific mandates force workloads to stay inside regional boundaries, prompting France, Germany, and the Nordics to adopt trusted cloud partner networks. VMware’s sovereign-cloud reference architecture offers standardized compliance templates that expedite virtual desktop certification. As firms renew hardware cycles, many downsize on-premise racks and subscribe to sanctioned public-cloud regions, blending performance with legal assurance. The Middle East and Africa register nascent uptake tied to economic diversification programs, while Latin America sees steady momentum where fiber backbones and edge nodes close historic bandwidth gaps.

Regulatory Landscape
Workspace as a Service (WaaS) vendors and enterprise buyers work within expanding cybersecurity and digital-market oversight that can shape remote-access architectures, incident reporting, and procurement requirements. In the European Union, the NIS2 Directive (Directive (EU) 2022/2555) sets mandatory cybersecurity risk-management and incident-reporting requirements for cloud computing service providers and many regulated customers, and Commission Implementing Regulation (EU) 2024/2690 further specifies technical and methodological measures that affect managed service and cloud operations supporting virtual desktops and collaboration stacks.
Security and competition frameworks also influence vendor practices and contract terms. In March 2026, the UK Competition and Markets Authority (CMA) outlined a program of actions under the Digital Markets Competition Regime focused on cloud services and business software, increasing scrutiny on switching, interoperability, and market power in the platforms that underpin WaaS delivery. In the United States, federal guidance used in public-sector deployments continues to emphasize secure remote access and governance (including CISA TIC 3.0 remote user guidance and NIST SP 800-46r2 recommendations for telework and BYOD), reinforcing requirements for MFA, policy auditing, and controlled access pathways in WaaS environments.
Value Chain Analysis
The WaaS value chain starts with endpoint hardware and peripherals, including thin clients and employee-owned devices under BYOD, then moves to the infrastructure layer that provides compute, storage, networking, and, in many deployments, GPU capacity across hyperscaler regions and colocation facilities (with providers such as AWS, Microsoft Azure, Google Cloud, Equinix, and Digital Realty). Above the infrastructure, software and platform layers deliver virtual desktops and applications (VDI/DaaS control planes), identity and access management, security tooling, and integrated collaboration suites that collectively form the delivered workspace experience.
System integrators and managed service providers typically sit between platforms and customers, bundling provisioning, image management, patching, monitoring, service desk, and compliance reporting into contract-based offerings (for example, Wipro positioning WaaS360-style managed workplace delivery). Key friction points across the chain include last-mile bandwidth and latency limits that can reduce VDI user experience, governance across multiple vendors spanning hyperscalers, VDI platforms, and security contracts, and integration of legacy applications not designed for virtual delivery. These constraints elevate the role of orchestration, observability, and security policy automation for providers that aim to serve as the single accountable layer for the end customer.
Competitive Landscape
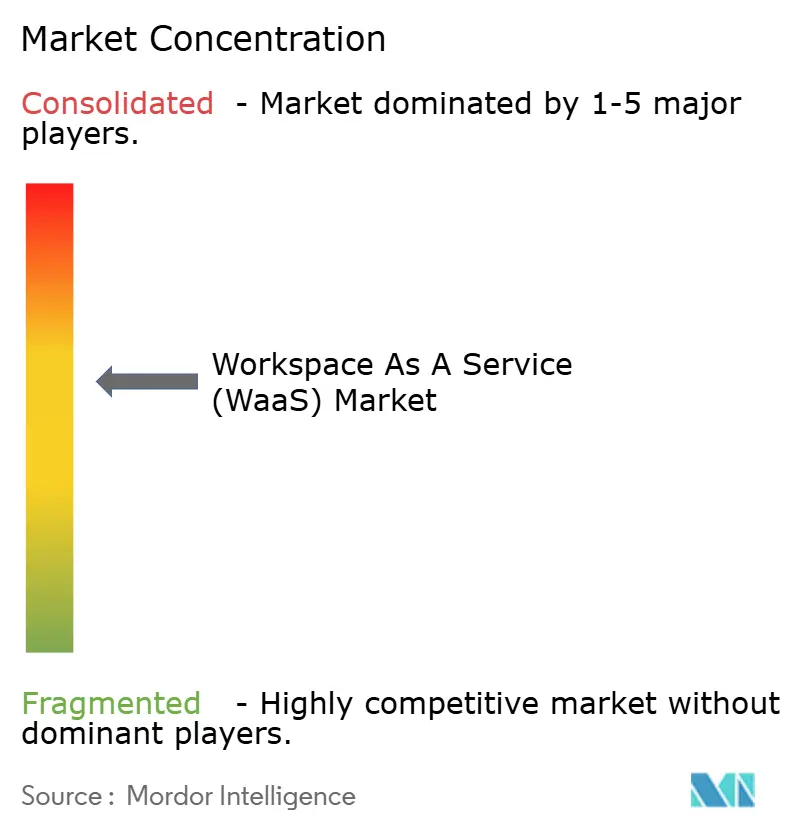
Competition remains balanced between hyperscalers, diversified enterprise software vendors, and pure-play workspace specialists. The 2024 spin-out of VMware’s End-User Computing unit into Omnissa, backed by KKR, preserved USD 1.5 billion in recurring revenue across 26,000 customers and repositioned Horizon and Workspace ONE as independent pillars. Omnissa immediately unveiled a three-tier partner program in March 2025 aimed at 6-8% growth through richer channel incentives. Microsoft, AWS, and Google counter with first-party offerings such as Windows 365, Amazon WorkSpaces, and Google Cloud Workstations that combine identity, analytics, and AI under single bills.
Strategic acquisitions emphasize automation and security. ServiceNow completed its USD 2.85 billion purchase of Moveworks in March 2025 to embed conversational AI across IT service desks. IBM agreed to buy HashiCorp for USD 35 per share in February 2025, augmenting its hybrid-cloud orchestration playbooks with secure secret management. These moves tighten end-to-end workflow control and unlock cross-sell potential into virtual desktop estates.
Technology differentiation now centers on GPU density, real-time collaboration, and policy automation. NVIDIA’s RTX Virtual Workstation stack enables high-frame-rate CAD and AI training through Citrix and VMware integrations. Citrix and Microsoft deepen integration of Teams optimizations, promising sub-100 millisecond click-to-render performance for audio/video sessions. Meanwhile, neocloud contenders like CoreWeave secure blockbuster financing rounds to build AI-optimized server farms, positioning themselves as cost-effective alternatives for deep-learning workloads that exceed mainstream hyperscaler quotas. Customers weigh portability, compliance, and unit economics when selecting among these diverse delivery models.
Workspace As A Service (WaaS) Industry Leaders
Amazon Web Services Inc.
VMware Inc.
Citrix Systems Inc.
Microsoft Corporation
Unisys Corporation
- *Disclaimer: Major Players sorted in no particular order
Workspace As A Service (WaaS) Market Companies Covered in this Report
- Amazon Web Services Inc.
- VMware Inc.
- Citrix Systems Inc.
- Microsoft Corporation
- Google LLC
- IBM Corporation
- Cisco Systems Inc.
- Accenture plc
- DXC Technology Co.
- Hewlett Packard Enterprise
- Nutanix Inc.
- Workspot Inc.
- Cloudalize NV
- Dizzion Inc.
- Getronics NV
- Unisys Corporation
- NTT DATA Corporation
- Colt Technology Services
- Oracle Corporation
- Huawei Technologies Co. Ltd.

Market Opportunities and Future Outlook
One practical whitespace for WaaS is in regulated, audit-heavy remote-work environments that require prescriptive cybersecurity controls aligned to procurement and reporting requirements, particularly in Europe where NIS2 obligations and Commission Implementing Regulation (EU) 2024/2690 raise the bar for demonstrable risk management in cloud and managed service delivery. Providers that package hardened virtual desktops with integrated identity, session controls, and standardized reporting templates can see clearer buying triggers in public sector and critical-industry supply chains where compliance work cannot be separated from the digital workplace.
There is also room to expand high-performance and automation-led workspaces as hyperscaler investment increases GPU-rich infrastructure availability and as enterprises look to operationalize AI within the desktop experience instead of only in standalone applications. The market already shows platform movement in this direction, including AWS making Amazon WorkSpaces for AI agents generally available in June 2026 to support automation that can interact with legacy desktop applications without requiring modernization or new APIs. Separately, cloud economics and architecture choices create openings for vendors and MSPs that can reduce egress and complexity through workload placement, hybrid controls (including VMware estate connectivity to public cloud), and end-to-end observability across device, session, network, and security layers.
Recent Industry Developments in Workspace As A Service (WaaS) Market
- June 2026: Amazon Web Services made Amazon WorkSpaces for AI agents generally available, enabling agents to operate within legacy desktop applications without requiring new APIs or application modernization. This expands WorkSpaces from a virtual desktop delivery service into an automation-ready workspace layer, raising the feature bar for competing WaaS and DaaS platforms targeting legacy-heavy enterprises.
- August 2025: AWS announced the general availability of Amazon Elastic VMware Service, enabling organizations to run VMware workloads on AWS infrastructure. The move supports hybrid workspace designs where VMware-based VDI and management stacks can be paired with cloud elasticity, influencing migration paths for enterprises standardizing WaaS delivery.
- June 2024: AWS launched Amazon WorkSpaces Pools, introducing a shared pool of virtual desktops designed for scenarios such as training labs and contact centers. Pooled provisioning strengthens cost and administration efficiency for bursty user populations, expanding addressable use cases beyond persistent named-user desktops.


Workspace As A Service (WaaS) Market Report Scope and Research Methodology
Market Definition and Coverage
We define the workspace as a service (WaaS) market as the packaged delivery of virtual workspaces and related managed services that let users securely access desktops and business apps from different devices, typically through cloud and hybrid environments.
Scope exclusions: This sizing excludes spending that is only for end-user hardware purchases and general connectivity services when they are not bundled as part of a WaaS subscription or managed workspace contract.
Segments Covered in This Report
- By Solution
- Desktop as a Service (DaaS)
- Application as a Service (AaaS)
- Managed Security and Compliance-aaS
- Integrated Collaboration Suites
- By Deployment Model
- On-Premise
- Cloud
- By Organization Size
- Large Enterprises
- Small and Medium Enterprises (SMEs)
- By End-user Vertical
- BFSI
- Education
- Retail and e-Commerce
- Government and Public Sector
- IT and Telecom
- Other End-user Verticals
- By Geography
- North America
- United States
- Canada
- Mexico
- Europe
- Germany
- United Kingdom
- France
- Italy
- Spain
- Rest of Europe
- Asia-Pacific
- China
- Japan
- India
- South Korea
- Australia
- Rest of Asia-Pacific
- South America
- Brazil
- Argentina
- Rest of South America
- Middle East and Africa
- Middle East
- Saudi Arabia
- United Arab Emirates
- Turkey
- Rest of Middle East
- Africa
- South Africa
- Egypt
- Nigeria
- Rest of Africa
- Middle East
- North America
Data Sources, Market Sizing, and Validation
Desk Research
Desk research was used to map what is counted as WaaS and to set boundaries between cloud workspace subscriptions, virtualization software, and managed workplace services. It also helped build the starting demand pool, especially by tracking remote and hybrid work adoption signals and enterprise IT spending direction.
Public and official sources that shaped the model included, for example, US Bureau of Labor Statistics releases on work patterns, OECD and World Bank macro indicators, ITU digital access indicators, NIST and other public cybersecurity guidance, and peer reviewed journals on virtual desktop performance and security. We also reviewed company filings, product documentation, investor presentations, association websites, and reputable press, then cross checked financial and contract signals using paid subscriptions for company financials and intelligence, news and financials, patent databases, and global contracts and tenders. These are illustrative source types, and many other references were used to collect data, validate assumptions, and clarify open questions.
Primary Interviews and Surveys
Primary work focused on getting real world pricing logic and adoption patterns that are often not visible in public sources. This included how buyers bundle DaaS and AaaS, how security and compliance services are charged, and when deployments stay private versus move to public cloud. We spoke with a mix of WaaS providers, channel partners, and enterprise IT decision makers across the Americas, EMEA, and APAC, so regional purchase cycles and contract lengths could be reflected. We then used the respondent inputs to validate sizing assumptions and close gaps left by desk research.
Distribution of primary research fieldwork respondents
| Company type | Respondent position | Region |
|---|---|---|
| Top tier: 26% | CXOs: 13% | APAC: 50% |
| Mid tier: 60% | Functional/Unit leaders: 37% | EMEA: 31% |
| Smaller Players: 14% | Managers: 50% | Americas: 19% |
Market-Sizing & Forecasting
The market was first constructed using a top-down approach, where enterprise digital workplace spend, remote and hybrid workforce penetration, and cloud workspace adoption rates are translated into an addressable WaaS demand pool by region. After the structure was in place, we corroborated the totals with selective bottom-up checks, such as sampling subscription price bands, mapping active users for typical enterprise rollouts, and validating provider-side revenue splits between DaaS, AaaS, and related managed services.
Key model inputs included indicators like enterprise seat counts and knowledge worker mix, cloud migration pace for end-user computing, security and compliance requirements that drive managed add-ons, average contract duration and renewal rates, and region-level price dispersion driven by labor and hosting costs. Where data was missing for smaller countries or niche verticals, we used proxy variables like IT services intensity and cloud infrastructure maturity, then adjusted the implied adoption curve using interview feedback.
Forecasting used scenario analysis supported by a multivariate regression layer, with demand linked to remote work prevalence, enterprise IT budget growth, and cloud adoption signals. ASP progression was kept practical by modeling list-to-net behavior, typical discounting for larger seat blocks, and periodic price resets at renewal, which helped keep the forecast consistent with how WaaS contracts are priced in practice.
Data Validation & Update Cycle
Before finalizing results, outputs were triangulated against independent signals, including regional IT services growth rates, cloud workplace adoption announcements, and observed pricing movement for standard workspace bundles. Any sharp year-to-year changes were reviewed through variance checks, and we re-tested underlying drivers to ensure one-off events did not shift the curve.
A multi-step analyst review is followed before sign-off, and re-contact is triggered when a key input changes, such as a noticeable change in contract length assumptions or a step-change in cloud pricing. Reports are refreshed annually, with interim updates when material events occur, and a final pre-delivery pass is completed so clients receive the most current view available.
Mordor Intelligence's Workspace As A Service Waas Market Size Versus Other Published Estimates
Published market values for WaaS still vary, even when they appear to cover the same topic, because pricing is subscription-led and scope lines are easy to draw differently. Differences usually come from what is counted as WaaS versus adjacent digital workplace services, how currency conversion timing is handled, and whether list prices or realized contract prices are used.
In this study, a consistent refresh cycle and fixed currency timing were applied. ASPs were normalized through contract-length and discount checks gathered from interviews, which is why the 2026 total aligns to a repeatable subscription revenue view used by Mordor Intelligence.
Benchmark comparison
| Source | Market Size | Gaps in Research Methodology |
|---|---|---|
| Mordor Intelligence | USD 11.21 B (2026) | |
| Industry Research Publisher A | USD 11.52 B (2025) | Uses a different base year and forecast window, and the definition can lean broader toward workplace services, which can lift the total when bundled management services are counted more freely. |
| Industry Research Publisher B | USD 9.94 B (2024) | Reports an earlier-year value and applies a different pricing and growth curve, which can understate the current cycle if renewal-driven ASP resets and newer cloud-first adoption are not fully reflected. |
The table shows that much of the spread is explained by year selection and what gets bundled into the definition, followed by differences in how subscription pricing is translated into annual revenue. By keeping the scope anchored to WaaS subscriptions and validating key assumptions like discounting and renewal timing, the estimate stays traceable to clear drivers and can be re-run as new inputs are observed.


Key Questions Answered in the Report
What is the current size of the Workspace as a Service market?
The market stood at USD 11.21 billion in 2026 and is projected to reach USD 19.6 billion by 2031.
Which solution type holds the largest Workspace as a Service market share?
Desktop as a Service leads with 56.05% share, supported by broad enterprise preference for full virtual desktop environments.
Why are SMEs adopting Workspace as a Service so quickly?
Pay-as-you-go pricing, simple browser-based setup, and no server capital expenditure allow SMEs to gain enterprise-grade security and scalability without dedicated IT staff.
How fast is cloud deployment expected to grow?
Cloud deployment of virtual desktops is forecast to expand at a 13.35% CAGR between 2026 and 2031 as organizations shift from on-premise hardware to elastic public cloud services.
Which geography is the fastest-growing for Workspace as a Service?
Asia-Pacific is projected to deliver a 12.32% CAGR to 2031, propelled by rapid digitization, growing SME bases, and large hyperscaler investments.
What is driving Workspace as a Service adoption in regulated sectors like BFSI?
Centralized data control, zero-trust security, and built-in compliance reporting enable banks and insurers to support hybrid work while meeting rigorous audit requirements.
Page last updated on:





