
Peptide Therapeutics Market Size and Share
Market Overview
| Study Period | 2020 - 2031 |
|---|---|
| Market Size (2026) | USD 49.68 Billion |
| Market Size (2031) | USD 70.20 Billion |
| Growth Rate (2026 - 2031) | 7.16 % |
| Fastest Growing Market | Asia Pacific |
| Largest Market | North America |
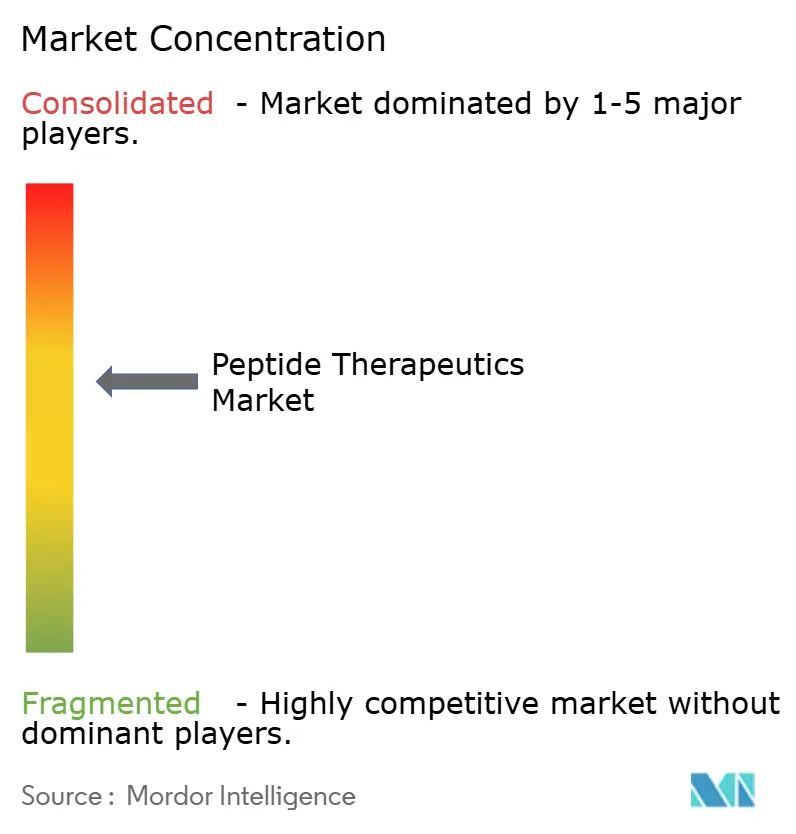
| Market Concentration | Medium |
Major Players *Disclaimer: Major Players sorted in no particular order Image © Mordor Intelligence. Reuse requires attribution under CC BY 4.0. | |
Peptide Therapeutics Market Analysis by Mordor Intelligence
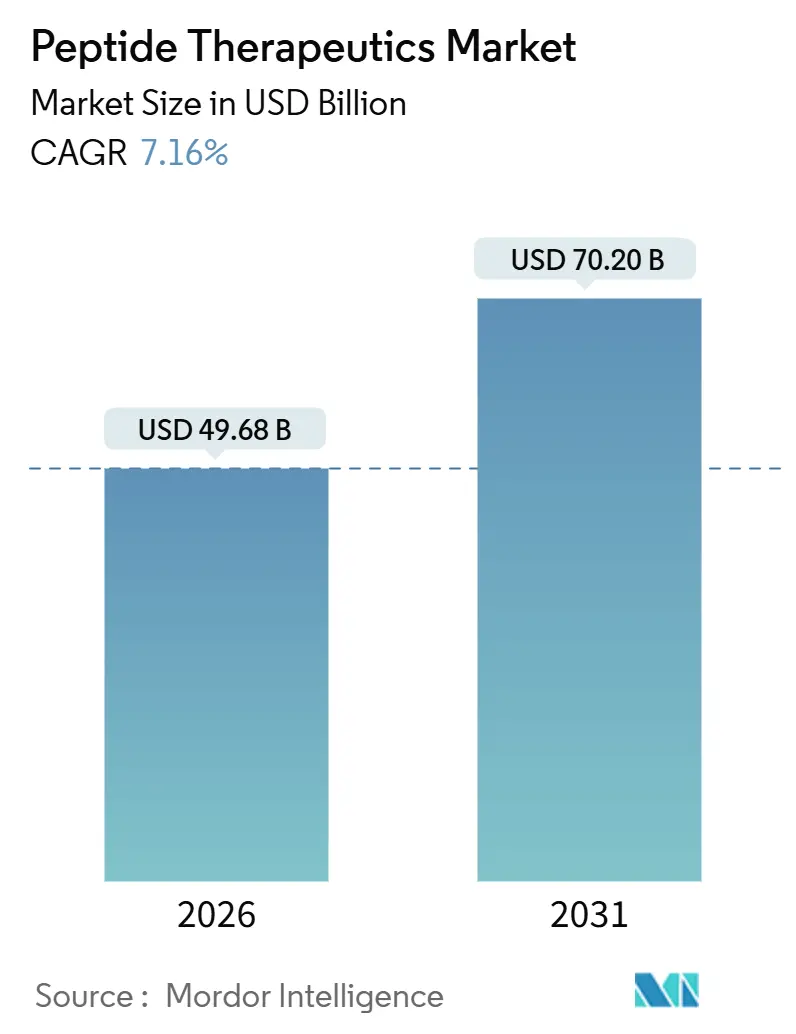
The Peptide Therapeutics Market size is estimated at USD 49.68 billion in 2026, and is expected to reach USD 70.20 billion by 2031, at a CAGR of 7.16% during the forecast period (2026-2031).
Advances in GLP-1 receptor agonists, multi-agonist peptides, and AI-enabled discovery are repositioning peptides as the core growth engine of post-biologic drug pipelines. Big-pharma funding, exemplified by billion-dollar deals from Novo Nordisk, Roche, and Novartis, is accelerating clinical translation while on-shoring incentives in the United States and Europe reshape manufacturing footprints. Recombinant expression, continuous-flow SPPS, and hybrid synthesis platforms are lowering cost-of-goods for long sequences, and regulatory fast-track pathways for rare diseases are compressing time-to-market. At the same time, stricter impurity guidelines and supply bottlenecks in specialty resins keep quality-control costs elevated, sustaining price premiums for branded formulations.
Key Report Takeaways
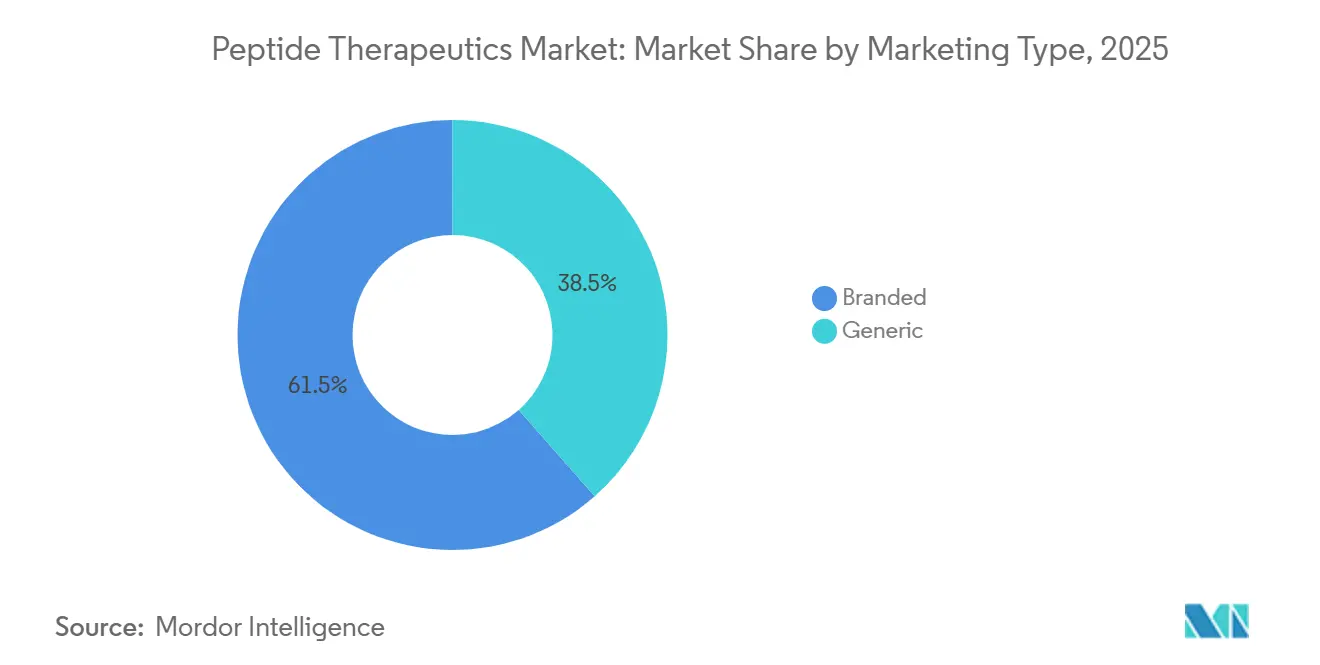
- By marketing type, branded peptides held 61.55% of peptide therapeutics market share in 2025, while generic peptides are advancing at an 8.25% CAGR through 2031.
- By application, oncology led with 35.53% revenue share in 2025; gastrointestinal disorders are projected to expand at an 11.85% CAGR to 2031.
- By route of administration, parenteral products accounted for 80.63% of 2025 volumes, whereas oral formulations are pacing at a 12.87% CAGR through 2031.
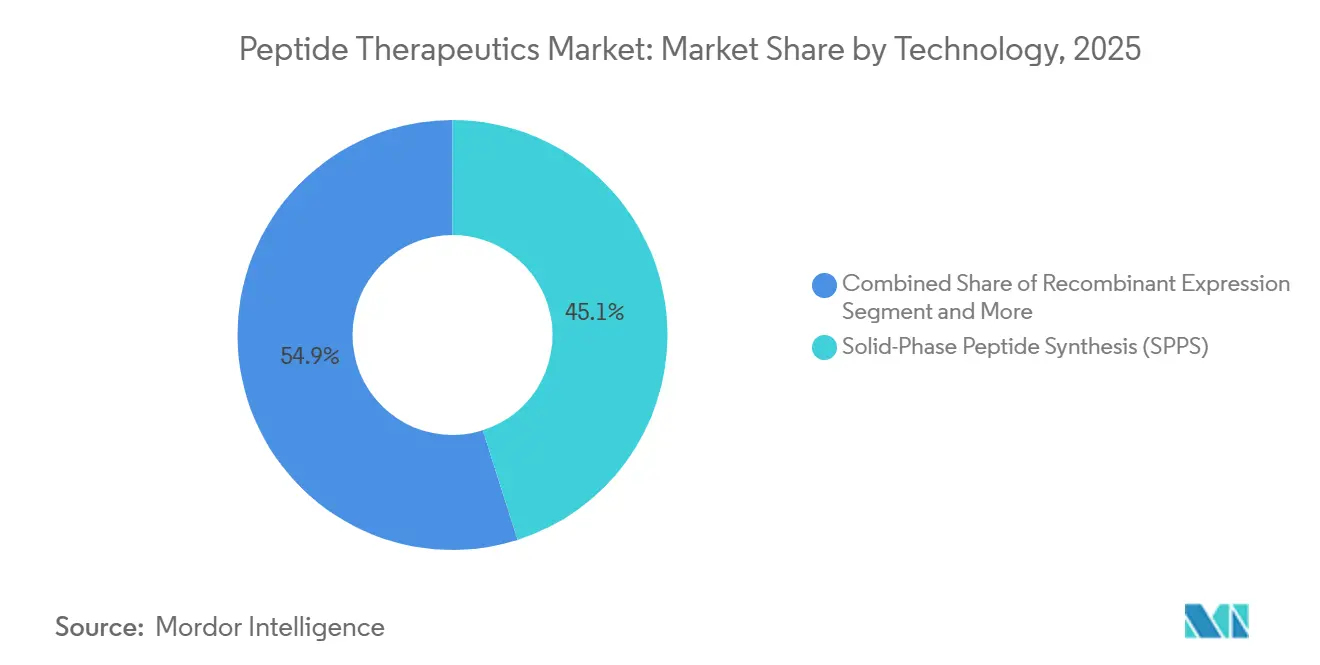
- By technology, solid-phase peptide synthesis held 45.13% share of the peptide therapeutics market size in 2025 and recombinant expression is increasing at a 13.7% CAGR through 2031.
- By end user, hospitals and clinics represented 42.24% share in 2025, while pharmaceutical and biotech companies are growing at a 12.51% CAGR to 2031.
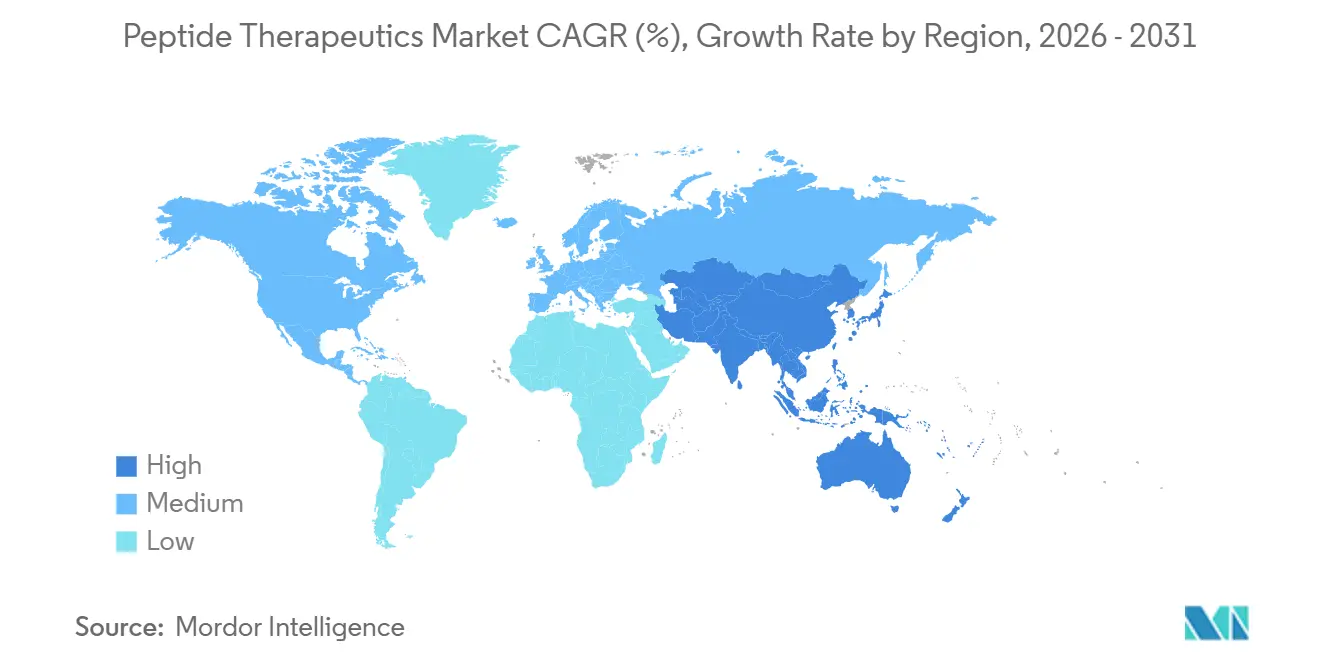
- By geography, North America contributed 38.34% of 2025 global revenue, yet Asia-Pacific is projected to lead growth at a 12.81% CAGR through 2031.
Note: Market size and forecast figures in this report are generated using Mordor Intelligence’s proprietary estimation framework, updated with the latest available data and insights as of January 2026.
Global Peptide Therapeutics Market Trends and Insights
Drivers Impact Analysis*
| Driver | (~) % Impact on CAGR Forecast | Geographic Relevance | Impact Timeline |
|---|---|---|---|
| Rising prevalence of cancer & metabolic diseases | +1.8% | Global, highest incidence in North America & Europe | Long term (≥ 4 years) |
| Surge in big-pharma funding for GLP-1 & multi-agonist pipelines | +2.1% | Global, concentrated in North America & Europe R&D hubs | Medium term (2-4 years) |
| Maturing solid-phase & hybrid synthesis platforms | +1.2% | North America & Europe manufacturing clusters expanding to Asia-Pacific | Medium term (2-4 years) |
| Regulatory fast-track pathways for rare-disease peptides | +0.9% | North America & Europe, emerging in Asia-Pacific | Short term (≤ 2 years) |
| Growth in AI-assisted cyclic macro-peptide discovery | +0.7% | Global, led by North America & Japan innovation centers | Long term (≥ 4 years) |
| Tariff-driven on-shoring of peptide CMOs in US/EU | +0.5% | North America & Europe, indirect effect on Asia-Pacific | Medium term (2-4 years) |
| Source: Mordor Intelligence | |||


Rising Prevalence of Cancer & Metabolic Diseases
Oncology and metabolic disorders increasingly share a therapeutic toolbox, as peptide receptor radionuclide therapy and GLP-1 agonists demonstrate disease-modifying potential across both areas. FDA approval of elamipretide for Barth syndrome and ongoing expansion of PRRT validate peptides in rare cancers where small molecules lack specificity[1]U.S. FDA, “47 Peptide Candidates Granted Orphan Status in 2024,” fda.gov. Dual agonists such as tirzepatide reduced HbA1c by up to 2.59% and delivered weight loss in 88% of Phase 3 patients, moving peptides toward first-line use in type 2 diabetes. Computational biology is widening the discovery funnel; the 2025 Peptide Predictor algorithm uncovered BRP, an anti-obesity peptide beyond the incretin axis. Peptides now represent 18% of global Phase 2/3 pipelines, and Novo Nordisk’s REDEFINE 1 results with CagriSema further underscore multi-factor risk reduction in cardiometabolic disease. These clinical wins are redirecting R&D budgets away from small molecules and bolstering long-term demand for the peptide therapeutics market.
Surge in Big-Pharma Funding for GLP-1 & Multi-Agonist Pipelines
Record-breaking transactions highlight how pharmaceutical leaders treat peptides as defensive assets against looming patent cliffs. Zealand Pharma’s USD 1.65 billion upfront deal with Roche values petrelintide at 12 times the company’s 2024 revenue. Novo Nordisk’s USD 285 million TransCon Semaglutide partnership shows innovators paying for monthly dosing regimens expected to win formulary preference. PeptiDream’s USD 180 million Novartis pact for radioligand conjugates proved that early discovery platforms can now fetch late-stage multiples. Earlier-stage collaborations, including a USD 1 billion Genentech agreement for peptide-RNAi conjugates, signal that capital is flowing across the development continuum. As acquisition timelines compress, smaller biotech firms with validated peptide libraries can achieve premium valuations quickly, a pattern that supports sustained expansion of the peptide therapeutics market.
Maturing Solid-Phase & Hybrid Synthesis Platforms
Industry adoption of continuous-flow SPPS and hybrid liquid-phase routes is cutting process mass intensity by up to 50%, meeting investor and regulator expectations for greener manufacturing. Enzymatic synthesis eliminates protecting groups but remains limited to short sequences, whereas hybrid SPPS-LPPS and flow reactors already support peptides exceeding 50 amino acids at Lonza and Bachem sites. FDA guidance released in 2024 formally accepts continuous manufacturing for peptide APIs, accelerating CDMO investment in advanced reactors. Generic players benefit most, as optimized SPPS reduced Hikma’s liraglutide API cost by 35% versus the innovator process[3]Hikma, “Generic Liraglutide Approval,” hikma.com. These efficiencies enable competitive pricing in the peptide therapeutics market without eroding margins.
Regulatory Fast-Track Pathways for Rare-Disease Peptides
Accelerated approval programs in the United States, Europe, and Japan are shrinking timelines for rare-disease peptide therapies. The FDA granted orphan-drug status to 47 peptide candidates in 2024, up from 32 in 2023, underscoring a growing focus on conditions that affect fewer than 200,000 U.S. patients. Commercial viability was highlighted when elamipretide won approval for Barth syndrome, an ultra-rare disorder with roughly 300 patients, and payers accepted annual treatment costs above USD 500,000. In Europe, the EMA’s PRIME scheme fast-tracked 12 peptide programs in 2024, cutting Phase 3 study durations by about nine months. Japan’s PMDA introduced a 2024 conditional pathway that allows marketing based on Phase 2 data, a route already used by PeptiDream and Takeda. Collectively, these mechanisms let developers earn revenue sooner, finance process optimization, and later pursue broader labels once initial approvals are secured.
Restraints Impact Analysis*
| Restraint | (~) % Impact on CAGR Forecast | Geographic Relevance | Impact Timeline |
|---|---|---|---|
| Proteolytic instability & low oral bioavailability | -1.3% | Global, most acute in oral formulation work | Long term (≥ 4 years) |
| High cGMP manufacturing cost vs. small-molecule APIs | -1.1% | Global, pronounced in high-cost regions | Medium term (2-4 years) |
| Emerging impurity guidelines inflating QC spend | -0.6% | Europe, North America, cascading to Asia-Pacific | Short term (≤ 2 years) |
| Mid-2025 shortage of specialty resins & reagents | -0.4% | Global, severe in North America & Europe SPPS sites | Short term (≤ 2 years) |
| Source: Mordor Intelligence | |||
Proteolytic Instability & Low Oral Bioavailability
Peptides are naturally susceptible to enzymatic degradation, restricting viable oral candidates to a narrow subset. Novo Nordisk’s Rybelsus achieves just 1% bioavailability and requires a 14 mg dose to match a 1 mg injection. Mycapssa’s TPE-enabled oral octreotide reaches 0.9% bioavailability and still needs twice-daily dosing. Device-based solutions like the RaniPill mechanically inject the drug into the intestinal wall but introduce manufacturing and patient-acceptance hurdles. Formulation enhancers add up to 50% in development cost and extend clinical timelines by as much as 18 months. Consequently, oral delivery remains a meaningful yet capped opportunity within the peptide therapeutics market.
High cGMP Manufacturing Cost vs. Small-Molecule APIs
A kilogram of cGMP peptide API can cost three to five times more than a small-molecule equivalent, largely due to a process mass intensity near 13,000 kg waste per kg of product[2]Royal Society of Chemistry, “Process Mass Intensity of SPPS,” rsc.org. EMA’s 2025 guideline now requires impurity profiling down to 0.05% for long peptides, adding up to USD 100,000 per batch in QC costs. Recombinant expression can deliver 50% savings for peptides longer than 40 amino acids, but its applicability is limited by host folding constraints. The 2025 shortage of Wang and 2-chlorotrityl resins raised raw-material prices by 40%, further squeezing CDMO margins. These economic pressures restrict broad generic penetration and confine the peptide therapeutics industry to indications that support premium pricing.
*Our forecasts treat driver/restraint impacts as directional, not additive. The impact forecasts reflect baseline growth, mix effects, and variable interactions.
Segment Analysis
By Marketing Type: Generics Capitalize on Patent Expiry
The peptide therapeutics market for branded peptides in 2025 represented a 61.55% share. Branded incumbents defend position through lifecycle strategies such as Novo Nordisk’s TransCon Semaglutide collaboration and Roche’s acquisition of petrelintide rights. Generic formulations, however, are projected to grow at an 8.25% CAGR from 2026 to 2031, buoyed by the FDA approval of generic liraglutide and a pipeline of ANDAs for exenatide and dulaglutide.
Generic manufacturers face higher comparability burdens because bioequivalence studies cost USD 5-10 million and SPPS batch variability challenges validation. Yet companies like Biocon and Dr. Reddy’s leverage recombinant expression to price biosimilar insulins 15-30% below reference brands while staying profitable, reinforcing momentum in the generic sub-segment of the peptide therapeutics market.

By Application: Gastrointestinal Peptides Accelerate
Oncology maintained 35.53% peptide therapeutics market share in 2025 on the back of PRRT products such as Lutathera, but GI disorders will expand at an 11.85% CAGR through 2031. Takeda’s USD 900 million acquisition of apraglutide and Zealand Pharma’s ongoing glepaglutide program illustrate strong sponsor appetite for GLP-2 analogs in short bowel syndrome.
Teduglutide’s USD 450 million 2024 sales verify commercial viability, while follow-on dual GLP-1/GLP-2 candidates are advancing for inflammatory bowel disease. Elsewhere, peptide vaccines such as SELLAS’s galinpepimut-S reach Phase 3 in leukemia, highlighting oncology’s innovation depth even as its growth rate moderates.
By Route of Administration: Oral Delivery Gains Traction
Parenteral injections commanded 80.63% of 2025 volumes, ensuring reliable exposure and near-complete bioavailability. In contrast, oral formulations, led by Rybelsus, are growing at a 12.87% CAGR, signaling patient preference for needle-free dosing despite higher milligram requirements.
Licensing demand for SNAC absorption enhancer technology and device approaches like the RaniPill show broadening interest, although only peptides with specific physicochemical profiles or mechanical delivery solutions can cross the oral viability threshold. This duality will persist as an innovation hotspot in the peptide therapeutics market.
By Technology: Recombinant Expression Scales Up
Solid-phase peptide synthesis contributed 45.13% of the peptide therapeutics market size in 2025, but recombinant expression is advancing at a 13.7% CAGR, reflecting 30–50% lower cost-of-goods for long sequences. E. coli and Pichia pastoris remain the dominant hosts, while CHO systems handle peptides needing post-translational modifications.
Continuous-flow SPPS and hybrid LPPS-SPPS processes cut waste by 40–50%, yet capital intensity keeps adoption concentrated among major CDMOs. Enzymatic synthesis is promising but remains pre-commercial due to enzyme specificity limits.

By End User: Innovators Internalize Early Development
Hospitals and clinics held 42.24% revenue in 2025, anchored by injectable products requiring professional administration. Pharmaceutical and biotech companies are the fastest-growing end users at a 12.51% CAGR, as firms like Novartis and Eli Lilly bolster internal peptide chemistry to shorten lead optimization cycles.
Academic institutes benefit from AI tools such as the PepMimic algorithm, which lower discovery barriers, spawning university spinouts that may license or self-develop candidates, thereby broadening the stakeholder base within the peptide therapeutics industry.
Geography Analysis
North America held 38.34% share in 2025, propelled by FDA fast-track designations and a 25% manufacturing tax credit that supported Lonza’s USD 475 million Portsmouth plant and Bachem’s USD 190 million Vista facility. The United States captures roughly 70% of regional revenue given payer tolerance for annual therapy costs above USD 10,000. Canada and Mexico add mid-single-digit contributions, with Mexico playing a nearshoring role for API production aimed at U.S. demand.
Asia-Pacific is the fastest-growing region, registering a 12.81% CAGR through 2031. China’s accelerated pathways enabled domestic GLP-1 biosimilar launches, and WuXi Biologics expanded fermentation capacity by 5,000 liters in 2024. India’s Biocon and Dr. Reddy’s exploit recombinant expression for insulin analogs sold across Europe and Southeast Asia, while Japan’s PeptiDream underpins regional innovation with trillion-member peptide libraries. South Korea and Australia contribute emerging CDMO and reimbursement opportunities.
Growth in Europe is moderated by the EMA’s 2025 impurity guideline, which elevated QC costs by up to USD 100,000 per batch. Germany leads regional production through PolyPeptide’s USD 150 million expansion, yet labor and energy costs remain 20–30% higher than Asia-Pacific. PRIME designations for 12 peptide programs in 2024 shorten European timelines, but manufacturers shoulder added compliance spending, tempering regional CAGR.

Regulatory Landscape
Regulatory requirements for peptide therapeutics are tightening around CMC controls, impurity characterization, and clinical pharmacology expectations across major markets. In the European Union, the European Medicines Agency (EMA) Guideline on the Development and Manufacture of Synthetic Peptides became effective on June 1, 2026. It sets more explicit expectations for manufacturing, characterization, specifications, and analytical controls, including reporting, identification, and qualification thresholds for peptide-related impurities.
In the United States, the FDA keeps peptide-specific development expectations in view through its Clinical Pharmacology Considerations for Peptide Drug Products guidance, while compounding oversight remains an active topic for peptide bulk drug substances. The FDA scheduled a Pharmacy Compounding Advisory Committee meeting for July 23-24, 2026 to evaluate seven peptide bulk drug substances for potential inclusion on the 503A list, which reinforces the importance of clear regulatory positioning between compounded supply and approved peptide drug pathways.
Competitive Landscape
The top originators, Eli Lilly, Bristol-Myers Squibb Company, and others, controlled a significant percentage of global revenue in 2025, indicating moderate concentration. Originators extend franchise life with next-generation formulations, as evidenced by Novo Nordisk’s TransCon Semaglutide and Roche’s petrelintide acquisition. CDMOs including Lonza, Bachem, PolyPeptide, and Cambrex each hold mid-single-digit shares and race to build North American and European capacity to meet on-shoring demand.
AI-driven platforms are disruptive forces. PeptiDream’s PDPS secured USD 180 million upfront from Novartis and USD 40 million from Genentech, demonstrating that discovery engines can monetize before clinical proof of concept. Generic challengers such as Hikma and Biocon win share through biosimilar peptide launches that undercut branded pricing by up to 30%. Technological leadership in recombinant expression and continuous-flow SPPS will likely widen the gap between scaled CDMOs and smaller players.
White-space opportunities include oral peptides beyond incretins, CNS-penetrant cell-penetrating sequences, and peptide-oligonucleotide conjugates for gene silencing. The October 2025 PepMimic paper showcased an 8% nanomolar hit rate, signaling that computational tools can replicate or exceed large proprietary libraries at lower cost, eroding a historical moat and intensifying rivalry in the peptide therapeutics market.
Peptide Therapeutics Industry Leaders
Eli Lilly and Company
Amgen Inc.
Bristol-Myers Squibb Company
AstraZeneca PLC
GSK plc
- *Disclaimer: Major Players sorted in no particular order

Market Opportunities and Future Outlook
CDMO and API capacity expansion remains a key whitespace across geographies, particularly as demand concentrates in high-volume peptide categories such as GLP-1 and longer, complex sequences that increase pressure on SPPS throughput, purification, and release testing. 2026 announcements show multi-region buildout, including AmbioPharm's 68,000-square-foot expansion in North Augusta, South Carolina (March 2026) for flexible SPPS, LPPS, and hybrid synthesis, Lupin Manufacturing Solutions' Dabhasa, India expansion (March 2026) to scale peptide building blocks and CRDMO capabilities, and Space Peptides (Taizhou) approving an equity investment (April 2026) to lift annual SPPS capacity to over 70,000 liters and annual output to more than 30 tons. Larger, longer-horizon investments also reinforce the pipeline-to-supply linkage, such as Eli Lilly's USD 6 billion API facility announcement in Huntsville, Alabama (December 2025) and CordenPharma starting a greater than EUR 500 million greenfield peptide facility program in Muttenz, Switzerland (March 2025) designed for SPPS reactor capacity exceeding 5,000 liters.
Follow-on and lifecycle strategies broaden the opportunity around analytical differentiation, impurity control, and comparability packages for 505(j) and 505(b)(2) pathways, where peptide-specific immunogenicity and impurity qualification remain gating items. FDA-CDER-2026-0083, an FDA research effort to determine qualification limits for peptide-related impurities of follow-on products, points to an increased focus on immunogenicity-linked impurity thresholds, driving demand for advanced characterization, orthogonal analytics, and robust control strategies. It also supports integrated service models (API, analytical development, and in some cases adjacent modalities) as sponsors seek fewer handoffs from late-stage to commercial supply.
Recent Industry Developments
- June 2026: Hanmi Pharmaceutical announced an exclusive license agreement with Eli Lilly and Company covering development, manufacturing, and commercialization of sonefpeglutide (a long-acting GLP-2 analog) worldwide excluding Korea. The deal strengthens big-pharma access to differentiated, long-acting peptide assets in gastrointestinal indications where dosing convenience and manufacturing scalability are central to uptake.
- December 2025: Eli Lilly announced a USD 6 billion investment to build a new active pharmaceutical ingredient manufacturing facility in Huntsville, Alabama. The project aligns with on-shoring and supply-resilience priorities and supports expanded peptide and related API capacity for high-demand therapeutic areas.
- July 2024: The US Federal Register published a 2024 notice relevant to FDA program activities that include initiatives shaping development and manufacturing considerations for regulated drug products. For peptide developers and manufacturers, this type of federal action reinforces ongoing modernization of regulatory expectations that influences compliance planning, documentation, and lifecycle control strategies.


Research Methodology Framework and Report Scope
Market Definition and Coverage
The peptide therapeutics market, as sized here, includes revenues generated from peptide based drugs used to prevent, manage, or treat diseases, across prescription channels and standard care settings. The value is tracked at the global level in current USD, based on sales and utilization signals tied to peptide medicines.
Scope exclusions: Excludes peptide research tools, discovery services, and non-therapeutic peptides used only for lab or industrial purposes.
Segmentation Overview
- By Marketing Type
- Branded
- Generic
- By Application
- Oncology
- Metabolic Disorders
- Cardiovascular Disorders
- Infectious Diseases
- Gastrointestinal Disorders
- CNS Disorders
- By Route of Administration
- Parenteral
- Oral
- Pulmonary & Nasal
- Transdermal & Implantable
- By Technology
- Solid-Phase Peptide Synthesis (SPPS)
- Liquid-Phase Peptide Synthesis (LPPS)
- Hybrid & Flow Chemistry
- Recombinant Expression
- By End User
- Hospitals & Clinics
- Research Institutes
- Pharmaceutical & Biotech Companies
- Geography
- North America
- United States
- Canada
- Mexico
- Europe
- Germany
- United Kingdom
- France
- Italy
- Spain
- Rest of Europe
- Asia-Pacific
- China
- Japan
- India
- South Korea
- Australia
- Rest of Asia-Pacific
- Middle East & Africa
- GCC
- South Africa
- Rest of Middle East & Africa
- South America
- Brazil
- Argentina
- Rest of South America
- North America
Data Sources, Market Sizing, and Validation
Desk Research
Desk work starts by setting the market boundaries and creating a consistent fact base for disease burden, approvals, and healthcare spend patterns that influence peptide drug demand. We review public sources such as the World Health Organization, the US FDA and EMA public databases, clinical trial registries like ClinicalTrials.gov, the World Bank health indicators, and OECD health statistics, which help us build and sanity-check a realistic demand pool.
To translate that fact base into market inputs, we also use company annual reports, investor presentations, regulatory filings, and earnings commentary to understand therapy adoption, pricing pressure, and portfolio changes. In parallel, we refer to paid subscriptions used for company financials and intelligence, news and financials, and patent databases, mainly to confirm timelines, ownership, and cross-check reported revenue exposure. The desk sources listed are illustrative, and other public references are also used for data collection, validation, and clarification.
Primary Interviews and Surveys
Primary work is used to pressure-test the desk assumptions with people who see prescribing patterns and market access dynamics in real time, alongside experts from manufacturing, distribution, and therapy area focused commercial teams. Since this is a global market, inputs are balanced across APAC, EMEA, and the Americas so regional adoption curves and pricing differences are reflected before finalizing the model.
Distribution of primary research fieldwork respondents
| Company type | Respondent position | Region |
|---|---|---|
| Top tier: 31% | CXOs: 19% | APAC: 47% |
| Mid tier: 47% | Functional/Unit leaders: 33% | EMEA: 29% |
| Smaller Players: 22% | Managers: 48% | Americas: 24% |
Market-Sizing & Forecasting
Sizing starts with a top-down build where disease prevalence, treated population, therapy mix, and region level access and reimbursement patterns are used to reconstruct a realistic demand pool for peptide medicines, which is then expressed in USD using price and utilization logic. To keep totals grounded, results are corroborated with selective bottom-up approximations such as sampled product level revenue disclosures, channel checks on volume movement, and ASP x volume spot checks for high-uptake indications.
A few inputs that matter in this market include peptide drug approvals and label expansions, clinical pipeline progression and discontinuation rates, route of administration mix (injectable versus oral), manufacturing capacity and outsourcing intensity for peptide APIs, and regional pricing and tender dynamics that can shift net realized prices. Where a bottom-up view has gaps, we bridge them using conservative adoption ranges validated through interviews, and then reconcile back to independent health spending and therapy uptake signals.
Forecasting is mainly run through scenario analysis, because approvals, payer behavior, and competition timing can change demand quickly. The scenarios are anchored in interview consensus around launch timing, uptake speed, and net price progression, and then rolled into a central case for the published forecast.
Data Validation & Update Cycle
Validation happens in layers, so the model is not accepted just because it produces a clean output. Analysts compare totals against independent signals like therapy class growth, regional healthcare spending direction, and known inflection points from approvals and loss of exclusivity, and then investigate any large variance before sign-off.
Each major assumption is reviewed again during internal checks, and respondents are re-contacted when a number looks out of pattern or when a new event changes the expected trajectory. The report is refreshed annually, with interim updates when material events occur, and a final pre-delivery review is done so clients receive the latest updated view.
Mordor Intelligence's Peptide Therapeutics Market Sizing Compared With Other Published Estimates
Published market sizes for peptide therapeutics can vary widely, even when the topic name looks the same, because the boundaries and counting rules are not consistent. Differences usually come from what is included as a therapeutic peptide, how branded and generic revenues are treated, and whether the scope stays strictly within drug revenues or expands into adjacent services.
By tracking route-of-administration mix, approval timing, and net price movement, Mordor Intelligence keeps the model tied to measurable demand signals for peptide medicines, rather than expanding the total through loosely defined adjacent categories. A second gap driver is timing, since some estimates use a different base year or currency conversion window, and others apply launch ramps without cross-checking against access and reimbursement realities across regions.
Benchmark comparison
| Source | Market Size | Gaps in Research Methodology |
|---|---|---|
| Mordor Intelligence | USD 49.68 B (2026) | |
| Global Consultancy A | USD 140.86 B (2025) | Uses a broader revenue boundary that can pull in a wider set of peptide-like therapies and related biologic products, and it anchors the size on a different base year, which shifts pricing and uptake assumptions. |
| Industry Publisher B | USD 46.60 B (2025) | Applies a narrower therapy and geography treatment in its base year sizing, and it can undercount late-stage launches when pipeline timing and access constraints are not validated with region level checks. |
The table shows that most of the spread is explained by scope and base-year choices, not by small math differences. When the market is kept within clearly defined peptide drug revenues and checked against adoption and pricing signals, the resulting size is easier to trace, update, and defend over time.


Key Questions Answered in the Report
How large is the peptide therapeutics market in 2026 and what is its expected value by 2031?
The peptide therapeutics market size is USD 49.68 billion in 2026 and is projected to reach USD 70.20 billion by 2031 at a 7.16% CAGR.
Which application area is growing fastest within peptide therapeutics?
Gastrointestinal disorders lead growth with an 11.85% CAGR through 2031, propelled by GLP-2 analogs such as apraglutide and glepaglutide.
Why are recombinant expression systems gaining share in peptide manufacturing?
Recombinant expression lowers cost-of-goods by 30-50% for peptides longer than 40 amino acids and supports 10,000-liter fermentation scales, outpacing traditional SPPS cost structures.
What are the main restraints limiting oral peptide formulations?
Proteolytic degradation and low intrinsic permeability restrict oral bioavailability to about 1%, necessitating high doses or device-based delivery solutions that raise development costs.
How is trade policy influencing peptide manufacturing locations?
U.S. tax credits and biosecurity legislation plus European on-shoring incentives are driving CDMOs like Lonza, Bachem, and Samsung Biologics to expand capacity in North America and Europe.
Page last updated on:


 Your data is secure and never sold or shared.


