Wool Market Size and Share
Wool Market Analysis by Mordor Intelligence
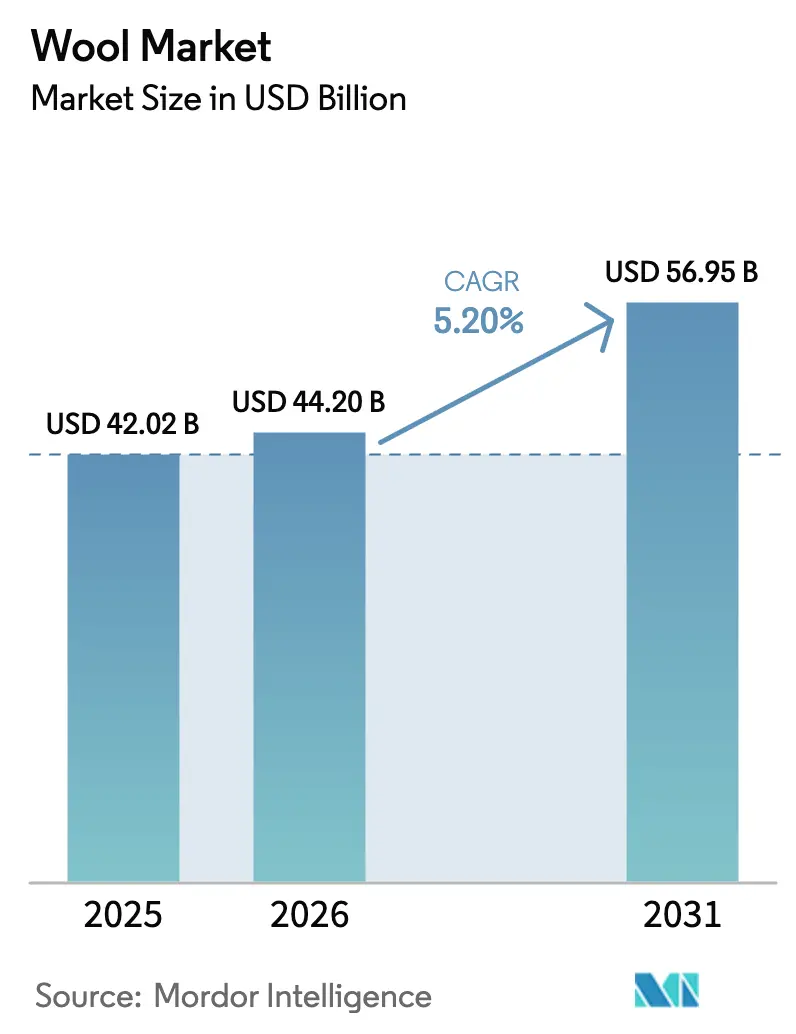
The wool market is projected to expand from USD 42.02 billion in 2025 and USD 44.20 billion in 2026 to USD 56.95 billion by 2031, registering a CAGR of 5.20% between 2026 to 2031. Mounting regulatory support for biodegradable fibers, digital traceability mandates, and a pivot by luxury and outdoor brands toward certified Merino are the primary engines of growth. Demand signals also come from building-insulation specifiers who favor sheep-wool batts, offering a negative carbon footprint, and from defense agencies that require wool-blend flame-resistant fabrics, both of which cushion the industry from apparel-cycle volatility. Supply, however, tightens as Australia, New Zealand, and parts of Europe report contracting sheep numbers and labor shortages, prompting auction premiums for non-mulesed and fully traceable lots. Competitive intensity remains moderate because the top 15 processors control only 35% of greasy-wool throughput, leaving scope for cooperatives and specialty mills to win price premiums through Responsible Wool Standard and ZQ Merino certifications.
Key Report Takeaways
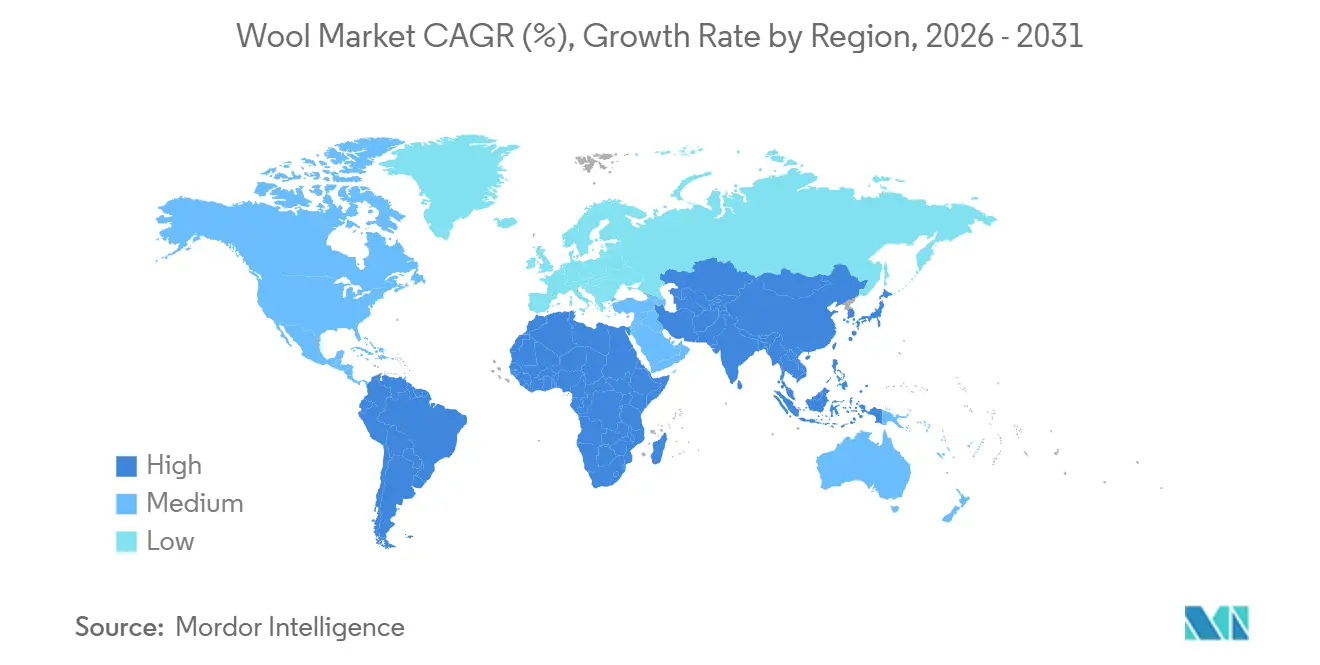
- By geography, Asia-Pacific commanded 46.8% of the wool market share in 2025, while the Middle East is forecast to expand at a 5.2% CAGR through 2031.
Note: Market size and forecast figures in this report are generated using Mordor Intelligence’s proprietary estimation framework, updated with the latest available data and insights as of January 2026.
Global Wool Market Trends and Insights
Drivers Impact Analysis*
| Driver | (~) % Impact on CAGR Forecast | Geographic Relevance | Impact Timeline |
|---|---|---|---|
| Greening of global fashion supply chains | +0.8% | Europe, North America, and East Asia | Medium term (2-4 years) |
| Rising demand for traceable and certified wool | +0.7% | Europe, North America, Australia, and New Zealand | Short term (≤2 years) |
| Regulatory pressure shifting synthetics toward biodegradable wool | +0.6% | European Union core, United Kingdom, and Asia-Pacific export hubs | Long term (≥4 years) |
| Expansion of thermal-insulation uses in building materials | +0.4% | Northern Europe and North America | Long term (≥4 years) |
| Blockchain-enabled provenance platforms unlocking farm-level price premiums | +0.5% | Australia, New Zealand, Argentina, and Uruguay | Medium term (2-4 years) |
| Military adoption of wool-blend flame-resistant fabrics | +0.3% | United States and North Atlantic Treaty Organization allies | Short term (≤2 years) |
| Source: Mordor Intelligence | |||
Greening of Global Fashion Supply Chains
Luxury groups now require Environmental Product Declarations from mills and science-based grazing practices from ranches, elevating certified wool’s attractiveness relative to polyester and nylon. Kering insists that suppliers document regenerative grazing outcomes by 2026, steering more than 1.2 million hectares in Patagonia under Chargeurs’ Nativa program [1]Source: Kering, “Raw Material Standards for Wool Suppliers 2024,” kering.com. Twelve European processors gained Environmental Product Declarations in 2024, which they leverage during sourcing tenders with athletic-wear brands. The European Union’s sustainable-textiles strategy gives wool a regulatory edge because it biodegrades within five years under industrial composting, unlike polyester [2]Source: European Commission, “Ecodesign Regulation 2024/1781,” ec.europa.eu. Yet, mass-market Asian retailers still privilege synthetics because of lower unit costs and quick-dye cycles, moderating the driver’s impact in value segments.
Rising Demand for Traceable and Certified Wool
Risk managers want end-to-end lineage, so Australian Wool Innovation trialed a blockchain ledger for 50,000 bales in 2024, letting buyers verify micron counts and non-mulesed status before bidding. TextileGenesis joined forces with New Zealand Merino in 2025 to embed QR tags on bale labels that retailers such as Marks and Spencer require on orders over 10 metric tons. The Woolmark Company’s SustainaWOOL program attracted 87 mills within a year, and certified lots now achieve 8-15% auction premiums. Certification costs range from USD 5,000 to USD 25,000 per facility, but mills typically recover their investments within 18 months through higher price points.
Regulatory Pressure Shifting Synthetics Toward Biodegradable Wool
The European Union’s Ecodesign Regulation 2024/1781 requires apparel brands to include fiber content in digital passports by 2027 and imposes a penalty of 4% of regional revenue for non-compliance. Wool passes the bloc’s biodegradability test under EN 13432, whereas polyester fails. France’s amended Anti-Waste Law now adds a EUR 0.50 (USD 0.54) fee per synthetic-dominant garment, effectively shrinking the wool-polyester price gap. California’s microfiber filtration law intensifies the trend in North America by steering consumers toward natural fibers to sidestep appliance upgrades.
Expansion of Thermal-Insulation Uses in Building Materials
Thermafleece sheep-wool batts hold Environmental Product Declaration (EPD) credentials, documenting a negative global warming potential of -0.006 metric tons carbon dioxide equivalent per metric ton, a data point that helps projects earn credits. United Kingdom retrofit demand jumped 40% in 2024, with Part L building codes setting strict U-values that wool blankets meet at thinner profiles than mineral wool. Germany allocated EUR 500 million (USD 540 million) in 2025 subsidies for bio-based retrofits, covering 25% of the installed costs when insulation is sourced from European farms. Fire-class Euroclass E limits high-rise use, confining growth to low-rise and residential projects.
Restraints Impact Analysis*
| Restraint | (~) % Impact on CAGR Forecast | Geographic Relevance | Impact Timeline |
|---|---|---|---|
| Decline in sheep numbers in traditional producing countries | -0.5% | Australia, New Zealand, Europe, and North America | Medium term (2-4 years) |
| Environmental scrutiny on animal-welfare practices reducing brand uptake | -0.4% | Europe and North America brand headquarters | Short term (≤2 years) |
| Volatility of lanolin by-product prices squeezing scouring margins | -0.3% | Australia, New Zealand, China, and Europe | Short term (≤2 years) |
| Competition from emerging plant-based biofibers in technical composites | -0.3% | Europe, North America, and Asia-Pacific automotive hubs | Long term (≥4 years) |
| Source: Mordor Intelligence | |||
Decline in Sheep Numbers in Traditional Producing Countries
Structural contraction in sheep inventories across Australia, New Zealand, and Europe is tightening raw-material supply and elevating price floors that deter volume-oriented textile mills from substituting wool for synthetics. Australia’s flock fell to 63.7 million head in 2024, a 12% decline from 2020, shrinking the 2024-2025 clip to 280 thousand metric tons of greasy wool. New Zealand’s herd dropped to 25.8 million, curbing exports to 108 thousand metric tons of greasy [3]Source: Australian Bureau of Agricultural and Resource Economics and Sciences, “Sheep Inventory 2024,” agriculture.gov.au. Labor shortages exacerbate the pinch as shearing contractors now command AUD 4.50-5.00 (USD 2.90-3.20) per animal, up 25% from 2020. European Union breeding ewe numbers also fell by 9% over five years, mainly in Spain, France, and the United Kingdom, further tightening the supply.
Environmental Scrutiny on Animal-Welfare Practices Reducing Brand Uptake
Activist campaigns targeting mulesing and live-export practices have compelled fashion brands to impose sourcing restrictions, which fragment supply chains and increase compliance costs for wool producers. Australian Wool Exchange data show that non-mulesed bales increased 5% year-on-year in 2024, yet the category still accounts for fewer than 15% of total auction volumes, reflecting the slow pace of on-farm practice change and the reluctance of older graziers to adopt alternative flystrike-prevention methods such as genetic selection for plain-bodied sheep or chemical treatments that require additional labor and veterinary oversight.
*Our forecasts treat driver/restraint impacts as directional, not additive. The impact forecasts reflect baseline growth, mix effects, and variable interactions.
Geography Analysis
Asia-Pacific commanded 46.8% of the wool market share in 2025, anchored by China’s scouring, spinning, and weaving complexes that handle three-fifths of greasy-wool imports. India’s handloom exports in 2024-2025 show continued momentum as European and North American retailers emphasize lower-carbon, artisan-made textiles. Yet, downside risks include Shandong Ruyi’s 2024 bankruptcy and a shrinking fine-wool supply from Australia’s 280,000 metric tons of greasy clip, both of which strain Chinese mills that rely on Merino for gauge-fine knitwear. Japan’s imports fell 8% in 2024 as consumers shifted to synthetic performance wear, while South Korea redirected investment toward recycled polyester to satisfy Extended Producer Responsibility laws enacted in 2025.
The Middle East is projected to deliver the fastest growth at a 5.2% CAGR through 2031. Turkey’s worsted mills ship high-quality suiting within 48 hours to European fashion houses, leveraging proximity to mitigate supply-chain risk. Oman attracted USD 120 million in foreign direct investment for cut-make-trim facilities in Sohar Free Zone, capitalizing on zero-duty entry across Gulf Cooperation Council markets and preferential tariffs under the Gulf Cooperation Council-Singapore Free Trade Agreement. Limited regional scouring infrastructure remains a bottleneck, maintaining dependence on imported semi-processed wool.
Europe absorbed global consumption in 2025, spearheaded by Italy’s Biella district, where Loro Piana, Vitale Barberis Canonico, and Ermenegildo Zegna together spin 35,000 metric tons of fine Merino annually. Germany’s Südwolle has added a 2,000 metric ton dyehouse in Vietnam, but maintains its domestic plants for premium counts that require tighter tolerances. United Kingdom mills pivoted to sheep-wool insulation after Brexit tariffs dented suiting exports, and Thermafleece secured a 15% share of the United Kingdom's bio-based insulation market. The ports of Rotterdam and Antwerp remain redistribution hubs, forwarding tops and yarns to Eastern European sewing centers that benefit from labor costs 40% lower than those in Western Europe. Compliance with the European Union Ecodesign Regulation and Digital Product Passports is pushing mills lacking digital traceability systems to modernize rapidly or risk losing access to the bloc’s 450 million-consumer market.


Competitive Landscape
The wool market competition is split into two strategic approaches, with cost-focused Chinese and Indian scourers targeting high volumes and premium European and Australasian mills establishing exclusive farm partnerships for ultra-fine Merino wool. Italian houses, such as Loro Piana, Vitale Barberis Canonico, and Ermenegildo Zegna, collectively transform roughly 35,000 metric tons of fine wool in Biella, retailing fabrics at prices exceeding USD 1,500 per linear meter. This bifurcation enables regional cooperatives and specialty mills to win premiums through certifications like the Responsible Wool Standard and ZQ Merino, which resonate with luxury and outdoor brands.
Digital innovation now acts as a margin lever because blockchain provenance platforms tag bales at the farm level, unlocking 10-20% price uplifts for traceable lots. Australian Wool Innovation and Everledger piloted the use of cryptographic hashes in laboratory test certificates for 50,000 bales, enabling buyers to automate due diligence checks through application programming interfaces. Australian Wool Exchange’s web-based auction already processes 85% of the national clip and is trialing algorithmic bidding tied to real-time micron data and non-mulesed status, compressing price discovery from weeks to days. Mills lacking digital infrastructure risk exclusion from European Union supplier lists once Digital Product Passports become compulsory in 2027.
Corporate moves show both expansion and retreat. Chargeurs bought Swiss finisher Cilander for EUR 653.2 million (USD 706 million) in July 2024 to integrate low-water dyeing and digital printing that shorten fashion lead times. Loro Piana paid more than AUD 200,000 (USD 129,000) for a 10.2-micron Record Bale in 2024, cementing its grip on the ultra-fine segment. These shifts, combined with volatile lanolin co-product margins, keep competitive intensity balanced and allow agile players to capture sustainability premiums while volume-centric processors chase thinning cost advantages.
Recent Industry Developments
- February 2025: The Kangaroo Island Wool Mill began full-scale operations, integrating superfine merino production and on-island processing to capture value across the supply chain and enhance tourist engagement with wool production.
- January 2025: Loro Piana has introduced a blockchain-based traceability system for its Pecora Nera wool collection, starting with the Spring-Summer 2025 collection. This system operates on the Aura Blockchain Consortium platform.
- July 2024: Chargeurs SA acquired Cilander, a Swiss textile finishing specialist, consolidating EUR 653.2 million (USD 706 million) in annual revenue and 2,300 employees. The transaction integrates digital printing and sustainable dyeing technologies that reduce water consumption by 40% and enable shorter production runs for fashion brands.


Research Methodology Framework and Report Scope
Market Definitions and Key Coverage
Our study defines the global wool market as the annual value of raw and semi-processed animal wool, including sheep, merino, mohair, cashmere, alpaca, and similar specialty fibers, traded or further converted for apparel, interior textiles, and technical uses. Coverage starts at farm-gate fiber production, flows through major trading hubs, and ends at first-stage processors that sell tops, yarn, or fabric to downstream mills.
Scope Exclusion: Mineral wool insulation, synthetic fleece, and any recycled fiber derived from non-animal sources are outside this study's boundary.
Segmentation Overview
- By Geography
- North America
- United States
- Production Analysis (Area Harvested, Yield, and Production Volume)
- Consumption Analysis (Consumption Value and Volume)
- Import Market Analysis (Import Value, Volume, and Key Supplying Markets)
- Export Market Analysis (Export Value, Volume, and Key Destination Markets)
- Wholesale Price Trend Analysis and Forecast
- Regulatory Framework
- List of Key Players
- Logistics and Infrastructure
- Seasonality Analysis
- Mexico
- Production Analysis (Area Harvested, Yield, and Production Volume)
- Consumption Analysis (Consumption Value and Volume)
- Import Market Analysis (Import Value, Volume, and Key Supplying Markets)
- Export Market Analysis (Export Value, Volume, and Key Destination Markets)
- Wholesale Price Trend Analysis and Forecast
- Regulatory Framework
- List of Key Players
- Logistics and Infrastructure
- Seasonality Analysis
- United States
- Europe
- Germany
- Production Analysis (Area Harvested, Yield, and Production Volume)
- Consumption Analysis (Consumption Value and Volume)
- Import Market Analysis (Import Value, Volume, and Key Supplying Markets)
- Export Market Analysis (Export Value, Volume, and Key Destination Markets)
- Wholesale Price Trend Analysis and Forecast
- Regulatory Framework
- List of Key Players
- Logistics and Infrastructure
- Seasonality Analysis
- Italy
- Production Analysis (Area Harvested, Yield, and Production Volume)
- Consumption Analysis (Consumption Value and Volume)
- Import Market Analysis (Import Value, Volume, and Key Supplying Markets)
- Export Market Analysis (Export Value, Volume, and Key Destination Markets)
- Wholesale Price Trend Analysis and Forecast
- Regulatory Framework
- List of Key Players
- Logistics and Infrastructure
- Seasonality Analysis
- United Kingdom
- Production Analysis (Area Harvested, Yield, and Production Volume)
- Consumption Analysis (Consumption Value and Volume)
- Import Market Analysis (Import Value, Volume, and Key Supplying Markets)
- Export Market Analysis (Export Value, Volume, and Key Destination Markets)
- Wholesale Price Trend Analysis and Forecast
- Regulatory Framework
- List of Key Players
- Logistics and Infrastructure
- Seasonality Analysis
- Netherlands
- Production Analysis (Area Harvested, Yield, and Production Volume)
- Consumption Analysis (Consumption Value and Volume)
- Import Market Analysis (Import Value, Volume, and Key Supplying Markets)
- Export Market Analysis (Export Value, Volume, and Key Destination Markets)
- Wholesale Price Trend Analysis and Forecast
- Regulatory Framework
- List of Key Players
- Logistics and Infrastructure
- Seasonality Analysis
- Belgium
- Production Analysis (Area Harvested, Yield, and Production Volume)
- Consumption Analysis (Consumption Value and Volume)
- Import Market Analysis (Import Value, Volume, and Key Supplying Markets)
- Export Market Analysis (Export Value, Volume, and Key Destination Markets)
- Wholesale Price Trend Analysis and Forecast
- Regulatory Framework
- List of Key Players
- Logistics and Infrastructure
- Seasonality Analysis
- Germany
- Asia-Pacific
- China
- Production Analysis (Area Harvested, Yield, and Production Volume)
- Consumption Analysis (Consumption Value and Volume)
- Import Market Analysis (Import Value, Volume, and Key Supplying Markets)
- Export Market Analysis (Export Value, Volume, and Key Destination Markets)
- Wholesale Price Trend Analysis and Forecast
- Regulatory Framework
- List of Key Players
- Logistics and Infrastructure
- Seasonality Analysis
- India
- Production Analysis (Area Harvested, Yield, and Production Volume)
- Consumption Analysis (Consumption Value and Volume)
- Import Market Analysis (Import Value, Volume, and Key Supplying Markets)
- Export Market Analysis (Export Value, Volume, and Key Destination Markets)
- Wholesale Price Trend Analysis and Forecast
- Regulatory Framework
- List of Key Players
- Logistics and Infrastructure
- Seasonality Analysis
- Japan
- Production Analysis (Area Harvested, Yield, and Production Volume)
- Consumption Analysis (Consumption Value and Volume)
- Import Market Analysis (Import Value, Volume, and Key Supplying Markets)
- Export Market Analysis (Export Value, Volume, and Key Destination Markets)
- Wholesale Price Trend Analysis and Forecast
- Regulatory Framework
- List of Key Players
- Logistics and Infrastructure
- Seasonality Analysis
- New Zealand
- Production Analysis (Area Harvested, Yield, and Production Volume)
- Consumption Analysis (Consumption Value and Volume)
- Import Market Analysis (Import Value, Volume, and Key Supplying Markets)
- Export Market Analysis (Export Value, Volume, and Key Destination Markets)
- Wholesale Price Trend Analysis and Forecast
- Regulatory Framework
- List of Key Players
- Logistics and Infrastructure
- Seasonality Analysis
- Australia
- Production Analysis (Area Harvested, Yield, and Production Volume)
- Consumption Analysis (Consumption Value and Volume)
- Import Market Analysis (Import Value, Volume, and Key Supplying Markets)
- Export Market Analysis (Export Value, Volume, and Key Destination Markets)
- Wholesale Price Trend Analysis and Forecast
- Regulatory Framework
- List of Key Players
- Logistics and Infrastructure
- Seasonality Analysis
- China
- South America
- Brazil
- Production Analysis (Area Harvested, Yield, and Production Volume)
- Consumption Analysis (Consumption Value and Volume)
- Import Market Analysis (Import Value, Volume, and Key Supplying Markets)
- Export Market Analysis (Export Value, Volume, and Key Destination Markets)
- Wholesale Price Trend Analysis and Forecast
- Regulatory Framework
- List of Key Players
- Logistics and Infrastructure
- Seasonality Analysis
- Argentina
- Production Analysis (Area Harvested, Yield, and Production Volume)
- Consumption Analysis (Consumption Value and Volume)
- Import Market Analysis (Import Value, Volume, and Key Supplying Markets)
- Export Market Analysis (Export Value, Volume, and Key Destination Markets)
- Wholesale Price Trend Analysis and Forecast
- Regulatory Framework
- List of Key Players
- Logistics and Infrastructure
- Seasonality Analysis
- Brazil
- Middle East
- United Arab Emirates
- Production Analysis (Area Harvested, Yield, and Production Volume)
- Consumption Analysis (Consumption Value and Volume)
- Import Market Analysis (Import Value, Volume, and Key Supplying Markets)
- Export Market Analysis (Export Value, Volume, and Key Destination Markets)
- Wholesale Price Trend Analysis and Forecast
- Regulatory Framework
- List of Key Players
- Logistics and Infrastructure
- Seasonality Analysis
- Saudi Arabia
- Production Analysis (Area Harvested, Yield, and Production Volume)
- Consumption Analysis (Consumption Value and Volume)
- Import Market Analysis (Import Value, Volume, and Key Supplying Markets)
- Export Market Analysis (Export Value, Volume, and Key Destination Markets)
- Wholesale Price Trend Analysis and Forecast
- Regulatory Framework
- List of Key Players
- Logistics and Infrastructure
- Seasonality Analysis
- Turkey
- Production Analysis (Area Harvested, Yield, and Production Volume)
- Consumption Analysis (Consumption Value and Volume)
- Import Market Analysis (Import Value, Volume, and Key Supplying Markets)
- Export Market Analysis (Export Value, Volume, and Key Destination Markets)
- Wholesale Price Trend Analysis and Forecast
- Regulatory Framework
- List of Key Players
- Logistics and Infrastructure
- Seasonality Analysis
- Oman
- Production Analysis (Area Harvested, Yield, and Production Volume)
- Consumption Analysis (Consumption Value and Volume)
- Import Market Analysis (Import Value, Volume, and Key Supplying Markets)
- Export Market Analysis (Export Value, Volume, and Key Destination Markets)
- Wholesale Price Trend Analysis and Forecast
- Regulatory Framework
- List of Key Players
- Logistics and Infrastructure
- Seasonality Analysis
- United Arab Emirates
- Africa
- South Africa
- Production Analysis (Area Harvested, Yield, and Production Volume)
- Consumption Analysis (Consumption Value and Volume)
- Import Market Analysis (Import Value, Volume, and Key Supplying Markets)
- Export Market Analysis (Export Value, Volume, and Key Destination Markets)
- Wholesale Price Trend Analysis and Forecast
- Regulatory Framework
- List of Key Players
- Logistics and Infrastructure
- Seasonality Analysis
- Morocco
- Production Analysis (Area Harvested, Yield, and Production Volume)
- Consumption Analysis (Consumption Value and Volume)
- Import Market Analysis (Import Value, Volume, and Key Supplying Markets)
- Export Market Analysis (Export Value, Volume, and Key Destination Markets)
- Wholesale Price Trend Analysis and Forecast
- Regulatory Framework
- List of Key Players
- Logistics and Infrastructure
- Seasonality Analysis
- South Africa
- North America
Detailed Research Methodology and Data Validation
Primary Research
Dozens of structured interviews and surveys with wool growers, trading houses, scouring plants, spinners, and brand-sourcing managers across Australia, China, Italy, the United States, and South Africa helped validate price assumptions, yield losses, and demand swings. Expert feedback also confirmed micron-premium trends and certified-wool adoption rates, closing gaps that secondary data alone could not fill.
Desk Research
Our analysts began with publicly available, high-credibility datasets such as FAO FAOSTAT output, USDA ERS Cotton and Wool Outlooks, Australian Wool Exchange price sheets, International Wool Textile Organisation supply statistics, and European Union COMEXT trade records. These sources clarified production tonnage, trade flows, and prevailing micron-based price spreads. Company filings, investor decks, and national customs data then provided processor revenues and shipment values that anchor regional conversion factors. Paid platforms, including D&B Hoovers for processor financials and Dow Jones Factiva for real-time news, enriched our desk work with timely competitive and transaction insights. The sources cited illustrate our evidence base; many additional governmental and industry references were reviewed throughout the build.
Market-Sizing and Forecasting
The core model applies a top-down "production-plus-trade reconstruct," multiplying clean-equivalent output by region-specific average selling prices, which are then reconciled with import and export values. Select bottom-up checks, processor roll-ups and sampled ASP x volume calculations, flag outliers before totals are finalized. Key drivers embedded include sheep flock numbers, greasy-to-clean yield ratios, apparel retail sales indices, certified-wool penetration, and cross-fiber price parity. A multivariate regression that blends GDP per capita trends with apparel retail growth and flock dynamics projects demand to 2030; scenario analysis adjusts for bio-security shocks or synthetic-fiber policy shifts.
Data Validation and Update Cycle
Outputs pass three layers of variance and anomaly checks, peer review, and a manager sign-off. Results are compared with IWTO price benchmarks and AWEX indicators; material deviations trigger a model rerun. Reports refresh yearly, while notable market events, such as tariff moves or disease outbreaks, prompt interim updates so clients always receive our latest view.
Why Mordor's Wool Baseline Earns Trust
Published wool values often differ because firms choose dissimilar fiber scopes, price bases, and refresh rhythms.
Some quote only raw greasy wool, others focus on finished textiles, and many rely on single-region snapshots converted at outdated exchange rates.
Benchmark comparison
| Market Size | Anonymized source | Primary gap driver |
|---|---|---|
| USD 43.90 B (2025) | Mordor Intelligence | - |
| USD 11.25 B (2024) | Global Consultancy A | Counts only fine sheep wool; applies static 70 % clean-yield factor; limited regional coverage |
| USD 8.56 B (2025) | Trade Journal B | Uses export receipts as proxy, excludes domestic consumption, and relies on prior-year FX rates |
The comparison shows how narrower scopes or simplified assumptions can suppress market value by more than four-fold. Mordor's disciplined variable selection, transparent yield adjustments, and annual refresh give decision-makers a balanced, reproducible baseline they can rely on with confidence.


Key Questions Answered in the Report
What is the projected value of the wool market by 2031?
It is forecast to reach USD 56.95 billion, advancing at a 5.20% compound annual growth rate from 2026 to 2031.
Which region dominated global wool processing in 2025?
Asia-Pacific led with 46.8% of revenue in 2025, driven by China's integrated scouring, spinning, and weaving capacity.
Why are brands demanding certified wool?
Digital traceability and animal-welfare assurances lower reputational risk and satisfy European Union Ecodesign rules that require fiber-origin disclosure.
How are building codes influencing wool insulation demand?
Subsidies in Germany and strict United Kingdom U-value thresholds favor sheep-wool batts that deliver negative embodied carbon and moisture regulation.
What restrains wool supply growth in Australia?
Sheep numbers declined to 63.7 million and shearing labor shortages push up costs, limiting the greasy-wool clip to 280 thousand metric tons of greasy wool.
Which end-use segment shows the fastest growth?
Technical and military textiles, including flame-resistant uniforms, are expanding faster than fashion apparel because of stable procurement contracts and performance mandates.
Page last updated on:


