
Silk Yarn Market Size and Share
Silk Yarn Market Analysis by Mordor Intelligence
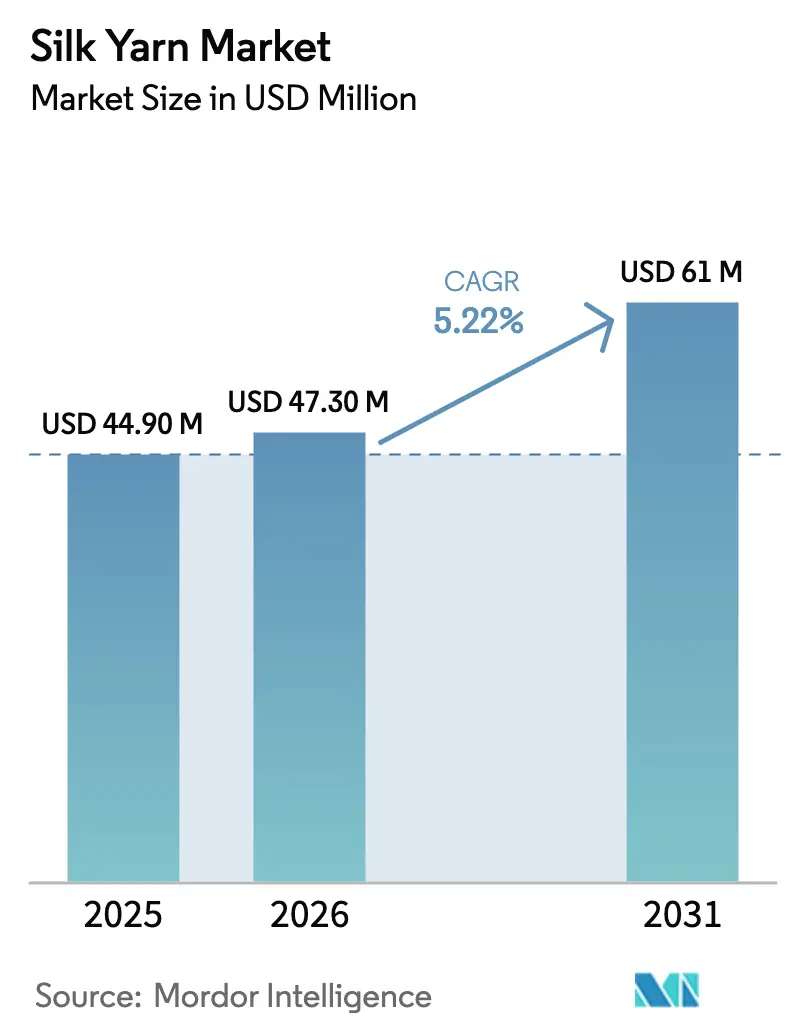
The silk yarn market size is projected to expand from USD 44.9 million in 2025 and USD 47.3 million in 2026 to USD 61.0 million by 2031, registering a CAGR of 5.22% between 2026 to 2031. This growth is driven by increasing focus on high-value segments such as bio-engineered spider yarn, medical-grade filaments, and digitally validated supply chains. The Asia-Pacific region is projected to maintain the majority of output by 2025, while South America is emerging as a key player, with companies such as Spiber and Suzano expanding their production of brewed-protein polymers. The market exhibits a dual structure, where traditional mulberry reeling coexists with fermentation-based production for applications in the aerospace and implantable medical device industries. Demand for luxury textiles has recovered, biomedical applications are growing, and traceability requirements are enabling premium pricing. However, challenges such as rising raw cocoon costs and climate-induced yield fluctuations continue to pressure profit margins in the silk yarn market.
Key Report Takeaways
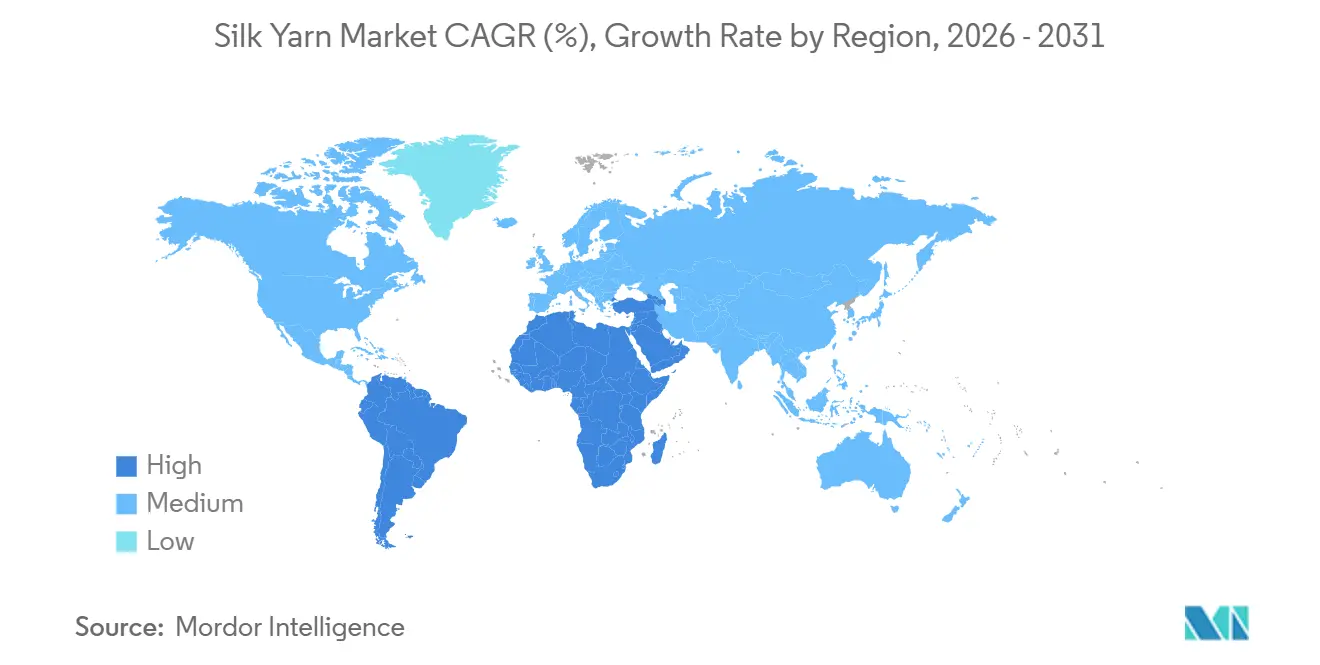
- By geography, Asia-Pacific captured 78% of the silk yarn market share in 2025, while South America is forecast to grow at a 7.8% CAGR during 2026-2031.
Note: Market size and forecast figures in this report are generated using Mordor Intelligence’s proprietary estimation framework, updated with the latest available data and insights as of January 2026.
Global Silk Yarn Market Trends and Insights
Drivers Impact Analysis*
| Driver | (~) % Impact on CAGR Forecast | Geographic Relevance | Impact Timeline |
|---|---|---|---|
| Luxury-textile rebound fuels farm-gate cocoon demand | +1.70% | Europe and North America luxury hubs | Short term (≤ 2 years) |
| Rising consumer shift toward natural and biodegradable fibers | +1.40% | Global, strongest in Europe and North America | Medium term (2-4 years) |
| Government sericulture modernization incentives | +1.10% | Asia-Pacific dominant, emerging Middle East and Africa programs | Long term (≥ 4 years) |
| Bio-engineered spider-silk breakthroughs expanding yarn blends | +1.00% | North America and Europe R&D, Asia-Pacific scale-up | Long term (≥ 4 years) |
| Digital farm-to-reel traceability platforms | +0.90% | Europe regulatory pull, Asia-Pacific supplier rollout | Medium term (2-4 years) |
| Carbon-credit programs for mulberry plantations | +0.70% | Asia-Pacific and South America lead, Africa emerging | Medium term (2-4 years) |
| Source: Mordor Intelligence | |||
Luxury-Textile Rebound Fuels Farm-Gate Cocoon Demand
High-net-worth spending on heritage fabrics experienced a rebound in 2024-2025, with FENDI reporting that 67% of its silk met sustainability criteria, an increase from 54% in 2023[1]Source: FENDI, “Sustainability Report 2024,” FENDI.COM . Luxury brands leverage provenance stories to justify markups, protecting premium filament fabrics from competition with synthetic alternatives. In 2025, Stella McCartney tested Bolt Threads’ Microsilk scarves, demonstrating that cruelty-free messaging enhances consumers' willingness to pay. Supply chain audits under Kering’s 2025 raw-material standards disqualified approximately 40% of traditional Chinese suppliers, driving increased demand for certified reelers. Farm-gate cocoon prices in Zhejiang rose by 18% year-over-year in 2024, reflecting the procurement pressures driven by ESG compliance. Brands securing multi-year contracts benefit from inventory and pricing stability, which supports upstream investments in quality feed and disease control.
Rising Consumer Shift Toward Natural and Biodegradable Fibers
Concerns about microplastics are accelerating a shift away from polyester, particularly in skin-contact categories such as activewear. Silk offers full biodegradability within a relatively short timeframe compared to synthetics, aligning with circularity regulations in major markets. Demand softness for cellulosic fibers and the exit of a recycled-cellulosic competitor have redirected sustainability investments toward silk-waste valorization projects. Studies highlight significant potential to monetize cocoon by-products, improving income opportunities for producers. While price gaps persist between silk and synthetics, limiting penetration to premium apparel segments, innovation and circularity incentives are strengthening silk’s position in the sustainable fashion landscape.
Government Sericulture Modernization Incentives
India’s Silk Samagra-2 program allocated USD 129 million (Rs 1,074.94 crore) till March 2025 for the deployment of automatic reeling machines, which reduce labor requirements by 60% and achieve yarn evenness within a 3% coefficient of variation[2]Source: Press Information Bureau, Government of India, “Silk Samagra-2 Program,” PIB.GOV.IN . In China, provinces like Zhejiang and Sichuan subsidize 50% of the costs of mechanized equipment, accelerating the transition away from hand-operated charkhas. However, adoption of mechanization remains below 10% among Indian units, primarily due to the small average farm size of 0.5 hectares and limited access to credit. In areas where mechanization has been implemented, EBITDA margins have increased by 300–500 basis points, attracting private equity interest in cluster-level consolidation initiatives.
Bio-Engineered Spider-Silk Breakthroughs Expanding Yarn lends
Biotech-driven advancements in silk innovation are progressing rapidly, with companies utilizing recombinant production and transgenic methods to reduce costs and enhance performance properties. Collaborative partnerships and investments are facilitating the development of hybrid yarns that merge the aesthetic qualities of mulberry silk with the strength of spider silk, catering to applications in aerospace and defense. However, significant capital requirements for fermentation infrastructure and uncertainties surrounding regulatory labeling frameworks limit market entry to well-funded specialists. Despite these challenges, sustainability and performance trends continue to propel market growth.
Restraints Impact Analysis*
| Restraint | (~) % Impact on CAGR Forecast | Geographic Relevance | Impact Timeline |
|---|---|---|---|
| High cocoon and labor costs versus synthetic filament | -1.3% | Asia-Pacific production hubs, global cost comparison | Short term (≤ 2 years) |
| Climate-driven disease outbreaks reducing yield | -1.0% | Asia-Pacific core, rising Africa and Middle East | Medium term (2-4 years) |
| Fragmented farmer base limits quality consistency | -0.9% | Asia-Pacific dominant, early Africa entrants | Long term (≥ 4 years) |
| Competition from recycled cellulosics and bio-nylon substitutes | -0.7% | Europe and North America substitution pressure | Medium term (2-4 years) |
| Source: Mordor Intelligence | |||
High Cocoon and Labor Costs Versus Synthetic Filament
Raw silk was priced at USD 48 per kilogram in Jiangsu during Q3 2024, reflecting a 22% increase compared to 2023, as heat stress reduced cocoon production volumes[3]Source: China Silk Association, “Market Data,” CHINASILK.ORG . In early 2025, polyester filament yarn prices in India averaged between USD 1.80 and USD 2.00 per kilogram, maintaining silk yarn as a premium product. Manual reeling wages have increased in recent years, reducing profit margins for small operators, though the extent varies by region. While automatic reeling machines can substantially reduce labor needs, their high initial costs and a payback period of approximately five years remain significant barriers to adoption for small farms that lack access to subsidized financing.
Climate-Driven Disease Outbreaks Reducing Yield
Pebrine outbreaks resulted in the loss of up to 40% of cocoons in Karnataka and Andhra Pradesh in 2024, necessitating the import of cocoons from China and Uzbekistan at higher costs. Mortality rates double when temperatures exceed 30°C for three consecutive days, while extended monsoon seasons contribute to fungal infestations. In 2024, Thailand allocated USD 8 million for early-warning systems. However, effective prevention remains challenging until disease-resistant silkworms are deployed on a large scale, which might occur after 2028.
*Our forecasts treat driver/restraint impacts as directional, not additive. The impact forecasts reflect baseline growth, mix effects, and variable interactions.
Geography Analysis
The Asia-Pacific region accounts for 78% of global silk production, primarily due to China's extensive mulberry cultivation and high cocoon yield. India is working towards modernizing its sericulture industry through mechanization, despite ongoing challenges related to diseases. Other countries in the region, including Thailand and Uzbekistan, are improving disease surveillance and upgrading infrastructure. Additionally, Japan's biotechnology companies are leveraging facilities in Southeast Asia to produce protein-based silk for export markets.
Europe holds a niche position in the silk market, with Italy's Como region at its core. Upcoming digital traceability regulations will benefit premium segments. Germany and the United Kingdom primarily act as distribution hubs for bespoke tailoring and luxury applications, solidifying the region's role in high-end fashion supply chains.
North America and South America are identified as emerging growth regions. North America is focusing on the development of medical-grade silk and the artisanal craft markets. South America, with a CAGR of 7.8%, is the fastest-growing region, driven by collaborations between biotech firms and plant-protein producers to foster innovation. In the Middle East and Africa, smallholder programs in countries such as Kenya, Ethiopia, and Tunisia are making progress. However, production levels remain limited compared to those in the Asia-Pacific region. While brands are exploring near-shoring opportunities for geopolitical diversification, the Asia-Pacific continues to lead global silk production.


Regulatory Landscape
Silk yarn and related products are governed in international trade under HS Chapter 50 (including silk yarn headings 5004 to 5006), which supports consistent customs classification across major importing markets such as Canada (CBSA Customs Tariff 2026) and the United Kingdom (UK Integrated Online Tariff). Beyond trade classification, quality and conformity requirements are being reinforced through national and industry standards in key producing countries.
In China, updated national standards provide nearer-term compliance anchors for upstream quality control, including GB/T 45294-2025 for silk quality evaluation of silkworm cocoons (effective September 1, 2025). At the international level, the International Sericultural Commission (ISC) and the International Silk Union (ISU) are working on sustainability-linked standardization, including LCA-oriented workstreams. The ISC conference scheduled for November 23-27, 2026 in Chennai also highlights how intergovernmental coordination is shaping how provenance and environmental claims are substantiated for silk supply chains.
Competitive Landscape
Regional leaders in the silk market maintain competitive advantages through vertical integration, managing the entire process from cocoon sourcing to finished yarn production. This approach enables them to achieve higher profit margins compared to smaller reelers reliant on spot cocoon purchases. In Asia-Pacific, production clusters in China and India dominate traditional silk manufacturing, while Italy’s Como district serves as the hub for Europe’s luxury silk segment. These key players are increasingly investing in automation and traceability to align with evolving compliance and sustainability requirements.
Bio-engineered silk innovators, including AMSilk, Spiber, and Kraig Biocraft, are transforming the competitive landscape by bypassing traditional sericulture. They focus on high-value applications in sectors such as medical devices, aerospace, and defense textiles, leveraging advanced material properties and performance-driven solutions. This positions them as disruptors in areas where conventional silk cannot compete effectively.
Emerging opportunities in the silk market include utilizing silk waste streams and incorporating digital or cryptographic tracers to meet ESG (Environment, Social, and Governance) and luxury audit standards. Mechanization is a key differentiator, particularly in regions like India, where early adopters achieve significant labor efficiencies. Regulatory requirements for traceability, particularly in markets such as the EU, are projected to drive industry consolidation, as under-capitalized mills face challenges in funding compliance and technology upgrades.
Market Opportunities and Future Outlook
Government-backed modernization and capacity creation provide whitespace for higher, more consistent yarn quality and for scaling compliant supply chains. In India, Silk Samagra-2 (Ministry of Textiles) continues to anchor mechanization and capability upgrades, and new 2026 announcements extend this push: the Ministry of Textiles outlined a plan with a INR 1,000-crore corpus to raise raw silk output to 44,500 tonnes in FY27 and target productivity of 116 kg per hectare. The Central Silk Board also reiterated an objective to expand the value of Indias silk value chain from INR 55,000 crore to INR 1,10,000 crore by 2030 through land expansion, productivity gains, and mechanization. Together, these programs offer reelers and yarn makers a clearer path to invest in automatic reeling and quality control that premium buyers increasingly require.
A second opportunity area lies in region- and variety-specific vertical integration and specialty yarn streams, where public missions and cluster projects reduce barriers to modern processing. Mission Senehjori in Assam (launched June 2026) is structured around investment of INR 411 crore to establish five modern reeling units and a dedicated spun silk unit by 2028, and Jammu and Kashmir announced plans (June 2026) to adopt a private mulberry nursery model modeled on Uttarakhand. Alongside these sericulture-side initiatives, the report scope also includes bio-engineered and specialty protein fibers, such as brewed-protein and recombinant pathways. Fashion and technical end uses are already validating new yarn formats and traceability expectations, supporting premium positioning for certified and digitally validated supply chains.
Recent Industry Developments
- June 2026: Kraig Biocraft Laboratories reported completion of its largest production cycle to date, producing nearly 2.5 metric tons of recombinant spider silk cocoons. The output milestone supports practical scale-up for non-traditional silk feedstocks that target performance and sustainability-driven applications beyond conventional mulberry silk.
- September 2025: AMSilk secured USD 55 million to expand bioreactor capacity in Slovakia to reduce the cost of recombinant silk production. The financing supports larger, more consistent supply for bio-based silk fibers and increases competitive pressure on traditional supply chains in premium and technical segments.
- April 2024: Kraig Biocraft Laboratories announced it successfully completed recombinant cocoon production from spring trials. The trial outcomes help de-risk commercialization for engineered silk inputs, supporting downstream yarn development programs in luxury and specialty textile applications.


Research Methodology Framework and Report Scope
Market Definition and Coverage
This market covers the value of silk yarn sold for further processing into textiles and related uses, counted at the point where yarn is traded as a yarn product and reported in USD.
Scope exclusions: This sizing does not include finished silk fabrics, garments, or downstream retail markups beyond the yarn stage.
Segmentation Overview
- By Geography
- North America
- United States
- Production Analysis (Area Harvested, Yield, Production Volume)
- Consumption Analysis (Value and Volume)
- Import Market Analysis (Value, Volume, Key Supplying Markets)
- Export Market Analysis (Value, Volume, Key Destination Markets)
- Wholesale Price Trend Analysis and Forecast
- Regulatory Framework
- List of Key Players
- Logistics and Infrastructure
- Seasonality Analysis
- Canada
- Production Analysis (Area Harvested, Yield, Production Volume)
- Consumption Analysis (Value and Volume)
- Import Market Analysis (Value, Volume, Key Supplying Markets)
- Export Market Analysis (Value, Volume, Key Destination Markets)
- Wholesale Price Trend Analysis and Forecast
- Regulatory Framework
- List of Key Players
- Logistics and Infrastructure
- Seasonality Analysis
- United States
- South America
- Brazil
- Production Analysis (Area Harvested, Yield, Production Volume)
- Consumption Analysis (Value and Volume)
- Import Market Analysis (Value, Volume, Key Supplying Markets)
- Export Market Analysis (Value, Volume, Key Destination Markets)
- Wholesale Price Trend Analysis and Forecast
- Regulatory Framework
- List of Key Players
- Logistics and Infrastructure
- Seasonality Analysis
- Argentina
- Production Analysis (Area Harvested, Yield, Production Volume)
- Consumption Analysis (Value and Volume)
- Import Market Analysis (Value, Volume, Key Supplying Markets)
- Export Market Analysis (Value, Volume, Key Destination Markets)
- Wholesale Price Trend Analysis and Forecast
- Regulatory Framework
- List of Key Players
- Logistics and Infrastructure
- Seasonality Analysis
- Brazil
- Europe
- Italy
- Production Analysis (Area Harvested, Yield, Production Volume)
- Consumption Analysis (Value and Volume)
- Import Market Analysis (Value, Volume, Key Supplying Markets)
- Export Market Analysis (Value, Volume, Key Destination Markets)
- Wholesale Price Trend Analysis and Forecast
- Regulatory Framework
- List of Key Players
- Logistics and Infrastructure
- Seasonality Analysis
- Germany
- Production Analysis (Area Harvested, Yield, Production Volume)
- Consumption Analysis (Value and Volume)
- Import Market Analysis (Value, Volume, Key Supplying Markets)
- Export Market Analysis (Value, Volume, Key Destination Markets)
- Wholesale Price Trend Analysis and Forecast
- Regulatory Framework
- List of Key Players
- Logistics and Infrastructure
- Seasonality Analysis
- United Kingdom
- Production Analysis (Area Harvested, Yield, Production Volume)
- Consumption Analysis (Value and Volume)
- Import Market Analysis (Value, Volume, Key Supplying Markets)
- Export Market Analysis (Value, Volume, Key Destination Markets)
- Wholesale Price Trend Analysis and Forecast
- Regulatory Framework
- List of Key Players
- Logistics and Infrastructure
- Seasonality Analysis
- Italy
- Asia-Pacific
- China
- Production Analysis (Area Harvested, Yield, Production Volume)
- Consumption Analysis (Value and Volume)
- Import Market Analysis (Value, Volume, Key Supplying Markets)
- Export Market Analysis (Value, Volume, Key Destination Markets)
- Wholesale Price Trend Analysis and Forecast
- Regulatory Framework
- List of Key Players
- Logistics and Infrastructure
- Seasonality Analysis
- India
- Production Analysis (Area Harvested, Yield, Production Volume)
- Consumption Analysis (Value and Volume)
- Import Market Analysis (Value, Volume, Key Supplying Markets)
- Export Market Analysis (Value, Volume, Key Destination Markets)
- Wholesale Price Trend Analysis and Forecast
- Regulatory Framework
- List of Key Players
- Logistics and Infrastructure
- Seasonality Analysis
- Thailand
- Production Analysis (Area Harvested, Yield, Production Volume)
- Consumption Analysis (Value and Volume)
- Import Market Analysis (Value, Volume, Key Supplying Markets)
- Export Market Analysis (Value, Volume, Key Destination Markets)
- Wholesale Price Trend Analysis and Forecast
- Regulatory Framework
- List of Key Players
- Logistics and Infrastructure
- Seasonality Analysis
- Uzbekistan
- Production Analysis (Area Harvested, Yield, Production Volume)
- Consumption Analysis (Value and Volume)
- Import Market Analysis (Value, Volume, Key Supplying Markets)
- Export Market Analysis (Value, Volume, Key Destination Markets)
- Wholesale Price Trend Analysis and Forecast
- Regulatory Framework
- List of Key Players
- Logistics and Infrastructure
- Seasonality Analysis
- China
- Middle East
- Turkey
- Production Analysis (Area Harvested, Yield, Production Volume)
- Consumption Analysis (Value and Volume)
- Import Market Analysis (Value, Volume, Key Supplying Markets)
- Export Market Analysis (Value, Volume, Key Destination Markets)
- Wholesale Price Trend Analysis and Forecast
- Regulatory Framework
- List of Key Players
- Logistics and Infrastructure
- Seasonality Analysis
- Saudi Arabia
- Production Analysis (Area Harvested, Yield, Production Volume)
- Consumption Analysis (Value and Volume)
- Import Market Analysis (Value, Volume, Key Supplying Markets)
- Export Market Analysis (Value, Volume, Key Destination Markets)
- Wholesale Price Trend Analysis and Forecast
- Regulatory Framework
- List of Key Players
- Logistics and Infrastructure
- Seasonality Analysis
- Turkey
- Africa
- Ethiopia
- Production Analysis (Area Harvested, Yield, Production Volume)
- Consumption Analysis (Value and Volume)
- Import Market Analysis (Value, Volume, Key Supplying Markets)
- Export Market Analysis (Value, Volume, Key Destination Markets)
- Wholesale Price Trend Analysis and Forecast
- Regulatory Framework
- List of Key Players
- Logistics and Infrastructure
- Seasonality Analysis
- Egypt
- Production Analysis (Area Harvested, Yield, Production Volume)
- Consumption Analysis (Value and Volume)
- Import Market Analysis (Value, Volume, Key Supplying Markets)
- Export Market Analysis (Value, Volume, Key Destination Markets)
- Wholesale Price Trend Analysis and Forecast
- Regulatory Framework
- List of Key Players
- Logistics and Infrastructure
- Seasonality Analysis
- Ethiopia
- North America
Data Sources, Market Sizing, and Validation
Desk Research
Desk research was used to build the base structure for supply, demand, and pricing, and then to keep assumptions realistic by cross-checking them against public signals. We relied on official production and trade statistics where available, and then used them to understand where yarn is made, where it is shipped, and how prices move over time.
Public sources that helped frame the model include UN Comtrade-style trade statistics, national customs and textile ministry releases, FAOSTAT-style agricultural and cocoon related series where relevant, World Bank macro indicators, and peer reviewed textile and fiber journals that discuss silk processing and yield. We also referred to company annual reports and investor decks, textile and apparel association websites, and reputable news coverage to validate capacity additions, demand shifts, and pricing commentary. For hard-to-compile items like shipment patterns and patent activity, we supplemented with paid subscriptions covering shipment level trade views and patent databases. These desk research sources are not exhaustive, and many other public materials were also used for data collection, validation, and clarification.
Primary Interviews and Surveys
Primary work focused on verifying what the desk data could not fully explain, especially yarn grade mix, typical contract pricing behavior, and how much output is sold as yarn versus converted internally. We spoke with participants across cocoon to yarn processing, traders, and downstream textile users, and then used their inputs to sanity check trade flows, utilization, and realistic price ranges across key regions (APAC, EMEA, and the Americas).
Distribution of primary research fieldwork respondents
| Company type | Respondent position | Region |
|---|---|---|
| Top tier: 30% | CXOs: 12% | APAC: 46% |
| Mid tier: 54% | Functional/Unit leaders: 32% | EMEA: 34% |
| Smaller Players: 16% | Managers: 56% | Americas: 20% |
Market-Sizing & Forecasting
Sizing started with a top-down build where production and trade data were used to reconstruct the addressable yarn value pool by region, and then it was converted into USD using consistent year-average exchange rates. To keep the totals grounded, results were corroborated with selective bottom-up checks, such as sampled supplier price quotes, typical yarn output per unit of cocoon intake, and channel checks on volumes moving through major trading routes.
Inputs that mattered most in this market included mulberry cocoon availability and yield patterns, reeling and spinning capacity utilization, import and export volumes for silk yarn categories, wholesale price trends for common yarn counts, and the share of yarn absorbed by apparel and home textile manufacturing in key countries. When a data series had gaps, we used conservative interpolation based on nearby years and trade mirror statistics, and then re-tested the impact in the final total.
For forecasting, we used scenario analysis supported by trend smoothing, where future values were guided by expected cocoon supply stability, capacity additions, and price movement expectations discussed by industry respondents. Assumptions were adjusted when multiple signals conflicted, such as when trade value rose but volumes were flat, which usually points to price effects that need to be modeled explicitly.
Data Validation & Update Cycle
Validation was done through triangulation across supply signals, demand signals, and pricing signals so that the market value does not hinge on one data point. We compared modeled totals with independent checks like regional trade balances, price per ton ranges implied by customs values, and the direction of textile output indicators, and then investigated any large variances before sign-off.
A multi-step internal review is followed, where assumptions are re-checked, calculations are audited, and outliers are explained or corrected. If a material event occurs, such as an abrupt cocoon price shock or a major capacity disruption, we re-contact sources to confirm what changed and update the model accordingly. Reports are refreshed annually, and before delivery an analyst performs a fresh pass so clients receive the latest updated view.
Mordor Intelligence's Silk Yarn Market Size Compared Against Other Published Estimates
Published market sizes for silk yarn can look far apart, even when they are discussing the same broad theme, because the product boundary and the way value is counted are not always the same. Differences also come from how trade values are converted into USD, whether prices are taken at producer level or later in the chain, and how often assumptions are refreshed.
The biggest gap drivers in silk yarn are usually about what gets included as yarn, especially when some sources bundle yarn spun from silk waste, silk thread categories, or even wider silk textiles into one number. Another driver is pricing logic, since using retail-like price points or aggressive price growth can inflate the value fast, while a more conservative view may keep prices closer to observed wholesale ranges. Timing matters too, because exchange-rate choices and year-average versus spot conversion can shift USD totals for a market that is concentrated in a few producing countries.
Benchmark comparison
| Source | Market Size | Gaps in Research Methodology |
|---|---|---|
| Mordor Intelligence | USD 44.90 M (2025) | |
| Global Research House A | USD 1087.20 M (2025) | This figure is presented for spun silk yarn specifically, which can pull in a wider spun-yarn scope and pricing set than a general silk yarn-only view, and it is often modeled with broader application coverage and longer-horizon assumptions. |
| Trade Intelligence Publisher B | USD 17100.00 M (2024) | This estimate explicitly includes silk yarn together with yarn spun from silk waste and related reporting categories, and it also reflects producer and importer revenues in a way that can capture a larger product basket than a pure silk yarn definition. |
The table shows a wide spread that is mainly explained by scope, and in Mordor Intelligence's model the value is limited to silk yarn at the yarn stage rather than bundling yarn spun from silk waste or broader silk items. When the definition is kept consistent and then cross-checked against trade value per ton and wholesale price ranges, the result becomes easier to trace and repeat year after year.


Key Questions Answered in the Report
How big will the silk yarn market be in 2031?
The market size will reach USD 61.0 million by 2031 based on a 5.22% CAGR from 2026.
What region is expanding fastest?
South America posts a 7.8% CAGR through 2031, driven by Spiber’s brewed-protein project with Suzano.
Why are medical applications surging?
Predictable degradation and strong patent activity push medical and biomedical yarn.
What keeps silk prices high?
Cocoon shortages and rising rural wages push raw-silk prices, dwarfing polyester costs.
Page last updated on:


 Your data is secure and never sold or shared.


