
North America Cotton Market Analysis by Mordor Intelligence
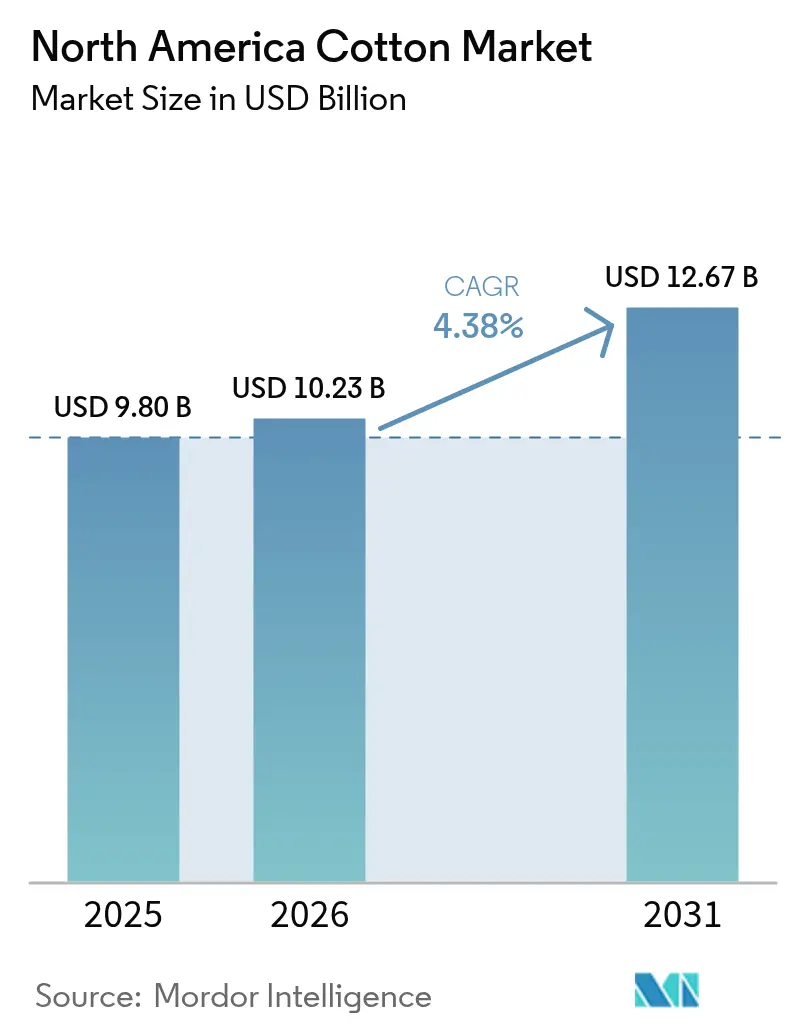
North America cotton market size in 2026 is estimated at USD 10.23 billion, growing from 2025 value of USD 9.8 billion with 2031 projections showing USD 12.67 billion, growing at 4.38% CAGR over 2026-2031. The expansion is rooted in federal revenue-support programs, rising global demand for traceable natural fibers, and the steady adoption of water-saving irrigation methods[1]Source: USDA Foreign Agricultural Service, “Cotton: World Markets and Trade,” fas.usda.gov. Farm-level carbon-credit payments, which add USD 20-45 per acre of incremental income, improve grower margins even in periods of futures-price volatility. Subsurface drip irrigation now covers 180,000 acres across the Texas High Plains, cutting water use by 30% and keeping yields above 1,000 pounds per acre. At the same time, bollworm resistance to Bacillus thuringiensis (Bt) traits raises pest-control costs by USD 40–60 per acre in hot-spot states, eating into producer profits. Marketing loans and crop insurance subsidies offset these headwinds, sustaining planted area at close to 11.5 million acres despite competing crop alternatives.
Key Report Takeaways
- By geography, the United States captured 88.05% of North America cotton market share in 2025, while Mexico is advancing at a 5.85% CAGR through 2031.
Note: Market size and forecast figures in this report are generated using Mordor Intelligence’s proprietary estimation framework, updated with the latest available data and insights as of 2026.
Market Trends and Insights
Drivers Impact Analysis of North America Cotton Market*
| Driver | (~) % Impact on CAGR Forecast | Geographic Relevance | Impact Timeline |
|---|---|---|---|
| Stable United States Department of Agriculture (USDA) support programs | +0.8% | United States dominant and modest spillover to Mexico | Medium term (2-4 years) |
| Rising global demand for sustainable natural fibers | +0.9% | North America as principal supplier to European Union and Asian mills | Long term (≥ 4 years) |
| Expansion of regenerative-agriculture acreage | +0.7% | United States core and early adoption in Mexico | Medium term (2-4 years) |
| Growth in textile-recycling initiatives driving virgin-cotton blending | +0.5% | North America benefits as major exporter | Long term (≥ 4 years) |
| Increasing water-efficient drip-irrigation adoption | +0.6% | United States (Texas High Plains, Arizona) while limited in Mexico | Short term (≤ 2 years) |
| Surge in farm-level carbon-credit monetization opportunities | +0.5% | United States leading and Mexico nascent | Medium term (2-4 years) |
| Source: Mordor Intelligence | |||
Stable United States Department of Agriculture (USDA) Support Programs
Price loss coverage, agriculture risk coverage, and subsidized crop insurance provide predictable revenue floors, insulating growers from volatile ICE futures swings. Reference prices fixed at 76.3 cents per pound guarantee breakeven returns on roughly 70% of national acreage. Emergency Conservation Assistance of USD 84.7 per acre encourages the adoption of cover crops and precision input management. This financial safety net underpins annual plantings between 11 million and 12 million acres, preventing a mass switch to soybeans or sorghum when cotton prices dip.
Rising Global Demand for Sustainable Natural Fibers
Apparel brands such as Hennes and Mauritz (H&M) and Inditex have committed to eliminating virgin polyester by 2030, redirecting procurement toward certified cotton. United States Cotton Trust Protocol enrollment rose from 18% to 25% of national acreage in one year, enabling mills in Bangladesh and Vietnam to meet European Union due diligence mandates. Certified lint trades at a 5-8% premium, rewarding growers who implement full traceability systems and disadvantaging conventional sellers.
Expansion of Regenerative-Agriculture Acreage
The Kellanova and Archer-Daniels-Midland (ADM) partnership pays USD 15–25 per acre for 120 thousand acres of cotton to integrate cover crops and implement reduced tillage. Cargill, Incorporated's RegenConnect expanded to 500 thousand acres, with cotton accounting for 20%. Protocol Level 2 verification unlocks up to USD 45 per acre, making regenerative practices financially viable in water-stressed West Texas. Stronger soil structure and higher organic matter also improve lint quality, resulting in downstream benefits for spinners.
Growth in Textile-Recycling Initiatives Driving Virgin-Cotton Blending
Mechanical recycling shortens fiber length by as much as 30%, forcing mills to blend recycled feedstock with new lint to preserve yarn strength[2]Source: Government Accountability Office, “Textile Recycling: Challenges and Opportunities,” gao.gov. Brands targeting 50% recycled content by 2030 must therefore source virgin cotton to maintain fabric durability, creating a structural demand floor even as post-consumer waste volumes rise. Chemical recycling technologies, such as Circ's hydrothermal process, can preserve fiber length; although pilot-scale costs remain 40% above those of virgin cotton, limiting commercial deployment. This dynamic suggests that North American producers will continue to supply blending-grade cotton to mills in Turkey and Pakistan that specialize in recycled-virgin hybrid yarns.
Restraints Impact Analysis of North America Cotton Market*
| Restraint | (~) % Impact on CAGR Forecast | Geographic Relevance | Impact Timeline |
|---|---|---|---|
| Volatile commodity pricing tied to futures speculation | −0.9% | Global, North America as price-taker in ICE futures | Short term (≤ 2 years) |
| Escalating pest-resistance to Bt traits | −0.7% | United States Southeast and Mid-South, emerging in Mexico | Medium term (2-4 years) |
| Stricter labor-traceability requirements from brands | −0.4% | Global, compliance costs concentrated in United States export channels | Medium term (2-4 years) |
| Growing hemp fiber substitution in technical textiles | −0.3% | North America and European Union, niche displacement | Long term (≥ 4 years) |
| Source: Mordor Intelligence | |||
Volatile Commodity Pricing Tied to Futures Speculation
Futures market dynamics amplify price swings beyond fundamental supply-and-demand signals, destabilizing planting decisions. New York ICE cotton futures traded in a 16-cent range during the 2024 marketing year, with speculative positioning by commodity trading advisors accounting for 40% of open interest according to Commodity Futures Trading Commission data. A March 2024 International Cotton Advisory Committee report attributed a 12-cent price surge to algorithmic trading strategies that misinterpreted Chinese reserve-release announcements, triggering a short-covering rally disconnected from physical mill demand. This volatility compresses forward-contracting windows, forcing producers to accept basis risk or forgo price discovery entirely.
Escalating Pest-Resistance to Bt Traits
Bollworm populations have developed resistance to pyramided Bt traits across the Cotton Belt, eroding the economic advantage of genetically engineered varieties. Texas A&M AgriLife Extension documented bollworm survival rates above 20% on WideStrike 3 and Bollgard 3 cotton in 2024, necessitating supplemental insecticide applications that add USD 40 to USD 60 per acre in input costs. The Environmental Protection Agency's Insect Resistance Management requirements mandate refuge acreage, but compliance audits in Georgia and Alabama found that 30% of growers failed to plant the required 5% non-Bt refuge, thereby accelerating the evolution of resistance[3]Source: Environmental Protection Agency, “Insect Resistance Management for Bt Cotton,” epa.gov. Seed companies are developing next-generation traits that stack Bt proteins with RNA interference mechanisms, yet commercial release is not anticipated until 2027, leaving a multi-year window where growers must rely on conventional chemistries.
*Our forecasts treat driver/restraint impacts as directional, not additive. The impact forecasts reflect baseline growth, mix effects, and variable interactions.
Geography Analysis
North America Cotton Market
The United States contributed 88.05% to the North America cotton market size in 2025, equal to 14.37 million bales, while Mexico grew at a 5.85% CAGR and Canada remained a net importer. New irrigation systems in Chihuahua and Baja California have expanded the planted area in Mexico to 102,000 hectares.
Southern United States and Mexico Cotton Market
The lack of access to genetically engineered seeds restricts average yields to 890 kilograms per hectare, far below the 1,200 kilograms achieved in Texas and Georgia. United States growers leverage loan-rate guarantees and 62% crop-insurance subsidies to manage revenue risk, allowing the segment to maintain 11–12 million acres despite volatile prices. Mexico relies on lower land costs and proximity to Carolinas mills, which reduces freight charges by 20–30% compared to Panhandle origins.
North America and Europe Cotton Market
Regenerative incentives further widen the competitiveness gap. Twenty-five percent of United States acreage, or roughly 3 million acres, already qualifies for the Protocol Level 2 premium, whereas Mexican lint lacks recognized traceability pathways. This premium tier commands a 5%–8% price differential and positions United States cotton as a default supply for brands operating under the European Union due-diligence regime. Canada, importing 50,000 metric tons annually, specifies Better Cotton lint for its technical-textile cluster in Quebec, a demand pull that disproportionately benefits United States suppliers.
Regulatory Landscape
In the United States, cotton economics and compliance are shaped by USDA program administration and federal rulemaking, along with pesticide and biotech oversight. In May 2026, USDA announced the Great American Cotton Plan, framing federal actions around strengthening the cotton farm economy and supporting domestic cotton use, including support measures tied to textile-mill adjustment assistance.
On trade-linked assessments and standards, USDA Agricultural Marketing Service implemented a final rule (effective March 2026) adjusting supplemental assessments on imported cotton and cotton products to keep parity with domestic assessment levels. Separately, the December 2024 federal court vacatur of USDA APHIS Part 340 (the 2020 SECURE rule) returned biotech products to pre-2020 processes, shifting the near-term regulatory environment for next-generation trait pathways referenced by seed developers and resistance-management stakeholders.
Value Chain Analysis
The North America cotton value chain runs from seed and crop inputs (including Bt-traited varieties and insecticides) through farm production, ginning and classing, warehousing, merchanting and export logistics, and mill consumption in domestic and nearby Western Hemisphere supply chains. USDA support programs and crop insurance provide stabilization at the farm gate, while export channels dominate downstream as U.S. mill use has been reported at about 1.6 to 1.7 million bales in 2025-2026 and exports account for a large majority of demand (about 88% as of 2026).
Traceability and sustainability verification increasingly function as an enabling layer alongside physical flows for market access and premiums. The U.S. Cotton Trust Protocol is used as a voluntary framework for data capture and verification, while merchants are incorporating farm-level metrics into procurement, including Olam Agri's partnership with the Soil Health Institute and AtSource traceability across 200,000 acres in Texas and Oklahoma. Bottlenecks and risk points tend to concentrate in warehousing and shipping performance, and in buyer-side payment and scheduling constraints in key import markets, which raises the value of coordinated logistics and standardized digital documentation.
Market Opportunities and Future Outlook
Opportunities focus on rebuilding and defending demand through domestic-use programs, improved logistics, and premium positioning around verified sustainability. USDA's May 2026 Great American Cotton Plan provides a policy-led channel to support U.S. cotton use and textile competitiveness, while the National Cotton Council has elevated the Buying American Cotton Act (BACA) as a demand-side lever linked to U.S.-grown cotton in retail products. In parallel, NCC's Plant Not Plastic campaign positions cotton against synthetic-fiber microfiber concerns, reinforcing brand and retailer narratives that already favor traceable natural fibers.
Operationally, supply-chain performance is a visible gap given the export-heavy balance and reported friction in movement timing. In February 2026, the NCC Cotton Flow Committee initiated a review of warehouse performance, scheduling, and shipping dates to improve cotton movement efficiency, complementing USDA modernization work such as the One Farmer, One File program that integrates record-keeping across the Farm Service Agency, Natural Resource Conservation Service, and Risk Management Agency. For growers, scaling traceability and regenerative verification remains a monetization route supported by platforms and programs already enrolling acreage and paying per-acre incentives, which helps maintain participation despite volatility and pest-management cost inflation tied to Bt resistance hot spots.
Recent Industry Developments in North America Cotton Market
- May 2026: USDA launched the Great American Cotton Plan to revitalize the U.S. cotton farm economy, pairing demand-building efforts such as Plant Not Plastic with measures supporting textile-mill adjustment assistance. The program sharpened the focus on domestic cotton consumption alongside export reliance, aligning federal actions with industry campaigns and mill competitiveness needs.
- February 2026: The National Cotton Council released U.S. producer planting intentions of 9.0 million acres of cotton for 2026, down 3.2% from 2025. The update pointed to tighter acreage planning decisions under input-cost pressure and price volatility, shaping expectations for merchant coverage and downstream procurement timing.
- March 2025: Cargill expanded its RegenConnect platform across multiple crops in North America, with cotton representing about 20% of enrolled acreage and payments of USD 15-25 per acre for practice changes. The expansion increased the availability of standardized pathways for growers to generate carbon-related revenue and provide documented sustainability attributes to merchants and mills.


North America Cotton Market Report Scope and Research Methodology
Market Definition and Coverage
This market covers the value of cotton in North America, tracked through supply, demand, trade, and pricing signals so the final number reflects cotton consumption and related market flows in the region.
Scope exclusions: Cottonseed, cotton yarn, and downstream textiles are excluded from this sizing.
Segments Covered in This Report
- By Geography (Production Analysis (Volume), Consumption Analysis (Volume and Value), Import Analysis (Volume and Value), Export Analysis (Volume and Value), and Price Trend Analysis)
- United States
- Canada
- Mexico
Data Sources, Market Sizing, and Validation
Desk Research
Desk research was used to set the factual base for North America supply, demand, and trade before assumptions were built into the model. We relied on public agriculture and trade series such as USDA (including NASS and FAS releases), FAOSTAT, UN Comtrade, and official statistics pages from the United States, Canada, and Mexico, followed by trade association updates that discuss acreage, yields, and ginning activity.
In parallel, price direction and conversion logic were checked using futures and spot-market references that are publicly available, along with company filings, investor presentations, and reputable press coverage that reports planting intentions, weather impacts, and export commitments. Paid subscriptions for company financials and shipment level import-export checks were used selectively to validate outliers and to confirm whether volume signals aligned with reported revenues. The desk sources listed here are illustrative, and many other public documents were used for data collection, cross-checks, and clarification.
Primary Interviews and Surveys
Primary work was used to pressure-test the desk view, especially for near-term pricing, crop mix shifts, and how much production was expected to move to export versus local mills. We spoke with growers and cooperatives, ginners and traders, and downstream buyers, and then rechecked key assumptions across the United States, Mexico, and Canada so the regional picture did not lean on one country alone.
Distribution of primary research fieldwork respondents
| Company type | Respondent position |
|---|---|
| Top tier: 33% | CXOs: 14% |
| Mid tier: 50% | Functional/Unit leaders: 37% |
| Smaller Players: 17% | Managers: 49% |
Market-Sizing & Forecasting
Sizing started from a top-down reconstruction where acreage and yield data were converted into production, which was then reconciled with imports, exports, and implied domestic use to land on a value view using observed price trends. To keep the totals realistic, we corroborated the output with selective bottom-up checks like sampled price per pound multiplied by shipment volumes, and channel checks with ginners and merchants.
A few inputs carried the model most years, such as planted area, yield per harvested acre, ending stocks, export commitments, and realized shipment volumes, plus regional price trends including the timing of seasonal moves after harvest. Where gaps existed in country-level splits, proxy ratios based on historical production and trade shares were applied and then revisited during interviews so the estimate did not drift away from real market behavior. For forecasting, scenario analysis was used, since weather variability and policy-driven trade shifts can move volumes and prices quickly, and then the selected scenario was tuned using expert expectations for yield, stocks, and export strength.
Data Validation & Update Cycle
Validation was done in layers so one data series could not silently drive the final number. We compared modeled totals against independent signals like production bulletins, trade balances, and price movement consistency, and then ran variance checks at the country level before sign-off.
When a large swing was found, the assumption was reopened, and respondents were re-contacted to confirm whether the change came from acreage, yield, export flow, or pricing timing. Reports are refreshed annually, and interim updates are made when material events occur, such as major weather disruptions or sudden trade policy shifts. Before delivery, a final analyst pass is completed so the published view reflects the most current public releases and validated assumptions.
Mordor Intelligence's North America Cotton Market Size Compared With Other Published Estimates
It is normal to see different market sizes for North America cotton because published studies can count different product baskets, use different price points, and anchor the base year to different crop outcomes. The split between domestic use and export, plus how stock changes are treated in value terms, also tends to widen the spread.
Cottonseed revenues sit outside Mordor Intelligence's scope here, so estimates that bundle lint and cottonseed, or that extend into yarn and textiles, will usually print a larger number even when the region coverage looks similar. Differences also come from whether values are reported at farm-gate versus a later wholesale stage, how currency timing is applied, and how often the model is refreshed when USDA production or export numbers are revised.
Benchmark comparison
| Source | Market Size | Gaps in Research Methodology |
|---|---|---|
| Mordor Intelligence | USD 9.80 B (2025) | |
| Industry Publisher A | USD 13.47 B (2024) | Uses a broader product scope that includes lint and cottonseed and applies its own base year and forecast window, which can raise the value versus a lint-only framing. |
| Trade Analytics House B | USD 17.30 B (2024) | Focuses on cotton lint but values the market at nominal wholesale prices and uses a trade-revenue style construct, which can differ from consumption-led reconciliation and price timing. |
Looking across the table, the biggest driver of the gap is what is counted as the market and the price stage used to convert volumes into dollars. By keeping the scope tight to cotton and tying each year to observable production, trade, and price signals, the estimate stays easier to follow and to replicate when new crop data is released.


Key Questions Answered in the Report
What is the current value of the North America cotton market?
The North America cotton market is valued at USD 10.23 billion in 2026 and is projected to reach USD 12.67 billion by 2031.
How fast is the market growing?
The market is expanding at a 4.38% CAGR over 2026-2031.
Which country leads regional production?
The United States controls 88.05% of North American cotton output.
What sustainability programs offer the highest farm premiums?
United States Cotton Trust Protocol Level 2 verification can pay up to USD 45 per acre for meeting rigorous greenhouse-gas benchmarks.
How does drip irrigation impact water use?
Subsurface drip systems lower water application by 30% while maintaining yields above 1,000 pounds per acre in the Texas High Plains.
Page last updated on:





