Market Overview
| Study Period | 2021 - 2031 |
|---|---|
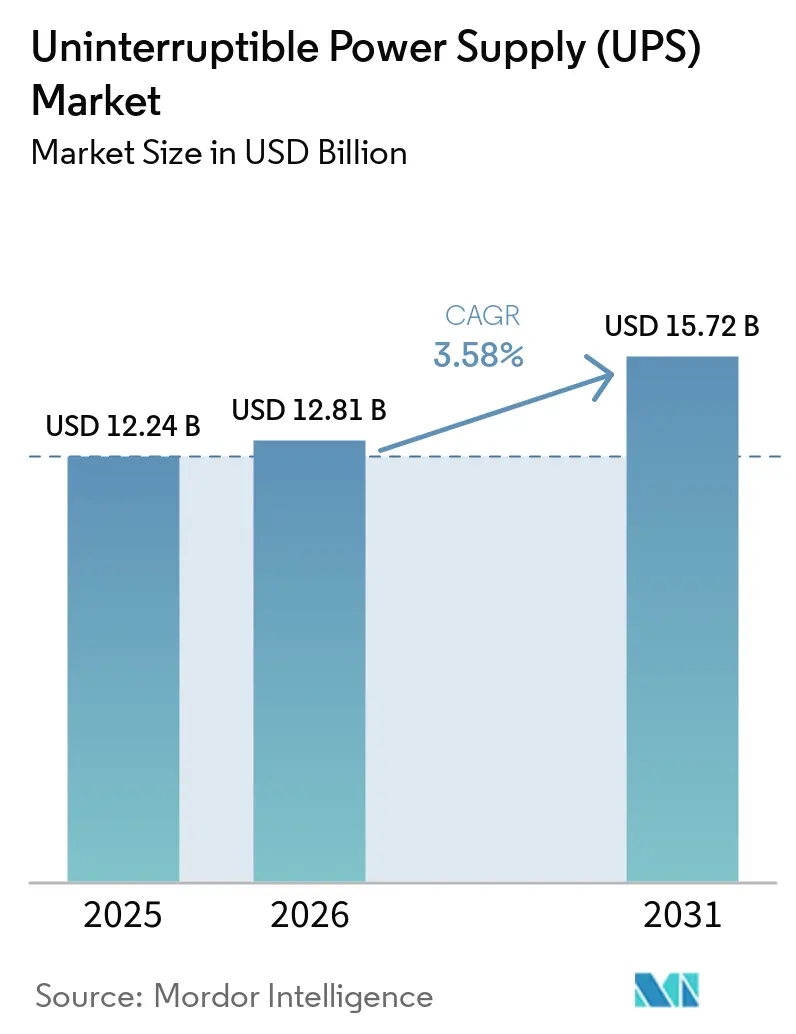
| Market Size (2026) | USD 12.81 Billion |
| Market Size (2031) | USD 15.72 Billion |
| Growth Rate (2026 - 2031) | 3.58% CAGR |
| Fastest Growing Market | Asia-Pacific |
| Largest Market | Asia-Pacific |
| Market Concentration | Medium |
Major Players_Market.webp) *Disclaimer: Major Players sorted in no particular order Image © Mordor Intelligence. Reuse requires attribution under CC BY 4.0. | |
Uninterruptible Power Supply (UPS) Market Analysis by Mordor Intelligence
The Uninterruptible Power Supply Market size is expected to increase from USD 12.24 billion in 2025 to USD 12.81 billion in 2026 and reach USD 15.72 billion by 2031, growing at a CAGR of 3.58% over 2026-2031.
This trajectory is underpinned by hyperscale data-center build-outs, AI-driven rack densities above 30 kW, and battery-as-a-service (BaaS) contracts that convert capital expenditure into operating expense. Lithium-ion adoption in systems over 100 kVA is accelerating as operators reclaim valuable white space, while standby units remain dominant in residential and small-business segments that prize sub-USD 500 price points. Supply-chain congestion for insulated-gate bipolar transistors (IGBTs) and silicon-carbide (SiC) MOSFETs stretches lead times to 26 weeks, squeezing integrator margins and nudging vendors toward design-for-substitution platforms. Competitive intensity is moderate: the top five suppliers command roughly 45% global revenue, yet regional specialists and niche innovators continue to capture edge-computing and solar-plus-storage opportunities.
Key Report Takeaways
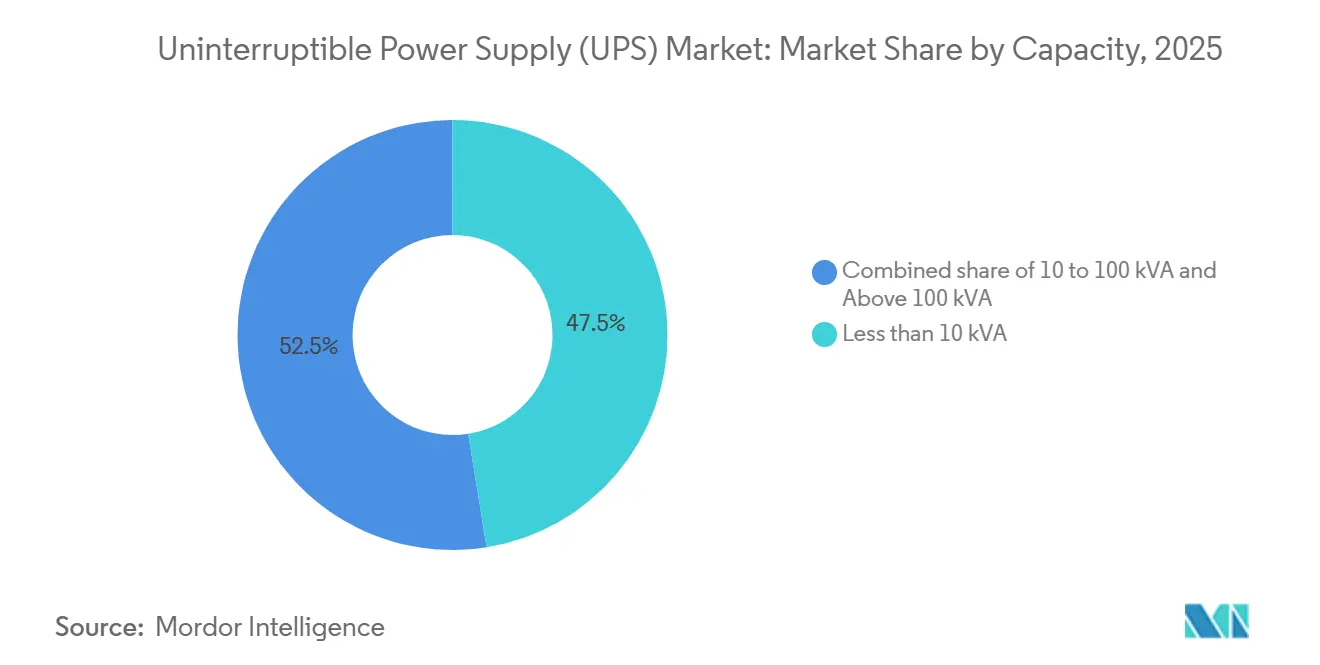
- By capacity, units below 10 kVA held 47.47% of 2025 shipments in the uninterruptible power supply market; systems above 100 kVA are projected to expand at a 4.43% CAGR through 2031.
- By type, standby topology led with a 52.86% revenue share in 2025, while line-interactive systems recorded the fastest CAGR at 4.13% through 2031.
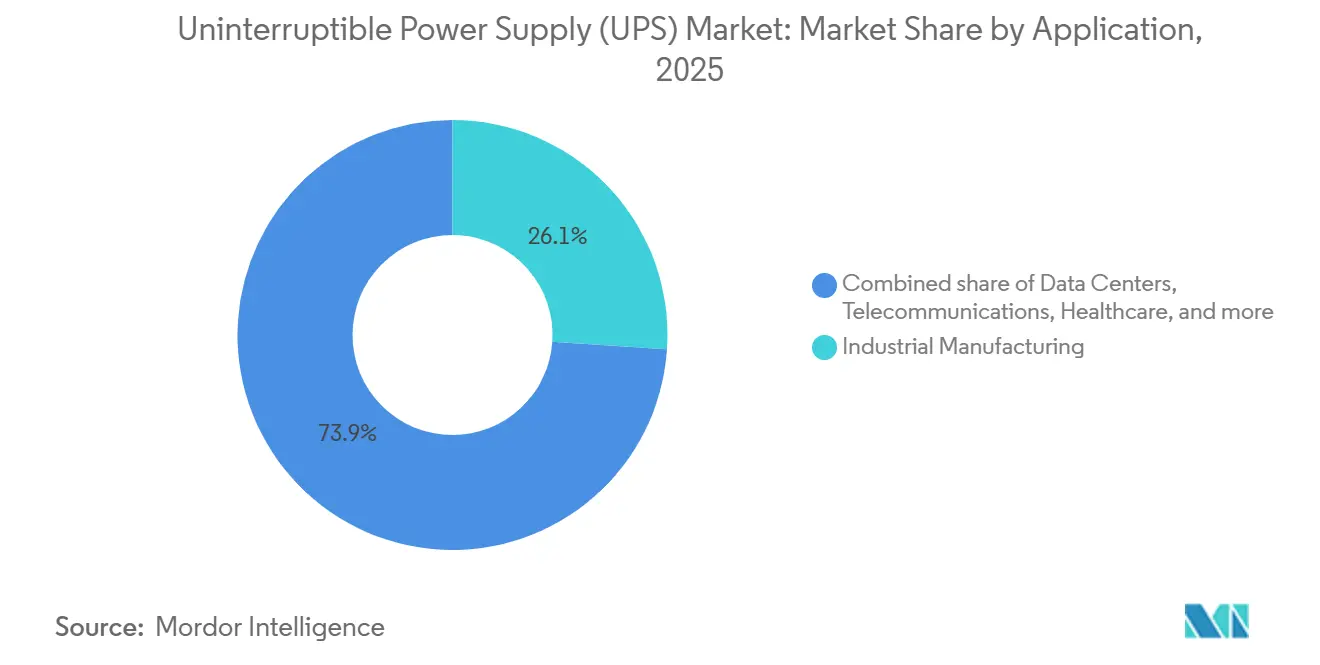
- By application, industrial manufacturing accounted for 26.06% of the uninterruptible power supply market share in 2025; data centers are advancing at a 4.32% CAGR to 2031.
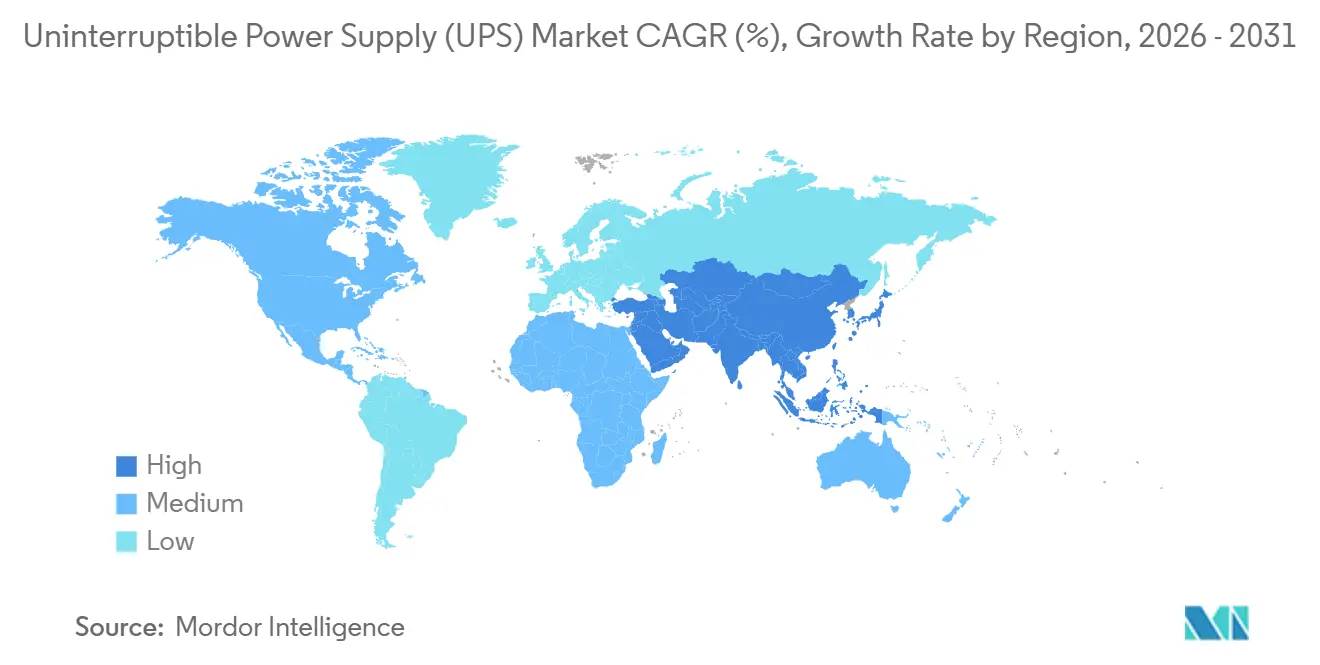
- By geography, Asia-Pacific captured 34.39% of 2025 revenue and is set to grow at a 3.96% CAGR through 2031.
Note: Market size and forecast figures in this report are generated using Mordor Intelligence’s proprietary estimation framework, updated with the latest available data and insights as of January 2026.
Global Uninterruptible Power Supply (UPS) Market Trends and Insights
Drivers Impact Analysis*
| Driver | (~) % Impact on CAGR Forecast | Geographic Relevance | Impact Timeline |
|---|---|---|---|
| Data-center capacity boom & hyperscale build-outs | 1.2% | Global, concentrated in North America, Europe, Asia-Pacific | Medium term (2-4 years) |
| AI server rack densities >30 kW driving lithium-ion UPS adoption | 0.9% | North America, Europe, China | Short term (≤ 2 years) |
| Edge computing roll-outs in 5G & Industry 4.0 | 0.7% | Asia-Pacific core, spill-over to Middle East & Africa | Medium term (2-4 years) |
| Battery-as-a-Service (BaaS) contracts lowering capex barriers | 0.5% | Global, early adoption in Europe & North America | Long term (≥ 4 years) |
| Backup mandates for mission-critical healthcare facilities | 0.4% | Global, stringent enforcement in North America & Europe | Medium term (2-4 years) |
| Surge in modular UPS retrofits for brownfield sites | 0.3% | North America, Europe, Asia-Pacific industrial hubs | Long term (≥ 4 years) |
| Source: Mordor Intelligence | |||
Data-Center Capacity Boom & Hyperscale Build-Outs
Hyperscale operators commissioned 2.8 GW of new capacity in 2025, with AWS, Microsoft, and Google accounting for 63% of additions.[1]Synergy Research Group, “Hyperscale Data-Center Capacity Tracker,” srgresearch.com Shipment clusters in Northern Virginia, Frankfurt, Singapore, and Mumbai absorbed 42% of large-system orders, stressing regional supply chains for >1 MW modules. Cloud SLAs now penalize downtime at USD 10,000 per minute, pushing the adoption of 2N and 2N+1 topologies that double UPS footprint per megawatt. Modular UPS platforms allow phased deployment, reducing stranded capital by 18% across a 10-year horizon.[2]Schneider Electric, “EcoStruxure for Data Centers,” se.com Prefabricated electrical rooms trimmed on-site build time from 14 months to 7 months, easing labor bottlenecks.[3]Vertiv, “Modular UPS Architectures,” vertiv.com The EU Energy Efficiency Directive’s quarterly PUE reporting requirement further tilts procurement toward high-efficiency online double-conversion units.
AI Server Rack Densities >30 kW Driving Lithium-Ion UPS Adoption
NVIDIA H100/H200 GPU racks exceed 35 kW, tripling legacy server loads and prompting a pivot to lithium-ion batteries that deliver triple the energy density of VRLA alternatives.[4]NVIDIA, “H100 GPU Architecture,” nvidia.com Operators reclaim 40% of battery-room floor space and cut HVAC load by 8 kW per megawatt, translating to USD 75,000 annual cooling savings.[5]ABB, “Ability Energy Management,” new.abb.com Safety concerns persist: three lithium-ion fires hit European colocation sites in 2024, leading insurers to lift premiums 22% for facilities with >5 MWh UPS capacity. Compliance with IEC 62619 and UL 1973 is now a must-have gate in hyperscaler tenders. Cell-level thermal sensors and aerosol suppression add USD 120 per kWh to system cost, but help contain thermal-runaway risk.
Edge Computing Roll-Outs in 5G & Industry 4.0
Telecom operators added 127,000 5G base stations in 2025; each node needs 3-10 kVA backup to meet five-nines availability. These cabinets are typically unattended, so UPS units must support remote diagnostics that flag battery degradation 90 days prior to failure. Factory floor edge gateways introduce harsh conditions, spurring demand for ruggedized 0 °C-50 °C units. Line-interactive designs that correct sags without drawing on batteries extend cell life by 30% on brownout-prone grids in India, Indonesia, and Nigeria. Distributed networks push mean-time-to-repair from 4 hours on a hyperscale campus to 18 hours across 5G footprints, amplifying the value of hot-swappable modules.
Battery-as-a-Service Contracts Lowering Capex Barriers
Schneider Electric and ABB now bundle equipment, lithium-ion batteries, and 10-year maintenance into monthly fees starting at USD 8,500 per 100 kVA. BaaS converts a USD 500,000 outlay into OPEX and frees brownfield plants from capital-budget hurdles. Providers retain battery ownership, aggregating end-of-first-life cells into second-use storage fleets that earn frequency-regulation revenue, subsidizing pricing by 12%. Uptake is strongest in Europe, where circular-economy mandates prevail, and North America, where investors monetize solar-storage tax credits. Contract-length mismatches, 5-year lessee cycles vs 10-year lessor amortization, are being bridged by dedicated financing vehicles.
Restraints Impact Analysis*
| Restraint | (~) % Impact on CAGR Forecast | Geographic Relevance | Impact Timeline |
|---|---|---|---|
| Supply-chain tightness in IGBTs & power semiconductors | -0.6% | Global, acute in Asia-Pacific manufacturing hubs | Short term (≤ 2 years) |
| High capex/opex versus generator alternatives | -0.4% | South America, Middle East, Sub-Saharan Africa | Medium term (2-4 years) |
| Grid-connected energy-storage regulations delaying deployments | -0.3% | North America, Europe, select Asia-Pacific markets | Medium term (2-4 years) |
| Thermal run-away risks in high-density Li-ion racks | -0.2% | Global, heightened scrutiny in Europe & North America | Short term (≤ 2 years) |
| Source: Mordor Intelligence | |||
Supply-Chain Tightness in IGBTs & Power Semiconductors
Lead times for 1200 V IGBTs stretched to 26 weeks in 2025 as EV and inverter demand soaked up 68% of capacity. SiC MOSFET supply remains on 40-week allocations, with new fabs delayed until late 2027. Spot prices for 600 A modules leapt 34% year over year, compressing mid-tier vendor margins. Vertiv and Eaton now design platforms that accept either IGBT or SiC modules, trading 3% efficiency to ensure continuity. Chinese suppliers Kehua Tech and INVT Power benefit from domestic IGBT lines by BYD Semiconductor, while European integrators face export controls on >1200 V devices.
High Capex/Opex Versus Generator Alternatives
Diesel gensets cost USD 800 per kVA installed versus USD 1,600 per kVA for an online UPS with 15 minutes of runtime. In markets with monthly outages above 4 hours, generators often win the TCO race. Hybrid designs pairing a 10-minute UPS with auto-transfer and gensets cut capital outlay by 40% but accept short ride-through gaps. Stricter EU Stage V and U.S. Tier 4-Final rules add USD 15,000-30,000 per generator, narrowing the gap. Insurance underwriters tag diesel systems as “hazardous operations,” raising property premiums 8-12%, while UPS installations face surcharges only when lithium-ion storage tops 600 kWh.
*Our forecasts treat driver/restraint impacts as directional, not additive. The impact forecasts reflect baseline growth, mix effects, and variable interactions.
Segment Analysis
By Capacity: Hyperscale Drives >100 kVA Surge
Shipments below 10 kVA dominated with 47.47% in 2025, reflecting edge offices and smart-retail nodes that favor easy plug-and-play units. Mid-tier 10-100 kVA systems serve small and medium enterprises and telecom hubs, yet macro uncertainty muted spend in 2025. The >100 kVA cohort will rise at a 4.43% CAGR through 2031 as hyperscale campuses adopt parallel-redundant 1 MW modules. Modular rollout lets operators stage 250 kW blocks, improving 10-year ROI by 14%.
Lithium-ion commanded 62% of >100 kVA shipments in 2025 but only 8% of sub-10 kVA units because its USD 400 per kWh premium is unjustified for light-duty loads. SiC MOSFET-enabled platforms hit 98% efficiency at 50% load, freeing 120 kW of cooling per MW, room for 12 extra racks, and meeting VFI-SS-111 specs that hyperscalers now demand. Rack-level UPS in the 10-100 kVA band saves 30% copper and isolates faults faster, eroding the case for centralized plant.


By Type: Line-Interactive Gains on Grid Instability
Standby units led with 52.86% revenue in 2025, anchored in SOHO and consumer electronics, where sub-USD 500 price tags outweigh voltage-control gaps. Online double-conversion protects zero-tolerance loads in hospitals, trading a 4-6% energy penalty for seamless ride-through. Eco-mode bypass lifts efficiency to 99% while preserving <4 ms transfer times.
Line-interactive solutions will post the fastest 4.13% CAGR, as grids integrating renewables see ±10% voltage swings. Automatic voltage regulation limits battery cycles, extending life 30% in brownout zones. Commercial real estate, from HVAC controllers to POS terminals, values the USD 5,000 per incident savings from avoiding nuisance trips. Updated IEEE 1547-2018 allows export to the grid, enabling line-interactive UPS fleets to earn demand-response revenue and offset 8-12% of purchase cost.
By Application: Data Centers Outpace Industrial Base
Industrial manufacturing retained the largest 26.06% share in 2025, driven by outage-sensitive batch processes where losses top USD 100,000 per event. These users prize 150,000-hour MTBF and modular hot-swap designs. Data-center deployments will grow 4.32% annually to 2031, propelled by AI clusters and edge nodes tied to 5G densification. Hyperscalers increasingly favor per-kWh BaaS contracts aligned with utilization, smoothing cash flow.
Telecommunications grew on the back of shipments in 2025 as 5G basestations proliferated. Healthcare mandates a 10-second transfer for life-safety loads, locking in online double-conversion adoption despite its 5% extra energy draw. Residential uptake lags at 4% revenue; inverter-battery integrators dominate solar-plus-storage channels. EV charging depots present a nascent niche for ride-through buffering, although capex priorities remain on chargers, not redundancy.
Geography Analysis
Asia-Pacific delivered 34.39% of 2025 revenue and will expand at a 3.96% CAGR, buoyed by China’s manufacturing engine and India’s Digital India mandate. Domestic suppliers hold a 28% Chinese share by leveraging vertically integrated IGBT supply, underselling Western peers by 18%. India’s data-center capacity is set to triple to 2,850 MW by 2030, creating a sustained pull for >1 MW modular UPS. Japan adds seismic reinforcement, costing an extra USD 80 per kVA, to meet 0.6 g standards. ASEAN attracted USD 4.2 billion FDI into data centers in 2025; land-constrained Singapore leads with high-density builds demanding advanced cooling and power. Australia’s wholesale demand response garners AUD 45 per MWh in grid-services revenue, improving UPS economics by 6%.
North America market is centered on 6.2 GW of commissioned hyperscale capacity in Northern Virginia, Dallas-Fort Worth, and Silicon Valley. U.S. data centers employ 2N+1 redundancy, which is tripling UPS footprint per megawatt as downtime penalties hit USD 10,000 per minute. Canada’s hydro-rich provinces attract AI clusters needing 50-200 MW UPS blocks, with sub-USD 0.04 per kWh electricity offsetting double-conversion inefficiency. Near-shoring in Mexico added 340 MW of industrial UPS demand in 2025 under phased IMMEX production. California Title 24’s real-time PUE disclosure nudges buyers toward 99%-efficient eco-mode units.
The European market is led by Germany, the U.K., and France, which account for 62% of shipments. Nordic countries exploit renewable power and cool climates, installing UPS qualified for −20 °C operation at a USD 50 per kVA premium. The EU’s sub-1.3 PUE target by 2027 accelerates demand for SiC-based 98%-efficient systems. Russia’s sanctions-hit market struggles for advanced power semiconductors, capping efficiency upgrades. Southern Europe pilots vehicle-to-grid programs that could erode small-capacity UPS demand.
South America is anchored by Brazi,l where line-interactive UPScountersr frequent voltage sags. Argentina leans on hybrid generator solutions amid currency volatility and 35% import tariffs. Colombia’s 8,200 new 5G sites stretch service networks across remote Andes. The Middle East and Africa market; Saudi Arabia’s NEOM targets 1.5 GW UPS installs, and South Africa’s 200-day load-shedding crisis makes UPS indispensable despite high duties.

Competitive Landscape
The uninterruptible power supply market exhibits moderate concentration: Eaton, Schneider Electric, Vertiv, ABB, and Huawei jointly hold about 45% revenue. Competitive wedges revolve around thermal-management IP, cloud-native fleet orchestration, and modular designs achieving sub-2-hour mean-time-to-repair. Schneider’s EcoStruxure and ABB’s Ability suites integrate predictive analytics to extend battery life by 20%. Chinese challengers Kehua Tech and INVT Power underprice Western rivals by 18% via domestic IGBT supply while meeting IEC 62040-3 specs. SiC MOSFET adoption delivers 98% efficiency and recovers 120 kW of cooling per MW, enabling 12 extra server racks in tight footprints.
Patent activity signals priorities: Eaton filed 14 applications on flywheel hybrids in 2025, and Vertiv focused on liquid-cooled battery enclosures. Consolidation continues: Eaton’s 2021 Tripp Lite buy added USD 500 million SOHO revenue, while Legrand’s 2024 Server Technology deal bolstered rack-PDU coverage. Compliance with IEC 62619, UL 1973, and IEEE 1547-2018 is now required in hyperscale RFPs, raising barriers for smaller entrants. BaaS models lock customers into 10-year contracts and monetize second-life batteries, shaving 12% off subscription costs and providing an annuity stream beyond hardware sales.
Uninterruptible Power Supply (UPS) Industry Leaders
ABB Ltd
Schneider Electric SE
EATON Corporation PLC
Vertiv
Delta Electronics
- *Disclaimer: Major Players sorted in no particular order

Recent Industry Developments
- November 2025: ABB partnered with VoltaGrid, a microgrid power generation company, to supply 27 synchronous condensers and prefabricated eHouse units in the United States. This partnership aims to improve grid stability and meet rising energy demands driven by artificial intelligence advancements.
- July 2025: Eaton invested USD 180 million to expand its Pune, India, plant, adding 250 MW annual modular lithium-ion UPS capacity.
- July 2025: Delta Electronics opened a 180 MW UPS line in Thailand, targeting ASEAN telecom and edge deployments.
- March 2025: Schneider Electric launched Galaxy VXL, a 1.5 MW SiC MOSFET UPS achieving 98.5% efficiency and IEEE 1547-2018 certification.


Global Uninterruptible Power Supply (UPS) Market Report Scope
An uninterruptible power supply (UPS), a power quality device, provides constant and stable power to a critical system load. The device prevents any potential incoming power quality issues from distribution systems like voltage sags, interruptions, harmonics, swells, and noise that hinder the performance of sensitive electronic components and other electrical equipment. It protects equipment that is sensitive to power quality fluctuations from interruptions, isolating the critical load from power quality issues in the incoming supply.
The uninterruptible power supply market is segmented by capacity (less than 10 KVA, 10-100 KVA, and Above 100 KVA), type (standby UPS system, online UPS system, and line-interactive UPS system), application (data centers, telecommunications, healthcare [hospitals, clinics, etc.], industrial, and other applications), and geography (North America, Europe, Asia-Pacific, South America, and Middle East and Africa). The report also covers the market size and forecasts across major regions. Market sizing and forecasts were made for each segment based on revenue (USD).
By Capacity
| Less than 10 kVA |
| 10 to 100 kVA |
| Above 100 kVA |
By Type
| Standby |
| Line-interactive |
| Online/Double-conversion |
By Application
| Data Centers |
| Telecommunications |
| Healthcare |
| Industrial Manufacturing |
| Commercial and Retail |
| Residential |
By Geography
| North America | United States |
| Canada | |
| Mexico | |
| Europe | Germany |
| United Kingdom | |
| France | |
| Italy | |
| Spain | |
| NORDIC Countries | |
| Russia | |
| Rest of Europe | |
| Asia-Pacific | China |
| India | |
| Japan | |
| South Korea | |
| ASEAN Countries | |
| Australia and New Zealand | |
| Rest of Asia-Pacific | |
| South America | Brazil |
| Argentina | |
| Colombia | |
| Rest of South America | |
| Middle East and Africa | Saudi Arabia |
| United Arab Emirates | |
| South Africa | |
| Egypt | |
| Rest of Middle East and Africa |
| By Capacity | Less than 10 kVA | |
| 10 to 100 kVA | ||
| Above 100 kVA | ||
| By Type | Standby | |
| Line-interactive | ||
| Online/Double-conversion | ||
| By Application | Data Centers | |
| Telecommunications | ||
| Healthcare | ||
| Industrial Manufacturing | ||
| Commercial and Retail | ||
| Residential | ||
| By Geography | North America | United States |
| Canada | ||
| Mexico | ||
| Europe | Germany | |
| United Kingdom | ||
| France | ||
| Italy | ||
| Spain | ||
| NORDIC Countries | ||
| Russia | ||
| Rest of Europe | ||
| Asia-Pacific | China | |
| India | ||
| Japan | ||
| South Korea | ||
| ASEAN Countries | ||
| Australia and New Zealand | ||
| Rest of Asia-Pacific | ||
| South America | Brazil | |
| Argentina | ||
| Colombia | ||
| Rest of South America | ||
| Middle East and Africa | Saudi Arabia | |
| United Arab Emirates | ||
| South Africa | ||
| Egypt | ||
| Rest of Middle East and Africa | ||


Key Questions Answered in the Report
How large is the global uninterruptible power supply market in 2026?
The uninterruptible power supply market size stood at USD 12.81 billion for 2026 and is on course for USD 15.72 billion by 2031.
Which UPS capacity segment is growing fastest?
Systems above 100 kVA lead growth with a 4.43% CAGR on the back of hyperscale data-center and AI server deployments.
Why are lithium-ion batteries gaining ground in UPS applications?
Lithium-ion delivers three times the energy density of VRLA, frees floor space, and supports partial-load efficiencies up to 98%, making it ideal for high-density racks.
What is Battery-as-a-Service and who is adopting it?
BaaS bundles hardware, batteries, and maintenance into monthly fees, shifting capex to opex; adoption is strongest among European and North American data-center operators.
How are semiconductor shortages affecting UPS lead times?
Tight supply of IGBTs and SiC MOSFETs has pushed component lead times to 26-40 weeks, prompting vendors to design platforms that accept either technology to mitigate risk.
Which region holds the largest share of UPS revenue?
Asia-Pacific leads with 34.39% of 2025 revenue, driven by China’s manufacturing scale and India’s expanding digital-infrastructure build-out.
Page last updated on:


