
Wind Turbine Composite Materials Market Size and Share
Market Overview
| Study Period | 2020 - 2031 |
|---|---|
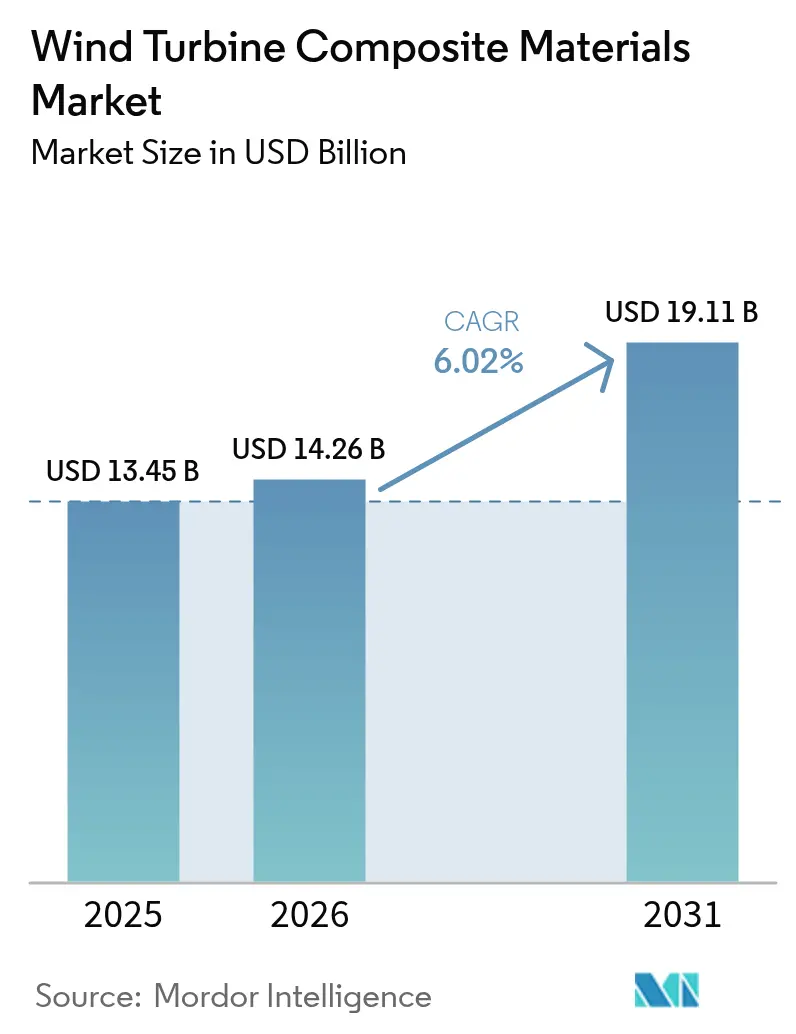
| Market Size (2026) | USD 14.26 Billion |
| Market Size (2031) | USD 19.11 Billion |
| Growth Rate (2026 - 2031) | 6.02 % |
| Fastest Growing Market | Asia Pacific |
| Largest Market | Asia Pacific |
| Market Concentration | Medium |
Major Players *Disclaimer: Major Players sorted in no particular order Image © Mordor Intelligence. Reuse requires attribution under CC BY 4.0. | |
Wind Turbine Composite Materials Market Analysis by Mordor Intelligence
Wind Turbine Composite Materials Market size in 2026 is estimated at USD 14.26 billion, growing from 2025 value of USD 13.45 billion with 2031 projections showing USD 19.11 billion, growing at 6.02% CAGR over 2026-2031. Widespread adoption of blades longer than 100 m, supported by lighter glass-, carbon- and hybrid-fiber architectures, is raising material content per turbine and pushing suppliers to expand capacity in Asia Pacific and Europe. Policy incentives such as the United Kingdom’s Contracts for Difference (CfD) budget and China’s 117 GW of new 2024 installations assure multi-year order visibility and accelerate automation and vertical integration strategies across the wind turbine composites market.
Key Report Takeaways
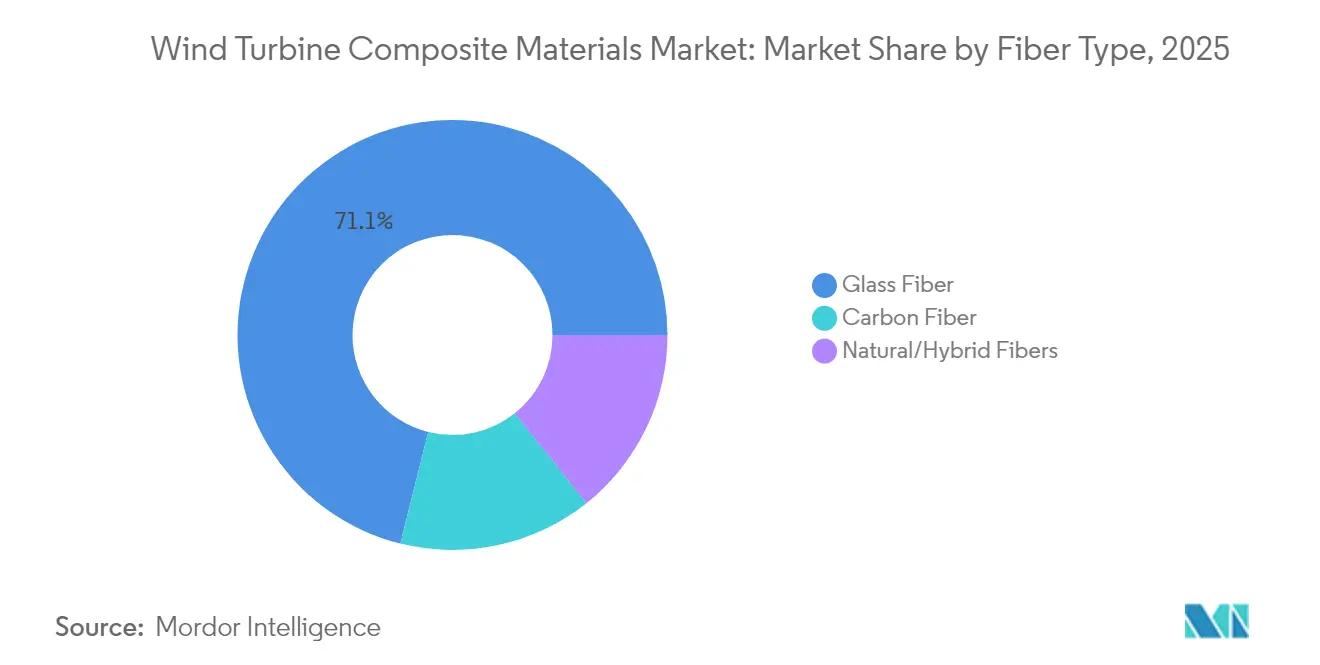
- By fiber type, glass fiber led with 71.10% wind turbine composites market share in 2025; carbon fiber is projected to post the highest 6.85% CAGR through 2031.
- By resin type, epoxy commanded 34.40% revenue share in 2025, while polyester/vinyl-ester systems are set to grow the fastest at 7.12% CAGR to 2031.
- By technology, vacuum infusion held 45.30% of the wind turbine composites market in 2025; prepreg processing is advancing at a 7.38% CAGR, the strongest among manufacturing routes.
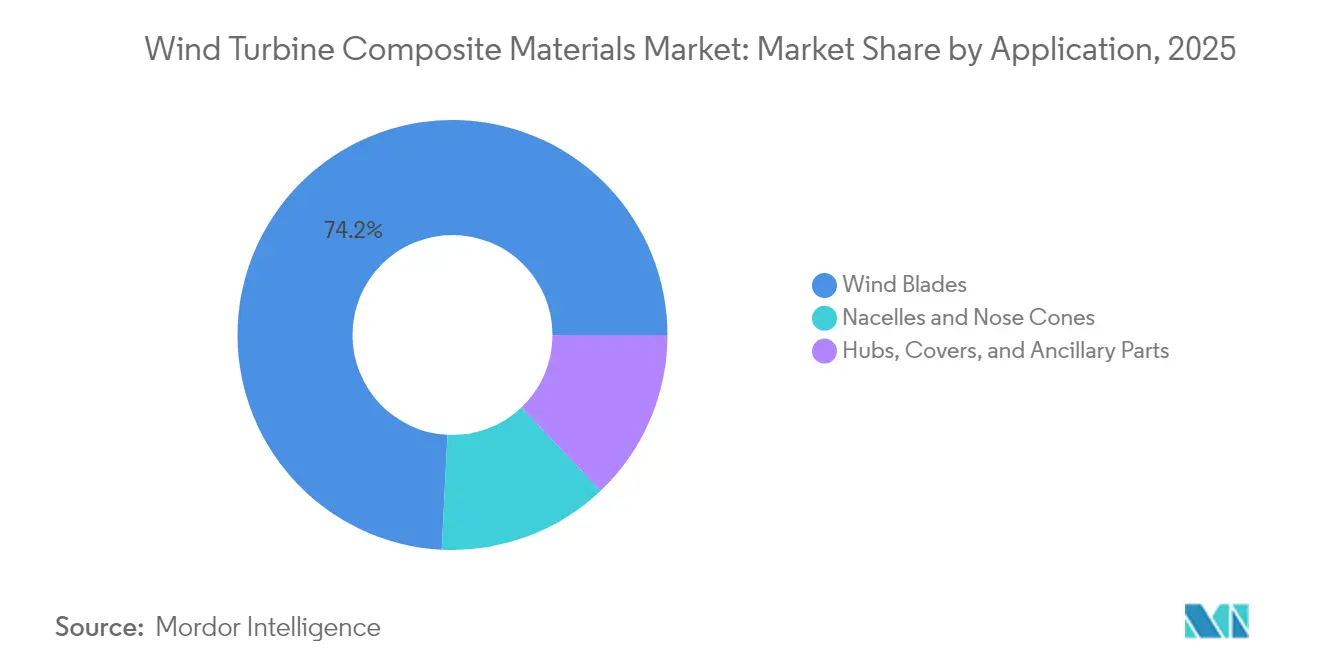
- By application, wind blades accounted for 74.20% of the wind turbine composites market size in 2025 and are expanding at a 7.14% CAGR.
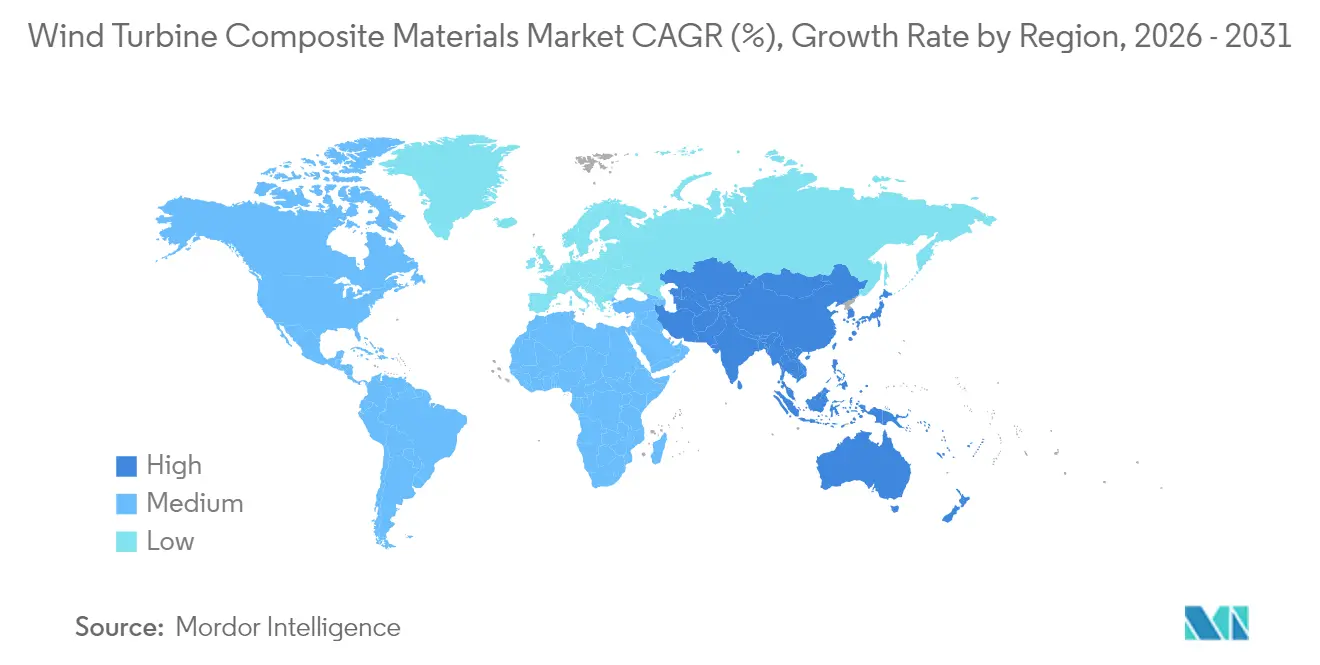
- By geography, Asia Pacific represented 46.10% of revenue in 2025 and shows the highest regional growth rate at 6.72% CAGR to 2031.
Note: Market size and forecast figures in this report are generated using Mordor Intelligence’s proprietary estimation framework, updated with the latest available data and insights as of 2026.
Market Trends and Insights
Drivers Impact Analysis of Wind Turbine Composite Materials Market*
| Drivers | (≈) % Impact on CAGR Forecast | Geographic Relevance | Impact Timeline |
|---|---|---|---|
| Increasing onshore and offshore turbine capacities | +1.8% | Global; strongest in Asia Pacific and Europe | Medium term (2-4 years) |
| Government decarbonization goals and CfD auctions | +1.5% | North America and EU; expanding to Asia Pacific | Short term (≤ 2 years) |
| Cost-saving polyurethane infusion resins | +0.9% | Global hubs, notably China and Europe | Medium term (2-4 years) |
| Bio-based or recyclable thermoplastic systems | +0.7% | EU and North America first movers | Long term (≥ 4 years) |
| Composites with smart-fabric integration | +0.4% | Advanced markets in North America, EU and select Asia Pacific economies | Long term (≥ 4 years) |
| Source: Mordor Intelligence | |||
Increasing Onshore and Offshore Turbine Capacities Drive Demand for Advanced Composites
Global turbine ratings now routinely exceed 15 MW offshore, pushing blade lengths past 115 m and multiplying structural loads that only advanced composites can withstand. Vestas’ 115.5 m-long blades on the V236-15 MW platform and Siemens Gamesa’s confidential 21.5 MW prototype exemplify the scale-up that magnifies composite volume per rotor while simultaneously mandating lighter carbon-reinforced spar caps for stiffness and fatigue resistance. The United Kingdom alone aims to raise offshore capacity to as much as 50 GW by 2030, a target that cements long-term pull for high-performance laminate systems able to deliver a 25-year design life in corrosive marine environments[1]Department for Energy Security and Net Zero, “Contracts for Difference Allocation Round,” gov.uk.
Government Decarbonization Policies Accelerate Composite Material Adoption
Supportive frameworks, such as the United Kingdom’s USD 1.2 billion CfD round dedicated to offshore wind and China’s record 117 GW of 2024 wind installations, lock in multi-gigawatt auction pipelines and de-risk investments in new composite plants. Clean-industry bonus mechanisms that reward low-carbon supply chains are encouraging local blade production and greener resin chemistries. The European Green Deal’s binding 2030 renewables targets, along with Germany’s 80% clean-power ambition, consolidate demand visibility across the wind turbine composites market and motivate capacity expansions from Vestas, LM Wind Power, and Chinese glass-fiber majors. Carbon pricing and renewable energy certificates further boost project economics, ensuring sustained pull for lightweight, durable, and recyclable composites.
Polyurethane Infusion Resins Transform Manufacturing Economics
Polyurethane infusion blends from Covestro and Dow lower viscosity, shorten cure cycles by up to one-quarter and yield higher fiber volume fractions, enabling manufacturers to raise throughput without sacrificing fatigue performance. Vestas has already validated the chemistry in production, delivering millions of meters of polyurethane-based laminates for blades in China. Closed-injection pultrusion of carbon spar caps and temperature-controlled molding for thick laminates extend polyurethane’s reach to increasingly complex blade geometries. These capabilities cut per-unit costs and help the wind turbine composites market meet rising demand for ever-longer rotors.
Bio-based Thermoplastic Systems Enable Circular-Economy Transition
NREL’s sorbitol-derived PECAN resin lowers greenhouse-gas output by 40% compared with traditional epoxies and can be depolymerized to recover fibers for reuse, addressing Europe’s strict blade-waste rules. The ZEBRA project’s 62 m fully recyclable thermoplastic blade confirms industrial feasibility and attracts ESG-oriented investors that now scrutinize end-of-life strategies. Westlake’s EpoVIVE formulations and Arkema’s Elium resin widen the palette of circular solutions, while Airbus’ power-to-X composite concept hints at carbon-negative feedstocks. Such advances position recyclable systems as strategic differentiators in the wind turbine composites market.
Restraints Impact Analysis of Wind Turbine Composite Materials Market*
| Restraints | (≈) % Impact on CAGR Forecast | Geographic Relevance | Impact Timeline |
|---|---|---|---|
| Carbon-fiber price and supply volatility | -1.2% | Global; most acute in premium applications | Short term (≤ 2 years) |
| Upcoming BPA and styrene emission limits | -0.8% | North America and EU | Medium term (2-4 years) |
| Skilled-labor deficit in advanced infusion | -0.6% | Emerging Asia Pacific, Latin America and parts of EU | Long term (≥ 4 years) |
| Source: Mordor Intelligence | |||
Carbon Fiber Price Volatility Constrains Premium Applications
Surging demand for 100 m-plus blades is expected to triple carbon consumption by 2027, yet capacity expansions lag, creating price spikes that discourage wider uptake in cost-sensitive turbines. China’s market, which absorbed 69,000 t of carbon fiber in 2023, saw sharp swings as export restrictions and geopolitical frictions disrupted supply chains. OEMs, therefore, pursue hybrid glass-carbon architectures and localized sourcing to hedge volatility. Until additional lines lift global output toward the 450,000 tons predicted for 2030, the wind turbine composites market must navigate erratic input costs.
Regulatory Emission Limits Drive Manufacturing-Process Transformation
The United States EPA now caps hazardous air pollutants from reinforced-plastic facilities, forcing a pivot to closed molding and low-VOC resins that inflate capital budgets but ensure compliance[2]U.S. Department of Energy, “Wind Supply Chain Roadmap,” energy.gov. In Europe, circular-economy mandates intensify pressure to switch away from styrene-rich chemistries and to document recycling pathways, while OSHA continues workplace-safety crackdowns on styrene exposure in blade shops. Investments in automated infusion cells, emission-capture systems, and hybrid resin lines are therefore imperative across the wind turbine composites market.
*Our forecasts treat driver/restraint impacts as directional, not additive. The impact forecasts reflect baseline growth, mix effects, and variable interactions.
Wind Turbine Composite Materials Market Segment Analysis
By Fiber Type:
Carbon Drives Premium-Performance EvolutionGlass fiber retained a dominant 71.10% share of the wind turbine composites market in 2025, underpinned by favorable cost and robust supply chains. Carbon, however, is growing at 6.85% CAGR as OEMs chase mass reductions that let longer rotors survive higher tip speeds without excess loads. LM Wind Power’s hybrid carbon/glass spar caps on its 88.4 m blade validated weight cuts without cost blowouts.
Incremental uptake also stems from textile-based carbon fibers that are 40% cheaper than aerospace grades, unlocking mid-tier turbine segments. Natural-fiber blends offer sustainable niches, with palm or flax hybrids matching key mechanical metrics while lowering embodied energy. Over the forecast horizon, hybridization strategies will remain pivotal as the wind turbine composites market balances stiffness, fatigue life and affordability.



By Resin Type:
Polyurethane Challenges Epoxy DominanceEpoxy systems held 34.40% revenue share in 2025, thanks to well-characterized performance, yet polyester/vinyl-ester and polyurethane blends are tracking the fastest 7.12% CAGR. Proven 10-25% cycle-time savings and improved wet-out make polyurethane infusion the prime candidate for stretching annual output without large capex.
Demand for bio-based chemistries that curb life-cycle emissions by 30-40% will steer formulation research and development, broadening the wind turbine composites market size for greener resins, particularly in Europe, where carbon-footprint disclosures already feature in tenders. Baxxodur curing agents and additive packages that cut exotherm peaks further enhance epoxy competitiveness, ensuring multiple resin classes co-exist through 2031.
By Technology:
Prepreg Advances Challenge Vacuum-Infusion LeadershipVacuum infusion captured 45.30% of the wind turbine composites market share in 2025 due to its scalability for 100 m-class blades. Prepreg throughput, however, will climb 7.38% per year as tighter tolerances on thick spar caps and complex aerodynamic surfaces demand quasi-void-free laminates. Hexcel’s fast-cure HexPly M19 shrinks oven cycles by up to 20%, helping large-scale prepreg plants in Europe and China contend with cost pressures.
By Application:
Blade Innovation Anchors Revenue ConcentrationBlades represented 74.20% of the wind turbine composites market in 2025 and will continue at a 7.14% CAGR as swept-area expansion is the most powerful lever for higher energy yield. Vestas’ 43,000 m² swept area confirms the volume opportunity, with each 115 m blade containing more than 70 t of composite laminate.
Specialized parts such as spinners, tower fairings, and internal platforms account for modest volumes but remain value-added due to complex tooling and tight dimensional tolerances. Continued research and development into stitched 3-D preforms that slash root assembly time to 10 minutes illuminates how the wind turbine composites market keeps refining cost and structural margins simultaneously.
Geography Analysis
APAC Wind Turbine Composite Materials Market
Asia Pacific, at 46.10% of 2025 revenue, remains the anchor region for the wind turbine composites market and posts a leading 6.72% CAGR. China’s record 117 GW of 2024 additions, supported by local-content rules favoring China Jushi and CPIC, underpin an unrivaled supply-chain footprint that exports both raw fabrics and finished blades worldwide.
Europe Wind Turbine Composite Materials Market
Europe follows with mature technology adoption and rigorous sustainability regulations. The United Kingdom’s ambition to reach up to 50 GW of offshore wind by 2030, Germany’s 80% clean-power target, and France’s circular-economy mandates push European makers toward recyclable thermoplastics and closed molding.
North America Wind Turbine Composite Materials Market
North America couples federal tax credits with state procurement to expand onshore fleets in the Great Plains and repower coastal wind zones. The U.S. Department of Energy forecasts composite demand tripling by 2027, propelling investments from TPI Composites and GE Vernova that localize spar-cap and root-insert production.

Value Chain Analysis
The wind turbine composites value chain starts with upstream feedstocks and intermediates such as glass and carbon fibers, resin systems (epoxy, polyester/vinyl-ester, polyurethane, and emerging thermoplastics), plus cores and additives. It then moves into fabric and preform making, resin formulation, and blade manufacturing using vacuum infusion, prepreg processing, and pultrusion-based spar-cap routes. OEMs and blade makers increasingly manage qualification and continuity through named partnerships tied to specific commercial projects, including Swancor working with Siemens Gamesa and RWE to deploy recyclable epoxy-based blades at scale for the Sofia offshore wind farm, linking resin supply, blade manufacturing, and project delivery requirements.
Midstream blade production, finishing, and logistics are also shaped by localization efforts and trade policy. In Europe, the EU Net Zero Industry Act positions wind as part of the net-zero technology value chain, and it has been used by industry groups to estimate upstream material needs tied to manufacturing scale-up, including an annual manufacturing target of 36 GW linked to incremental demand of 160,000 MT for glass fibers and fabrics, 70,000 MT for resins, and 22,000 MT for cores. On the input side, the European Commission imposed definitive anti-dumping duties on imports of glass fibre yarns from China through Implementing Regulation (EU) 2025/501 (18 March 2025), with duty rates ranging from 26.3% to 56.1%, which affects sourcing strategies for a key reinforcement input and increases incentives to diversify or localize supply for blade components.
Competitive Landscape
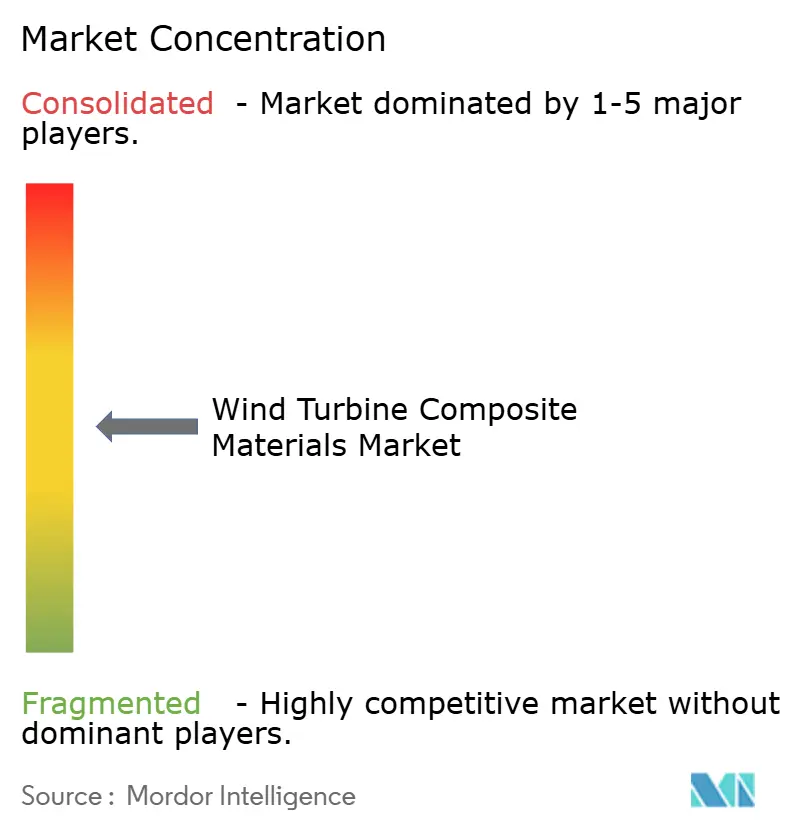
The wind turbine composites market shows moderate fragmentation around global blade specialists, fiber producers, and integrated turbine OEMs. Material suppliers such as Hexcel, Toray, and Owens Corning pursue long contracts with OEMs, co-developing low-void prepregs and high-modulus glass fabrics. Digital-twin platforms, embedded fiber-optic sensors and automated kitting solutions round out competitive toolkits, permitting life-cycle monitoring that reduces maintenance costs.
Wind Turbine Composite Materials Industry Leaders
LM WIND POWER
Siemens AG
TPI Composites
Vestas
Zhongfu Lianzhong Group
- *Disclaimer: Major Players sorted in no particular order
Wind Turbine Composite Materials Market Companies Covered in this Report
- AVIC Huiteng Windpower
- BASF
- China Jushi Co., Ltd.
- Covestro AG
- Exel Composites
- Gurit Holding AG
- Hexcel Corporation
- INCA Renewtech
- Lianyungang Zhongfu Lianzhong Composite Material Group Co., Ltd
- LM WIND POWER
- Molded Fiber Glass Companies
- Owens Corning
- Reliance Industries Limited
- SGL Carbon
- Siemens AG
- Sinoma Science & Technology Co.,Ltd.
- Teijin Limited
- TORAY INDUSTRIES, INC.
- TPI Composites
- Vestas
- Zhongfu Lianzhong Group

Market Opportunities and Future Outlook
Circularity requirements are creating whitespace for recyclable resin systems, thermoplastic blades, and documented recycling routes that can be used in procurement and compliance documentation. Implementing Regulation (EU) 2026/718, effective from 30 June 2026, requires rotor blades of onshore and offshore wind turbines to meet a minimum 70% recycling rate by mass, which pushes OEMs and material suppliers to qualify chemistries and processes that support recoverability at scale. Implementation is showing up in offshore deployments such as the Sofia offshore wind farm, where Swancor, Siemens Gamesa, and RWE have supported large-scale deployment of recyclable blade technology, helping move recyclable thermoset solutions from pilot activity into commercial supply chains.
Outside the EU, policy and standards also support end-of-life and secondary-material opportunities. China implemented GB/T 45195-2024 on 31 December 2024, setting standards for the collection, treatment, and disposal of waste fiber composite materials from wind turbines, which supports more structured downstream handling of composite waste and recycled-fiber utilization. On the technology pipeline, EU-backed and academic programs are expanding material options for blade circularity and repairability, including REFRESH demonstrating new blade manufacturing using recycled glass fibers recovered from decommissioned blades, and vitrimer-based formulations validated for blade production within the EOLIAN project. This work supports routes for suppliers to industrialize recycled-fiber feedstock, low-VOC formulations, and repairable or reprocessable resin systems suited for high-throughput blade manufacturing.
Recent Industry Developments in Wind Turbine Composite Materials Market
- July 2026: TPI Composites completed its financial restructuring and emerged from Chapter 11 under the ownership of Energy Capital Partners. The transaction resets the company’s capital structure and supports continued participation as a large independent blade manufacturer supplying wind OEM programs across multiple regions.
- September 2025: GE Vernova completed the sale of its onshore wind blade factory in Goleniów, Poland, to Vestas. The transfer shifts European blade manufacturing capacity between major industry players and supports tighter vertical integration around a leading turbine OEM’s blade supply chain.
- January 2024: TPI Composites and GE Vernova expanded their contract in Mexico, adding production lines at the Juarez campus to supply the US market. The agreement strengthens regionalized blade manufacturing and reinforces North American supply continuity for high-volume blade platforms.


Wind Turbine Composite Materials Market Report Scope and Research Methodology
Market Definition and Coverage
For this study, the wind turbine composite materials market is measured as the revenue generated from composite materials supplied for manufacturing wind turbines, mainly for structural parts where strength-to-weight performance is critical.
Scope exclusions: it excludes composite tooling, repair-only kits, and composites used outside wind power applications.
Segments Covered in This Report
- By Fiber Type
- Glass Fiber
- Carbon Fiber
- Natural/Hybrid Fibers
- By Resin Type
- Epoxy
- Polyester/Vinyl-Ester
- Polyurethane
- Thermoplastic Resins
- By Technology
- Vacuum Infusion
- Prepreg
- Hand Lay-up
- Filament Winding / Pultrusion
- By Application
- Wind Blades
- Nacelles and Nose Cones
- Hubs, Covers and Ancillary Parts
- By Geography
- Asia-Pacific
- China
- India
- Japan
- South Korea
- ASEAN
- Rest of Asia-Pacific
- North America
- United States
- Canada
- Mexico
- Europe
- Germany
- United Kingdom
- France
- Italy
- Spain
- Rest of Europe
- South America
- Brazil
- Argentina
- Rest of South America
- Middle-East and Africa
- Saudi Arabia
- United Arab Emirates
- South Africa
- Egypt
- Rest of Middle-East and Africa
- Asia-Pacific
Data Sources, Market Sizing, and Validation
Desk Research
Desk work started by mapping the wind build pipeline and the physical drivers that pull composite demand. We referenced public sources such as IEA wind statistics, IRENA renewable capacity databases, Global Wind Energy Council publications, US EIA power data, and UN Comtrade trade codes for glass fiber and carbon fiber related materials.
To connect industry activity to dollars, we also reviewed company annual reports, investor presentations, and credible press updates on blade plants, resin capacity, and offshore project awards. Where needed, internal paid subscriptions for company financials and intelligence, patent databases, and shipment-level import and export data were used to sanity check adoption and material innovation signals. These sources are illustrative, and other public and paid references were used during data collection, validation, and clarification.
Primary Interviews and Surveys
Primary work was used to confirm what composites are actually being specified and purchased, and how pricing and scrap rates move across onshore and offshore programs. We spoke with raw material suppliers, blade and nacelle component manufacturers, wind project stakeholders, and technical experts across APAC, EMEA, and the Americas, so assumptions from desk work could be challenged and tightened.
Distribution of primary research fieldwork respondents
| Company type | Respondent position | Region |
|---|---|---|
| Top tier: 28% | CXOs: 17% | APAC: 47% |
| Mid tier: 52% | Functional/Unit leaders: 35% | EMEA: 31% |
| Smaller Players: 20% | Managers: 48% | Americas: 22% |
Market-Sizing & Forecasting
Sizing was built by reconstructing demand from wind installations and the average composite content per turbine, then converting that demand into value using region-specific price assumptions. The top-down approach used yearly additions in MW, typical rotor diameter and blade length progression, onshore versus offshore mix, and fiber and resin intensity per blade set, which were converted into USD using blended composite pricing.
To keep the model grounded, we cross-checked with selective bottom-up approximations, such as supplier volume signals, a sampled ASP times volume build for key material families, and channel checks on procurement cycles. When gaps appeared, we used closest-available proxy indicators like blade factory utilization and import trends, then reviewed those adjustments with interview feedback.
For forecasting, scenario analysis was used around wind commissioning timing and offshore project slippage, since these two items swing composite purchasing in a visible way. Pricing assumptions were adjusted for expected shifts in glass versus carbon usage, resin system changes, and manufacturing yield improvements that industry respondents repeatedly highlighted.
Data Validation & Update Cycle
Outputs were validated by comparing implied composite consumption against independent signals like annual wind additions, blade production activity, and fiber and resin trade movement, then checking whether the story stayed consistent by region. Variance checks were run when a country or application moved faster than the project pipeline suggested, and those exceptions were re-tested through follow-up calls.
Before sign-off, the model and key assumptions go through more than one analyst review to remove calculation errors and inconsistent definitions early. Reports are refreshed annually, and interim updates are triggered when major policy changes, large offshore auction outcomes, or step-changes in blade manufacturing capacity materially affect demand. Right before delivery, a final pass is completed so clients receive the most current view available at that time.
Mordor Intelligence's Wind Turbine Composite Materials Market Size Compared Against Other Published Estimates
Published numbers for this market do not always match because the counted scope and the year reference point can shift, even when the titles look the same. Differences also come from how firms treat composite content per turbine, offshore versus onshore weighting, and how quickly pricing is allowed to normalize after supply chain tightness.
The main gap comes from whether the estimate is anchored to installation-driven material intensity or to a broader composites spending view. In Mordor Intelligence's model, the total is tied to wind additions and composite content assumptions by turbine type before being priced in USD using region-aligned inputs.
Benchmark comparison
| Source | Market Size | Gaps in Research Methodology |
|---|---|---|
| Mordor Intelligence | USD 14.26 B (2026) | |
| Global Consultancy A | USD 15.42 B (2025) | Uses a different base year and forecast window, and the definition appears to cover a wider composites basket by application, which can lift totals when non-blade composite spending is counted more fully. |
| Industry Publisher B | USD 14.20 B (2024) | Anchors the value to a 2024 base year and applies a faster growth path, which can widen the estimate if offshore ramp-up and price recovery are assumed earlier than what project timing supports. |
Taken together, the spread is mostly explained by scope choices, base-year alignment, and how composite intensity and pricing are handled as turbines scale up. By keeping the build tied to observable wind additions and by validating intensity and pricing assumptions through interviews and cross-check signals, the resulting market value stays traceable to clear variables and can be replicated with the same steps.


Key Questions Answered in the Report
What is the current value of the wind turbine composites market?
The wind turbine composites market was valued at USD 14.26 billion in 2026 and is projected to reach USD 19.11 billion by 2031, reflecting a 6.02% CAGR.
Which region leads the wind turbine composites market?
Asia Pacific led with 46.10% revenue share in 2025 and is also the fastest-growing region at 6.72% CAGR through 2031, driven primarily by China’s large-scale wind installations.
Which fiber type is growing fastest in wind turbine blades?
Carbon fiber is expanding at 6.85% CAGR as OEMs adopt hybrid carbon/glass spar caps to cut weight in blades longer than 100 m.
How are new resins improving blade manufacturing?
Polyurethane infusion resins reduce mold cycle times by up to 25% and improve fiber wet-out, increasing factory throughput while meeting fatigue-life requirements.
Why are recyclable thermoplastic composites gaining attention?
European circular-economy rules and ESG finance mandates are steering OEMs toward thermoplastic systems like Elium or bio-based PECAN that enable full material recovery at end of life.
Page last updated on:


 Your data is secure and never sold or shared.


