Wavefront Aberrometer Market Size and Share
Market Overview
| Study Period | 2020 - 2031 |
|---|---|
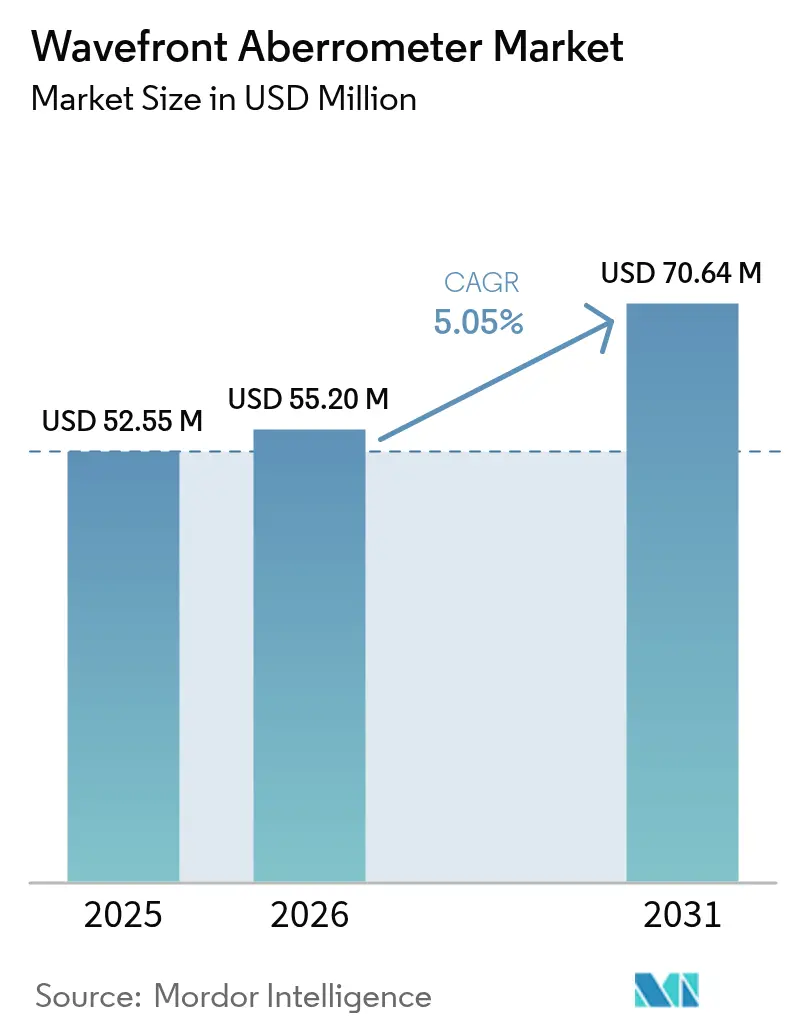
| Market Size (2026) | USD 55.2 Million |
| Market Size (2031) | USD 70.64 Million |
| Growth Rate (2026 - 2031) | 5.05% CAGR |
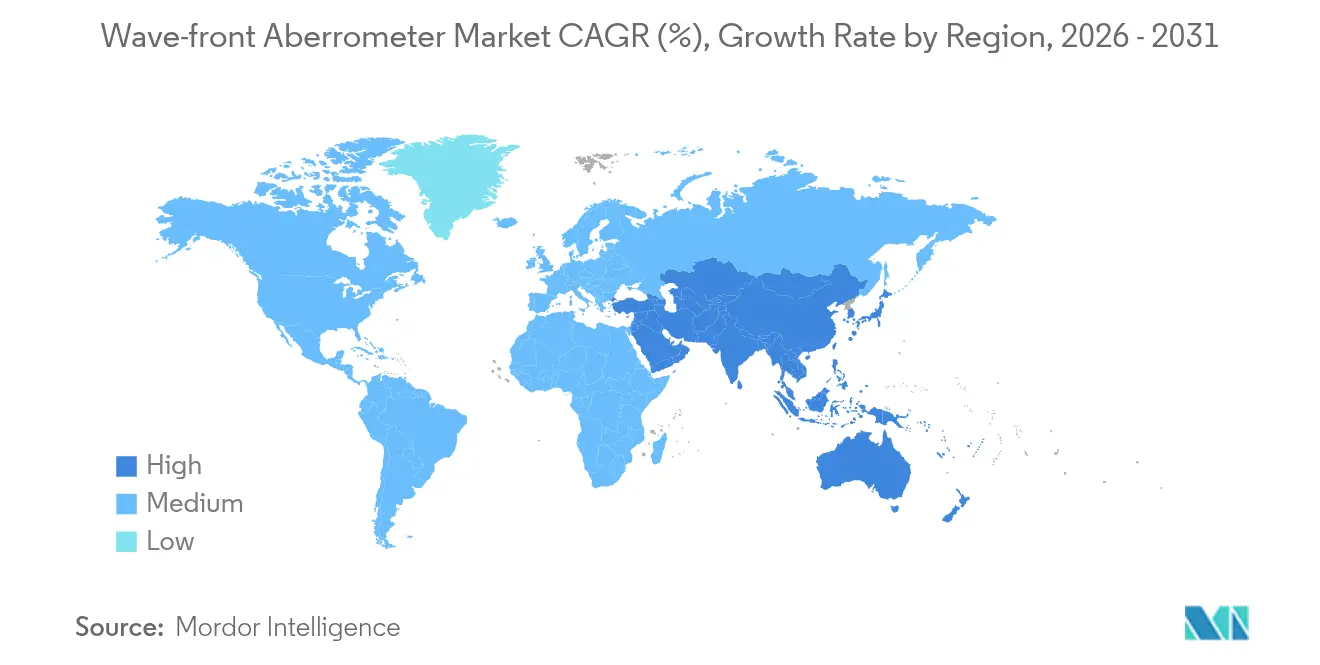
| Fastest Growing Market | Asia Pacific |
| Largest Market | North America |
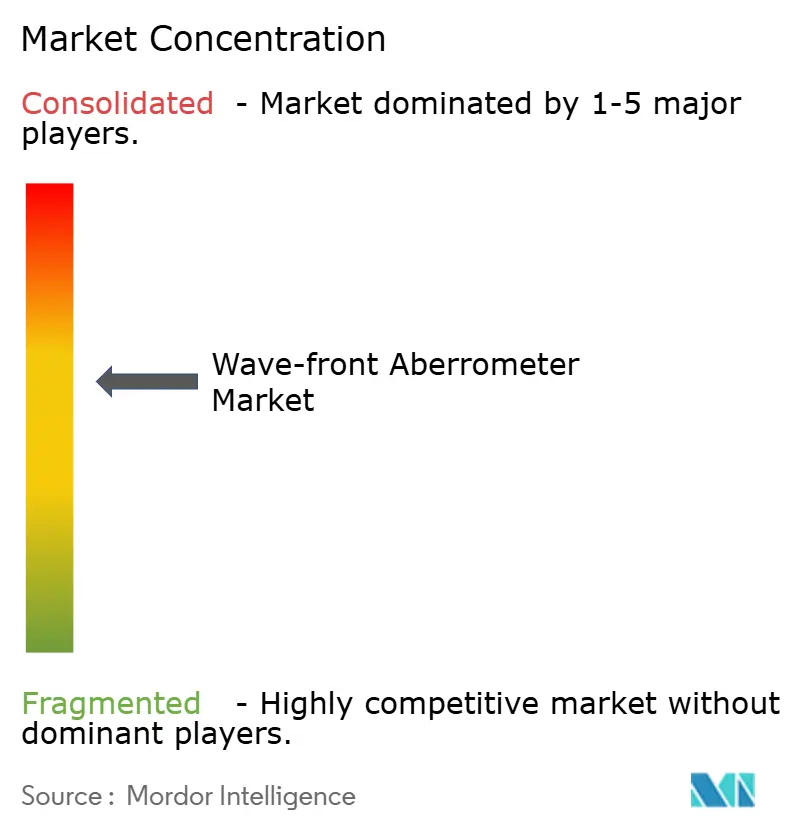
| Market Concentration | Medium |
Major Players *Disclaimer: Major Players sorted in no particular order Image © Mordor Intelligence. Reuse requires attribution under CC BY 4.0. | |
Wavefront Aberrometer Market Analysis by Mordor Intelligence
The Wavefront Aberrometer market size is expected to grow from USD 52.55 million in 2025 to USD 55.2 million in 2026 and is forecast to reach USD 70.64 million by 2031 at 5.05% CAGR over 2026-2031.
Adoption is propelled by artificial-intelligence diagnostics, wider intra-operative aberrometry use in premium intraocular lens (IOL) procedures, and the convergence of wavefront-guided LASIK with topography-integrated systems, which together expand diagnostic scope beyond simple refraction. Accelerated uptake of portable units for outreach screening, rising procedure volumes in ambulatory settings, and consolidation moves by leading manufacturers also underpin growth. Countervailing pressures include Medicare’s 2.93% payment reduction for 2025 and shortages of technicians skilled in advanced diagnostics.
Key Report Takeaways
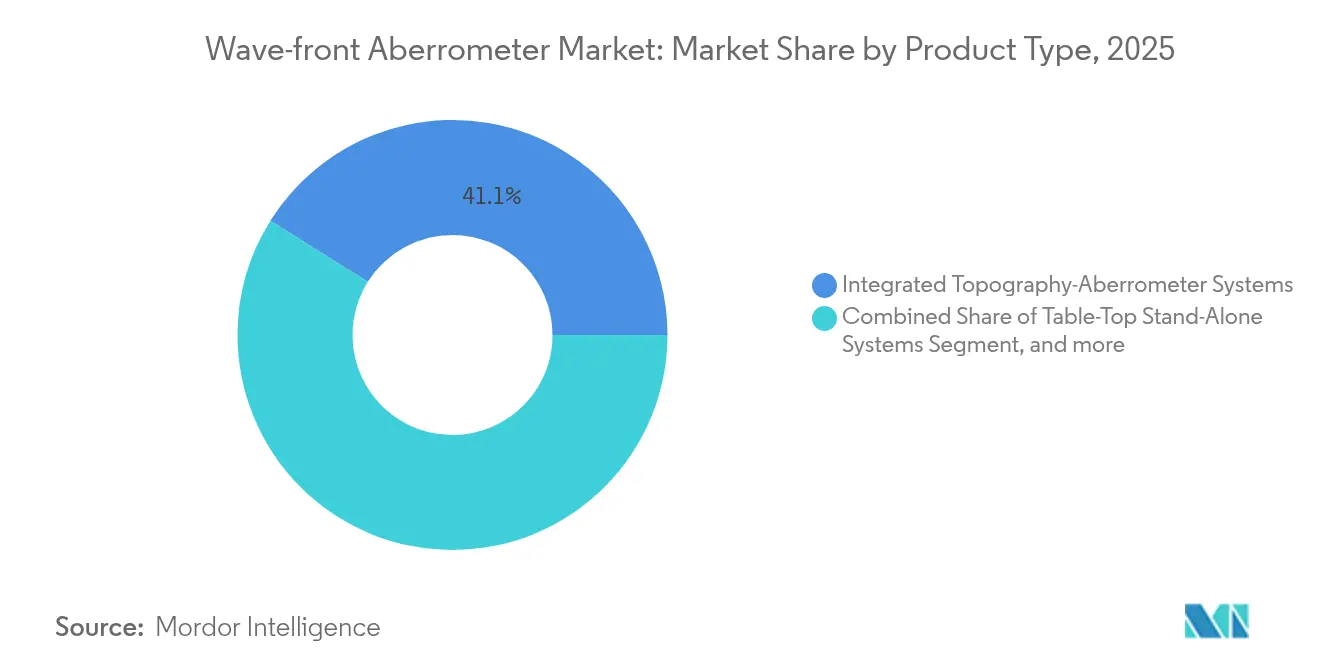
- By product type, integrated topography-aberrometer systems led with 41.08% revenue share in 2025, while intra-operative aberrometers are advancing at a 7.02% CAGR through 2031.
- By application, myopia correction held 55.10% of the wavefront aberrometer market share in 2025, whereas presbyopia applications are set to expand at 6.65% CAGR to 2031.
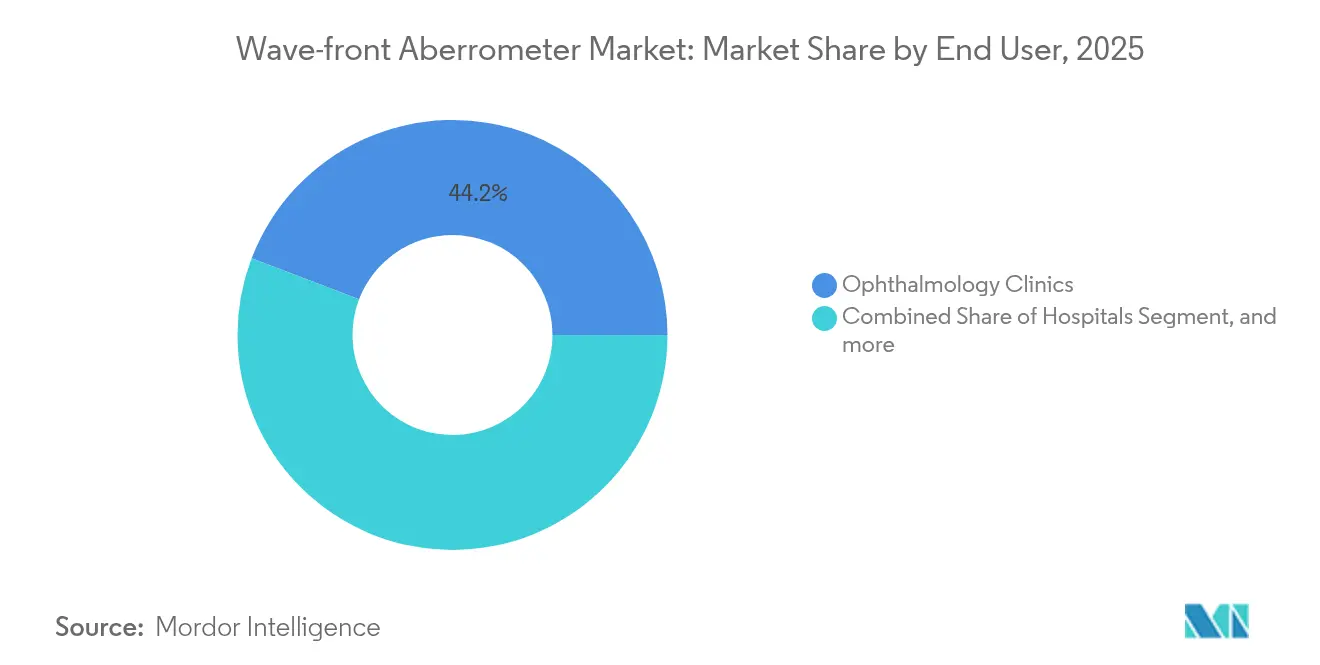
- By end user, ophthalmology clinics maintained a 44.20% share of the wavefront aberrometer market in 2025; ambulatory surgery centers showed the fastest growth at a 6.31% CAGR.
- By geography, North America captured 35.40% of the wavefront aberrometer market in 2025, while Asia-Pacific is poised for 8.78% CAGR through 2031.
Note: Market size and forecast figures in this report are generated using Mordor Intelligence’s proprietary estimation framework, updated with the latest available data and insights as of 2026.
Global Wavefront Aberrometer Market Trends and Insights
Drivers Impact Analysis*
| Driver | (~) % Impact on CAGR Forecast | Geographic Relevance | Impact Timeline |
|---|---|---|---|
| Growing Global Prevalence of Uncorrected Refractive Errors | +1.2% | Global, with concentrated impact in Asia-Pacific and Latin America | Long term (≥ 4 years) |
| Surge In Adoption of Wavefront-Guided LASIK And Premium Cataract Procedures | +1.8% | North America & Europe core, expanding to Asia-Pacific | Medium term (2-4 years) |
| Advancements in AI-Powered, Topography-Integrated Aberrometers | +0.9% | Global, with early adoption in developed markets | Short term (≤ 2 years) |
| Rising Use of Intra-Operative Aberrometry to Optimize Intraocular Lens (IOL) | +1.1% | North America & Europe, selective adoption in Asia-Pacific | Medium term (2-4 years) |
| Expansion of Portable Aberrometer Solutions Enabling Remote Diagnostics | +0.7% | Global, with pronounced impact in underserved regions | Medium term (2-4 years) |
| Increased Demand for Precise Ocular Calibration In AR/VR Headsets | +0.4% | North America & Asia-Pacific, emerging in Europe | Long term (≥ 4 years) |
| Source: Mordor Intelligence | |||
Growing Global Prevalence of Uncorrected Refractive Errors
Half of the world population may be myopic by 2030, with Asia-Pacific carrying the greatest burden.[1]Maria Raposo-Mocholi et al., “Global Prevalence of Myopia: 2025 Update,” MDPI, mdpi.com Governments respond by funding early-screening drives where portable devices such as handheld aberrometers identify refractive errors in schools and rural clinics. AI modules now deliver 88% sensitivity and 94% specificity in flagging abnormal wavefront profiles, trimming chair-time, and widening access. Population-level productivity gains further justify public investment, enlarging the wavefront aberrometer market. Vendors that bundle cloud analytics with low-footprint hardware gain an edge in mass-screening contracts.
Surge in Adoption of Wavefront-Guided LASIK and Premium Cataract Procedures
Wavefront-guided refractive surgery routinely delivers 20/40 vision or better in 99.7% of patients, outperforming conventional techniques. Patient willingness to pay for quality upgrades boosts demand for high-accuracy diagnostics. FDA clearance of Bausch + Lomb’s TENEO laser in late 2023 renewed competitive intensity, spotlighting systems that seamlessly integrate aberrometry, eye tracking, and topography. In the wavefront aberrometer market, this translates into higher per-procedure throughput because real-time wavefront data speeds lens-power confirmation. Premium IOL packages, often paid out-of-pocket, thus finance device upgrades despite tighter insurer reimbursements.
Advancements in AI-Powered, Topography-Integrated Aberrometers
Machine-learning models now predict corneal ectasia in subclinical stages, achieving an area-under-curve score of 0.945 in multicenter trials. Software suites such as iTrace Prime generate new indices that quantify quality of vision, giving surgeons richer decision support. Cloud processing reduces workstation hardware costs and permits remote second opinions, letting regional clinics access tertiary-level analytics. In the near term, these capabilities differentiate high-tier products; over time they will become table stakes across the wavefront aberrometer market.
Rising Use of Intra-Operative Aberrometry to Optimize IOL Choice
Systems like ORA and HOLOS deliver live readings that cut postoperative residual astigmatism ≤ 0.50 D in 92.8% of eyes, versus 58.3% when surgeons rely on pre-operative formulas alone. The benefit is greatest in toric, multifocal, and post-LASIK cases where conventional calculations fail. Real-time feedback also shortens revision rates, supporting outpatient cataract pathways that are central to ambulatory-surgery growth in the wavefront aberrometer market.
Restraints Impact Analysis*
| Restraint | (~) % Impact on CAGR Forecast | Geographic Relevance | Impact Timeline |
|---|---|---|---|
| High Capital Investment and Per-Procedure Costs | -0.8% | Global, with pronounced impact in emerging markets | Long term (≥ 4 years) |
| Shortage of Skilled Ophthalmic Technicians Trained in Wavefront Diagnostics | -0.6% | North America & Europe, emerging in Asia-Pacific | Medium term (2-4 years) |
| Reimbursement Ambiguity Surrounding Intra-Operative Aberrometry Codes | -0.5% | North America & Europe, limited impact in Asia-Pacific | Short term (≤ 2 years) |
| Lack of Standardized Data Formats Impedes Seamless Integration | -0.3% | Global, with varying impact across healthcare systems | Medium term (2-4 years) |
| Source: Mordor Intelligence | |||
High Capital Investment and Per-Procedure Costs
Integrated topography-aberrometers list above USD 200,000, while consumables add USD 50–100 per measurement.[2]American Academy of Ophthalmology, “Economic Considerations in Diagnostic Equipment Purchasing,” aao.org Small clinics in cost-sensitive regions struggle to justify these outlays, delaying refresh cycles even as technology leaps ahead. Leasing and pay-per-use models mitigate the hurdle, but margin compression remains real, especially after a 2.93% Medicare cut in 2025.[3]Centers for Medicare & Medicaid Services, “CY 2025 Physician Fee Schedule Final Rule,” cms.gov Until device prices fall or reimbursement improves, spending restraint will temper the wavefront aberrometer market trajectory.
Shortage of Skilled Ophthalmic Technicians Trained in Wavefront Diagnostics
Advanced aberrometry demands operators competent in aligning patients, interpreting higher-order aberrations, and troubleshooting AI workflows. Few accredited programs offer the 700-plus clinical hours needed for certification, creating a talent bottleneck. Clinics often cross-train staff, but the learning curve slows throughput and may discourage equipment investment. Vendors respond with guided user interfaces, yet human expertise remains critical to realize full diagnostic value.
*Our forecasts treat driver/restraint impacts as directional, not additive. The impact forecasts reflect baseline growth, mix effects, and variable interactions.
Segment Analysis
By Product Type: Integrated Systems Drive Innovation
Integrated topography-aberrometer systems accounted for 41.08% of the wavefront aberrometer market in 2025, reflecting clinician preference for single-platform corneal mapping and wavefront measurement. These units bundle Placido-disc topography with Hartmann-Shack sensors, letting surgeons refine ablation profiles and IOL power selections without switching devices. Table-top standalone systems still serve high-volume refractive practices where workflow efficiency outweighs multi-modality. Intra-operative aberrometers, although currently smaller in revenue, register a 7.02% CAGR because premium cataract surgeons require live feedback. The handheld sub-segment remains nascent but attracts telehealth programs and military medicine, particularly since forthcoming devices promise sub-USD 15,000 entry pricing that broadens the wavefront aberrometer industry customer base.
In competitive terms, integrated platforms now compete on software depth more than optical hardware. Firms adding biomechanics analytics or predictive AI secure premium price points. Meanwhile, modular architectures let clinics begin with diagnostics and later bolt on surgical guidance tools, easing capital budgeting. As cloud processing offloads computation, lightweight consoles could democratize advanced aberrometry across secondary-tier hospitals, raising the ceiling for the wavefront aberrometer market.


By Application: Presbyopia Acceleration Reshapes Demand
Myopia correction held 55.10% of the wavefront aberrometer market share in 2025. However, presbyopia is the fastest-rising application, advancing 6.65% annually as aging populations seek spectacle-free vision. Extended-depth-of-focus IOLs rely on precise spherical aberration management; thus, presbyopia’s rise directly boosts the wavefront aberrometer market. Astigmatism correction benefits from toric IOL precision, and keratoconus screening leverages higher-order maps coupled with biomechanical indices. Hyperopia remains a stable niche but gains from enhanced energy-profile algorithms embedded in next-generation platforms.
Diagnostic breadth also expands into virtual-reality headset calibration, sports vision, and occupational safety testing. These adjacent uses may not yet move headline numbers, but they diversify revenue and mitigate reliance on elective surgery cycles. Vendors that pre-configure application-specific software kits strengthen stickiness and generate recurring license fees, a pattern likely to persist across the wavefront aberrometer industry.
By End User: Ambulatory Centers Gain Momentum
Ophthalmology clinics generated 44.20% of the wavefront aberrometer market size in 2025. They remain anchors for pre-operative assessment and long-term follow-up, explaining their durability. Yet ambulatory surgery centers (ASCs) show 6.31% CAGR as outpatient refractive and cataract volumes migrate to cost-efficient settings. ASCs favor compact intra-operative units that slot into streamlined OR workflows and minimise patient transfer delays. Hospitals continue to purchase comprehensive suites for complex revisions and teaching labs, but growth is modest. Academic and research institutes, while small in revenue, drive breakthrough features that later filter into commercial models, sustaining the innovation cycle inside the wavefront aberrometer market.
Tele-optometry networks increasingly contract mobile technicians equipped with portable aberrometers, introducing a service-based revenue layer. Software as a Service (SaaS) dashboards enable multi-site practices to benchmark outcomes, nudging clinics toward standardised equipment ecosystems. Collectively, these trends re-shape purchasing criteria from pure hardware specs to total-cost-of-ownership evaluations that integrate maintenance, analytics, and staff training.
Geography Analysis
North America retained 35.40% of global revenue in 2025, or nearly USD 18.6 million of the wavefront aberrometer market size, thanks to entrenched reimbursement codes and high patient willingness to pay for premium IOLs. The region’s regulatory clarity, illustrated by smooth FDA clearance pathways for new excimer lasers, supports continual product refresh. Headwinds include Medicare’s 2025 rate cut, which pressures smaller practices to seek leasing over outright purchase. Consolidation among corporate practice groups may offset some strain by pooling capital for fleet upgrades.
Asia-Pacific posts the fastest regional expansion at 8.78% CAGR, adding USD 7.05 million incremental revenue by 2031. China’s streamlined National Medical Products Administration timelines and the Boao Lecheng fast-track zone slash approval lags, letting overseas-cleared aberrometers reach market early. India’s fresh device-marketing code, coupled with rising private-equity investment in eye-care chains, unlocks buying power. Japan and South Korea, already technologically advanced, lead AI module adoption, reinforcing the premium tier of the wavefront aberrometer market.
Europe shows mature yet steady demand, buoyed by evidence-based practice standards and national health insurance that reimburse functional improvements for cataract and refractive patients. EssilorLuxottica’s regional roll-up of clinics and Heidelberg Engineering assets deepens integration between diagnostics and therapy, potentially moving procurement toward closed-platform ecosystems . Emerging regions Middle East & Africa plus South America offer upside as private hospitals upgrade imaging suites; however, currency volatility and limited reimbursement temper near-term scale.

Competitive Landscape
The wavefront aberrometer market is moderately consolidated. Alcon, Carl Zeiss Meditec, Johnson & Johnson Vision, and EssilorLuxottica collectively exceed a higher revenue share. Each pairs hardware with proprietary software, locking in service contracts. Alcon’s USD 430 million acquisition of LENSAR extends its femtosecond laser franchise and folds intra-operative aberrometry deeper into its cataract platform. EssilorLuxottica’s buying spree, including Heidelberg Engineering, Optegra clinics, and Cellview Imaging, builds a vertically integrated eye-care ecosystem from retail to OR, tightening competitive pressure on stand-alone device makers.
Second-tier players innovate in portability and AI. Tracey Technologies’ iTrace line introduces cloud dashboards that small practices can deploy without hefty servers. Chinese manufacturers push value-priced handhelds tailored to school-screening programs, widening the geographic reach of the wavefront aberrometer market. Software-only entrants craft algorithms that retrofit onto existing cameras, threatening to commoditise optical hardware. In response, incumbents embed biomechanics analytics and machine-learning-driven surgical guidance to sustain differentiation.
Strategic alliances multiply: equipment vendors partner with tele-health platforms to offer integrated screening suites, while data-analytics firms bundle outcome benchmarking tools. Intellectual-property litigation remains rare but could rise as AI models become core competitive assets. Overall, rivalry is set to intensify yet remain innovation-led, preserving attractive gross margins for differentiated products.
Wavefront Aberrometer Industry Leaders
Luneau Technology
Carl Zeiss Meditec
NIDEK
EssilorLuxottica
Alcon
- *Disclaimer: Major Players sorted in no particular order

Recent Industry Developments
- May 2025: EssilorLuxottica announced the acquisition of Optegra clinics, expanding its medical technology portfolio beyond traditional eyewear into comprehensive eye care services. The acquisition includes over 70 eye hospitals and diagnostic facilities across multiple countries, creating an integrated platform for advanced diagnostic and surgical services that may drive aberrometry adoption in clinical settings.
- March 2025: Alcon agreed to acquire LENSAR Inc. for USD 430 million, including the ALLY Robotic Cataract Laser Treatment System and proprietary Streamline software. This acquisition enhances Alcon's femtosecond laser-assisted cataract surgery capabilities and expands intraoperative aberrometry applications for premium IOL procedures.
- February 2025: EssilorLuxottica completed the acquisition of Cellview Imaging, a developer of ophthalmic imaging devices, as part of its strategy to build a comprehensive medical technology ecosystem. The acquisition strengthens the company's diagnostic capabilities and may accelerate integration of aberrometry with other imaging modalities.
- December 2024: EssilorLuxottica announced the acquisition of Espansione Group, known for its non-invasive medical devices including Light Modulation Low-level Light Therapy and Intense Pulsed Light technology. The acquisition aligns with the company's med-tech expansion strategy and enhances its portfolio of eye care treatment options.
- November 2024: Avant Technologies and Ainnova Tech announced a partnership to develop a low-cost retinal camera integrated with AI-driven diagnostic software. The collaboration aims to make retinal screening as routine as blood pressure checks, potentially creating new applications for aberrometry in primary care settings.


Research Methodology Framework and Report Scope
Market Definitions and Key Coverage
Our study defines the wavefront aberrometer market as the annual sales value of diagnostic instruments that map ocular wavefront errors, covering table-top standalone units, integrated topography-aberrometer systems, and intra-operative devices used before or during refractive and cataract procedures, as well as for advanced contact-lens fitting. Measurements relate solely to new, factory-built equipment; associated software upgrades and consumables are included where explicitly bundled with the hardware.
Scope Exclusions: Conventional autorefractors, corneal topographers lacking wavefront capability, and refurbished or rental units sit outside this market's boundaries.
Segmentation Overview
- By Product Type
- Table-Top Stand-Alone Systems
- Integrated Topography–Aberrometer Systems
- Intra-Operative Aberrometers
- Hand-Held / Portable Aberrometers
- By Application
- Myopia
- Hyperopia
- Astigmatism
- Presbyopia
- Keratoconus & Ectasia
- Others
- By End User
- Hospitals
- Ophthalmology Clinics
- Ambulatory Surgery Centres
- Academic & Research Institutes
- By Geography
- North America
- United States
- Canada
- Mexico
- Europe
- Germany
- United Kingdom
- France
- Italy
- Spain
- Rest of Europe
- Asia-Pacific
- China
- Japan
- India
- Australia
- South Korea
- Rest of Asia-Pacific
- Middle East & Africa
- GCC
- South Africa
- Rest of Middle East & Africa
- South America
- Brazil
- Argentina
- Rest of South America
- North America
Detailed Research Methodology and Data Validation
Primary Research
Mordor analysts interviewed surgeons, biomedical engineers, and procurement heads across North America, Europe, and key Asia-Pacific hubs. Conversations validated install-base estimates, current utilization rates during LASIK and premium IOL procedures, and expected capital-budget shifts post-reimbursement changes. Insights from portable-device start-ups supplemented our understanding of emerging price bands.
Desk Research
In building the foundational dataset, we reviewed freely available vision-health sources such as the WHO's Vision Atlas, CDC's National Eye Disease Survey, Eurostat's hospital procedure files, and ophthalmic trade association shipment tallies. Company 10-Ks, FDA 510(k) summaries, and peer-reviewed articles in the Journal of Cataract & Refractive Surgery helped us benchmark typical selling prices and replacement cycles. Subscription resources including D&B Hoovers for manufacturer revenues and Dow Jones Factiva for product-launch news filled remaining information gaps. The sources cited above illustrate, but do not exhaust, the wider desk research pool consulted by our analysts.
Market-Sizing & Forecasting
A top-down demand-pool build starts with country-level refractive and cataract surgery volumes, which are then multiplied by observed device penetration per operating room. Results are cross-checked through selective bottom-up roll-ups of leading supplier shipments. Key variables in the model include average selling price movements, LASIK adoption trajectories, premium IOL mix, procedure reimbursement trends, and replacement-cycle length. Multivariate regression links these drivers to historical sales, allowing scenario-analysis overlays for technology uptake shocks. Where supplier data were partial, regional channel checks provided gap fillers before the model was locked.
Data Validation & Update Cycle
Outputs undergo variance screens against external shipment tallies and macro signals, followed by senior analyst peer review. Reports refresh every twelve months, with interim revisions triggered by material events such as regulatory fee cuts or landmark product launches. A last-mile check is performed just before publication so clients receive the latest view.
Why Mordor's Wave-front Aberrometer Baseline Earns Investor Confidence
Published estimates often diverge because firms choose different product mixes, currency conversions, and refresh cadences.
Key gap drivers include whether integrated diagnostic platforms are bundled, if handheld units are counted, and the level of price-erosion modeling applied; discrepancies widen further when some publishers extrapolate global totals solely from tier-one manufacturer disclosures.
Benchmark comparison
| Market Size | Anonymized source | Primary gap driver |
|---|---|---|
| USD 52.55 M (2025) | Mordor Intelligence | - |
| USD 142.9 M (2024) | Global Consultancy A | Includes broader diagnostic lasers; single-step top-down view |
| USD 745.26 M (2024) | Trade Journal B | Bundles multi-modal imaging suites and handheld refractors; lacks price-erosion curves |
| USD 37.4 M (2023) | Analytics Vendor C | Narrow scope on Hartmann-Shack devices; older base year, limited geography |
These comparisons show that when scope is precise, variables transparent, and forecasts refreshed annually, Mordor's balanced methodology supplies a dependable baseline for planning, budgeting, and investment analysis.


Key Questions Answered in the Report
What is the current value of the wavefront aberrometer market?
The wavefront aberrometer market is valued at USD 55.2 million in 2026 and is projected to reach USD 70.64 million by 2031.
Which product segment is growing fastest?
Intra-Operative Aberrometers record the highest growth at a 7.02% CAGR through 2031, driven by demand for real-time IOL power confirmation during cataract surgery.
Why is Asia-Pacific considered the most attractive growth region?
Regulatory streamlining, rising private healthcare investment, and high myopia prevalence push Asia-Pacific to a 8.78% CAGR, outpacing all other regions.
How do artificial-intelligence upgrades influence buying decisions?
AI modules enhance ectasia risk prediction and surgical planning accuracy, making integrated systems more compelling and encouraging clinics to refresh older equipment.
What are the main barriers to wider adoption of wavefront aberrometers?
High upfront costs, per-procedure consumable expenses, and a shortage of technicians skilled in advanced diagnostics remain key restraints.
How have reimbursement changes affected the market?
The 2.93% reduction in Medicare payments for 2025 pressures U.S. practices, prompting greater reliance on leasing and service-based procurement models to manage cash flow.
Page last updated on:


