Waterproofing Membranes Market Size and Share
Market Overview
| Study Period | 2021 - 2031 |
|---|---|
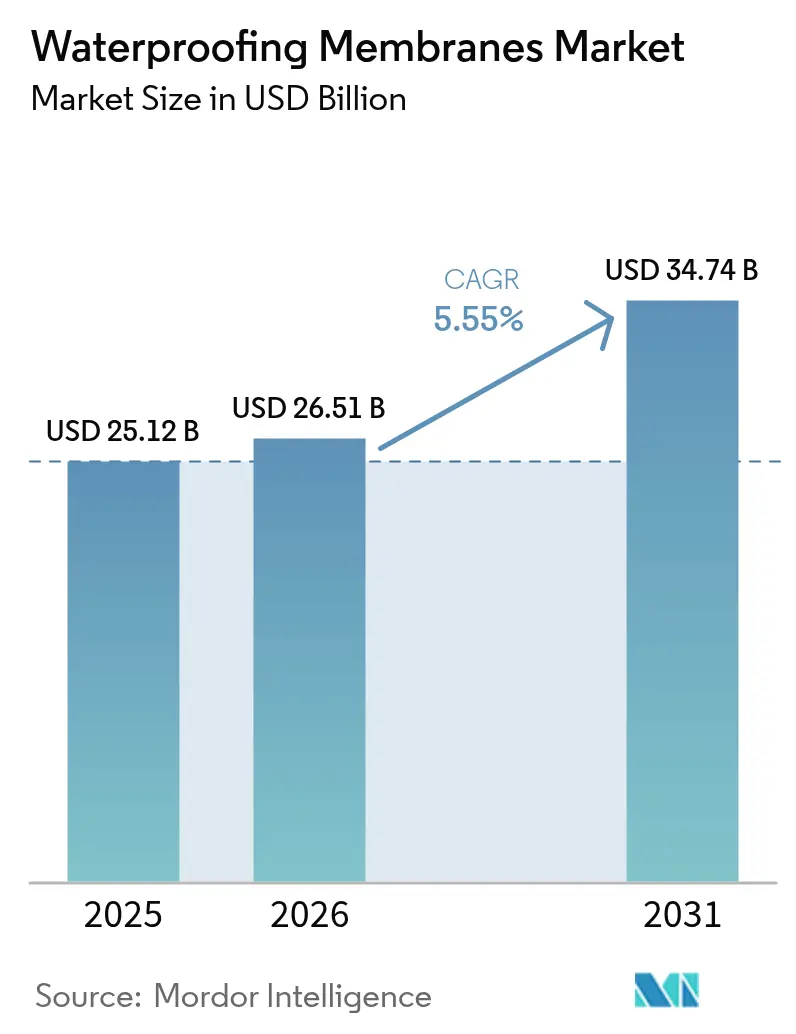
| Market Size (2026) | USD 26.51 Billion |
| Market Size (2031) | USD 34.74 Billion |
| Growth Rate (2026 - 2031) | 5.55% CAGR |
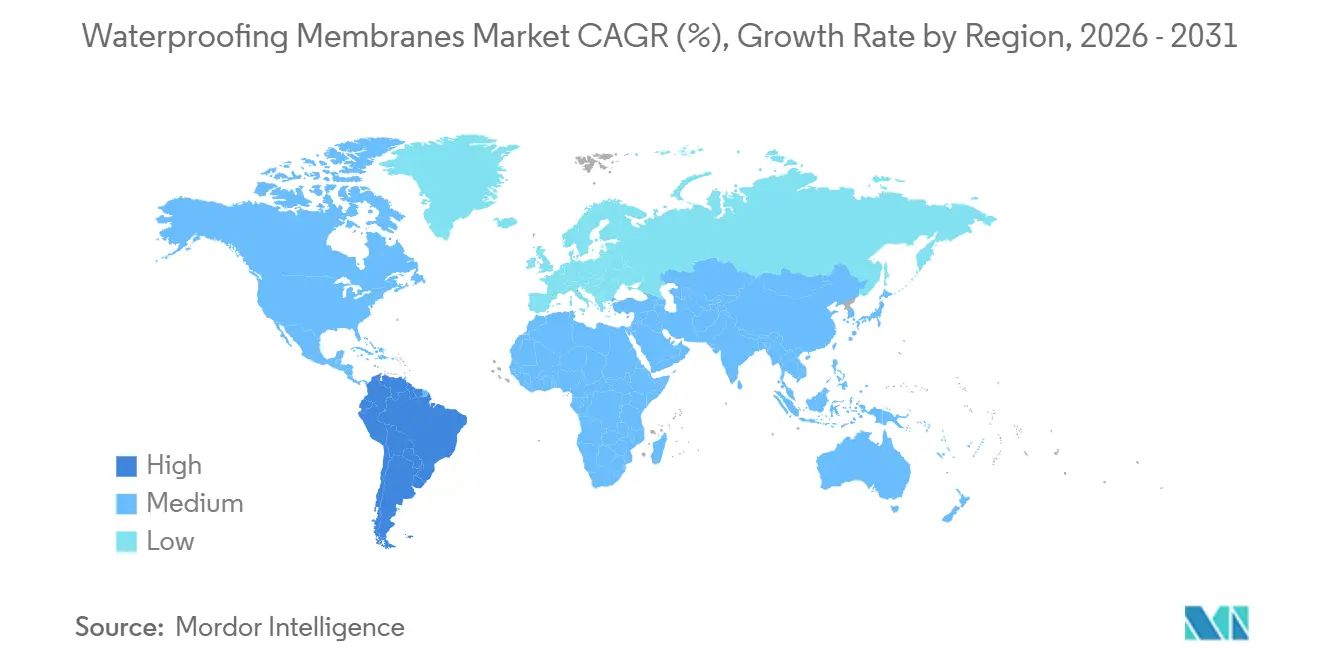
| Fastest Growing Market | South America |
| Largest Market | Asia Pacific |
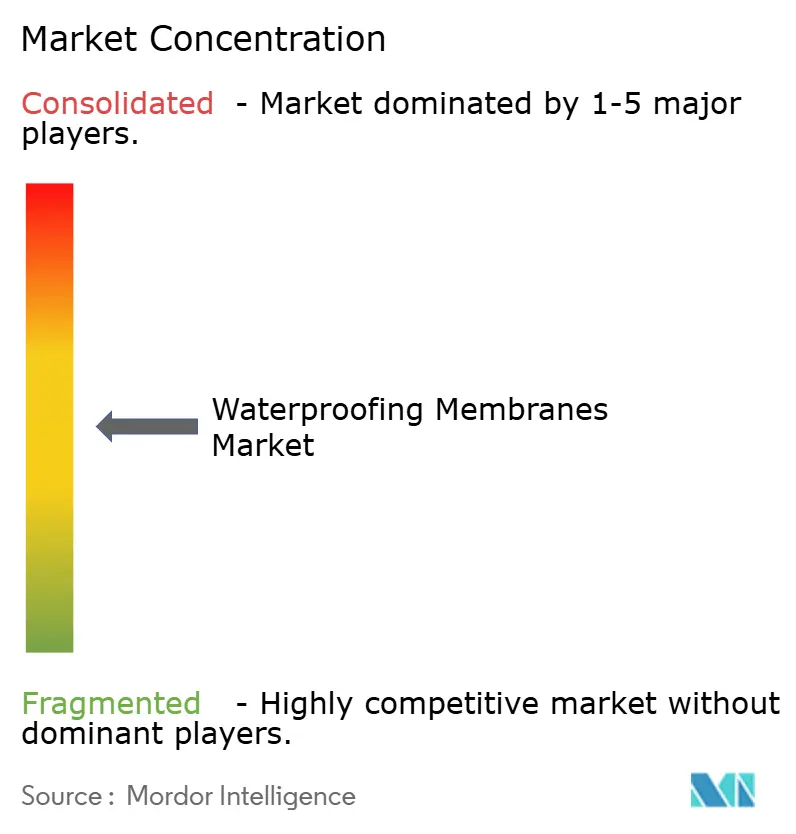
| Market Concentration | Medium |
Major Players *Disclaimer: Major Players sorted in no particular order Image © Mordor Intelligence. Reuse requires attribution under CC BY 4.0. | |
Waterproofing Membranes Market Analysis by Mordor Intelligence
The Waterproofing Membranes Market size is projected to expand from USD 25.12 billion in 2025 and USD 26.51 billion in 2026 to USD 34.74 billion by 2031, registering a CAGR of 5.55% between 2026 to 2031. Robust public-sector spending on tunnels, metros, and flood-control structures is reinforcing baseline demand, while building-envelope energy codes adopted since 2024 integrate moisture control into whole-building carbon accounting, elevating membranes from commodity inputs to engineered performance components. Technology is also reshaping buying criteria: self-healing nano-composite sheets and 100% solids liquid films are now specified in data centers and pharmaceutical cleanrooms where downtime risk outweighs first-cost premiums. At the same time, volatile-organic-compound (VOC) caps of 50 g/L in the United States and 25 g/L proposed in California are accelerating the phase-out of solvent-borne systems, opening share for water-based and reactive chemistries that cure without off-gassing EPA.GOV. Labor scarcity and modular construction growth round out the macro narrative, pushing specifiers toward spray-applied membranes that can be robotically installed in factories, mitigating on-site skill shortages.
Key Report Takeaways
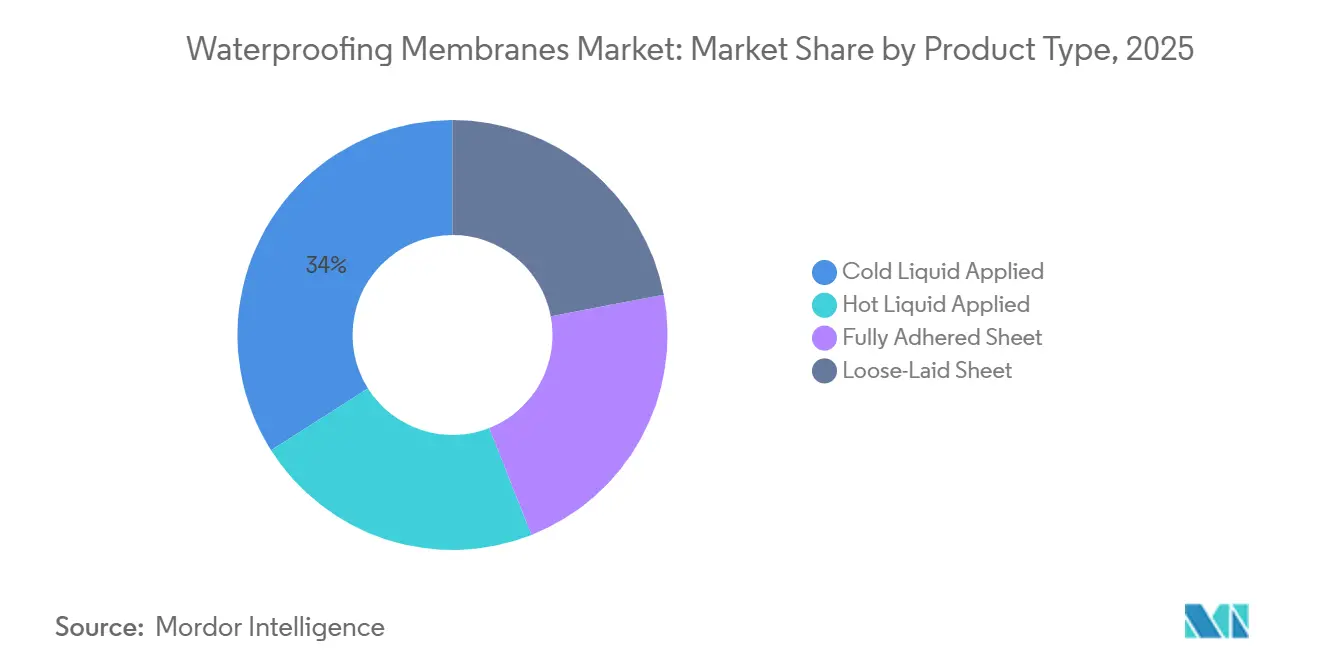
- By product type, cold liquid applied led with 33.99% of the waterproofing membrane market share in 2025, while fully adhered sheets are projected to register a 7.42% CAGR through 2031.
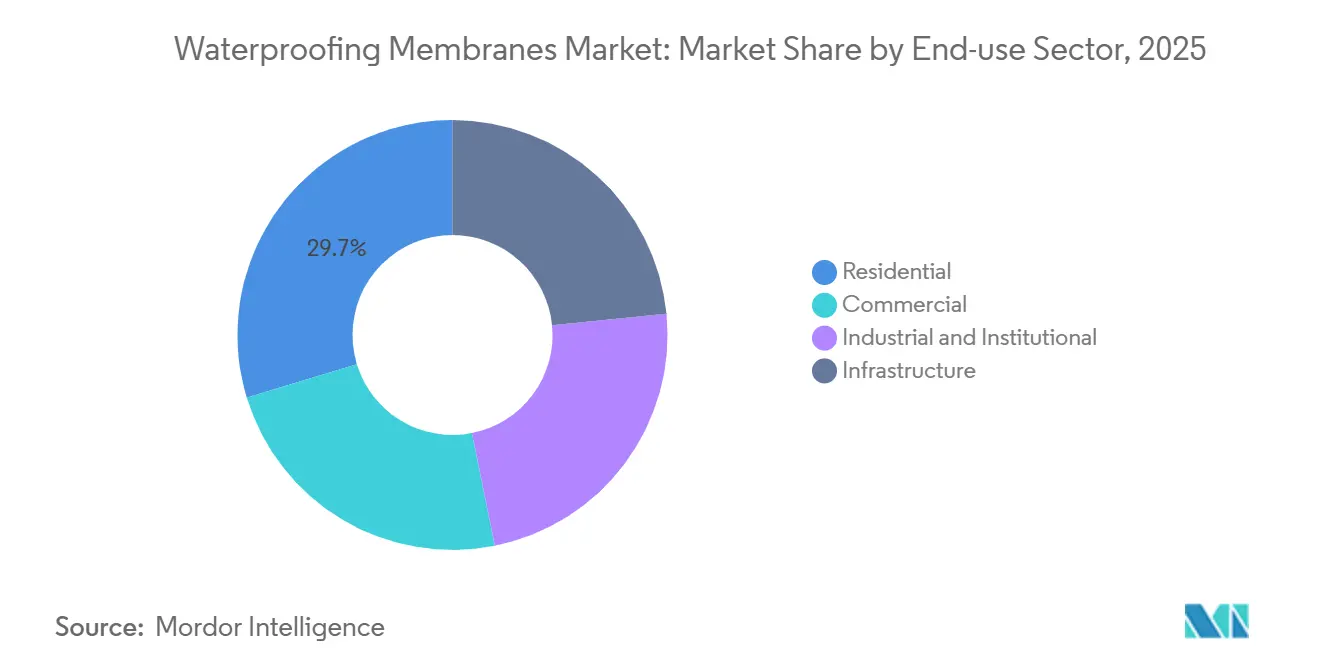
- By end-use sector, residential led with 29.71% of the waterproofing membrane market share in 2025, while infrastructure is projected to register a 6.16% CAGR through 2031.
- By geography, Asia-Pacific held 36.14% revenue share of the waterproofing membrane market in 2025, while South America is forecast to advance at a 5.96% CAGR through 2031.
Note: Market size and forecast figures in this report are generated using Mordor Intelligence’s proprietary estimation framework, updated with the latest available data and insights as of 2026.
Global Waterproofing Membranes Market Trends and Insights
Drivers Impact Analysis*
| Driver | (~) % Impact on CAGR Forecast | Geographic Relevance | Impact Timeline |
|---|---|---|---|
| Tightening building-envelope energy codes | +1.2% | Global, with early enforcement in EU, Canada, and select U.S. states | Medium term (2-4 years) |
| Expansion of green-roof incentives | +0.8% | North America and EU urban cores, emerging in APAC tier-1 cities | Short term (≤ 2 years) |
| Rapid metro, tunnel and sub-surface transit build-outs | +1.5% | APAC (China, India, Southeast Asia), Middle-East (Saudi Arabia, UAE), spill-over to South America | Long term (≥ 4 years) |
| Emergence of self-healing nano-composite membranes | +0.6% | Global, with pilot deployments in high-value infrastructure and data centers | Long term (≥ 4 years) |
| Off-site modular construction favouring liquid applied systems | +0.9% | North America, Northern Europe, Australia | Medium term (2-4 years) |
| Source: Mordor Intelligence | |||


Tightening Building-Envelope Energy Codes
Regulators now tether moisture management to operational carbon targets. The European Union’s 2024 Energy Performance of Buildings Directive compels whole-building life-cycle global-warming-potential disclosure for projects above 2,000 m², steering architects toward low-embodied-carbon polyurethane and recycled-polymer membranes. Canada’s 2025 National Energy Code introduced prescriptive thermal-bridging limits that indirectly raise demand for continuous liquid membranes able to wrap transitions without creating cold spots. Integrated energy-modeling software packages now include membrane hygro-thermal data, meaning specifiers select waterproofing earlier, often locking in higher-margin systems.
Expansion of Green-Roof Incentives
Municipal mandates translate directly into square-meter growth for root-resistant membranes. New York City’s Local Law 92 requires green or solar roofs on new buildings above 20,000 ft², adding waterproofing layers to an annual pipeline exceeding 50 million ft²[1]NYC Mayor’s Office of Climate & Environmental Justice, “Local Law 92 Implementation Guide,” nyc.gov . Toronto raised its rebate to CAD 75/m² in 2025, effectively subsidizing premium membranes on mid-rise projects. These incentives shift liability from general contractors to specialty installers, boosting adoption of factory-controlled spray systems that can document coverage thickness digitally.
Rapid Metro, Tunnel and Sub-Surface Transit Build-Outs
Underground mega-projects are specified for 100-year design life, demanding membranes that resist hydrostatic pressure. Dubai’s Deep Tunnel Storm Water System, launched in 2024, uses welded sheet membranes across 42 km of tunnels 40 m below grade. India allocated USD 1.4 trillion to its National Infrastructure Pipeline through 2030, 18% of which targets metros and tunnels, locking in long-cycle demand for high-performance membranes. Pre-applied sheets reduced Hong Kong tunnel construction time by 15%, pushing the specification trend across APAC.
Emergence of Self-Healing Nano-Composite Membranes
Sika patented a butene-1 copolymer film with micro-capsulated healing agents in 2024, and laboratory tests confirmed 85% tensile-strength recovery after repeated puncture cycles. Halloysite nanotube-filled polyurethane sheets now protect data-center basements where downtime costs millions per hour. Although pricing carries a 20-30% premium, value-in-use analyses prove lower total-ownership cost by eliminating scheduled re-roof intervals.
Restraints Impact Analysis*
| Restraint | (~) % Impact on CAGR Forecast | Geographic Relevance | Impact Timeline |
|---|---|---|---|
| Skilled-installer shortages | -0.7% | North America, Western Europe, Australia | Short term (≤ 2 years) |
| Class-A fire-rating compliance limits for some chemistries | -0.4% | Global, with acute enforcement in North America high-rise markets | Medium term (2-4 years) |
| Stricter VOC caps on solvent-borne formulations | -0.5% | North America (California, Northeast states), EU | Medium term (2-4 years) |
| Source: Mordor Intelligence | |||
Skilled-Installer Shortages
The median age of U.S. waterproofing applicators reached 48 years in 2025, with apprenticeship completions declining 18% since 2020[2]U.S. Bureau of Labor Statistics, “Occupational Employment and Wage Statistics, 2025,” bls.gov . Hourly labor costs rose 22% over 2023-2025, inflating project budgets and delaying schedules. Liquid membranes requiring minimal hand-seaming are gaining favor, yet equipment capital and contractor inertia slow substitution.
Class-A Fire-Rating Compliance Limits for Some Chemistries
NFPA 285 adoption across all U.S. states disqualified certain polyurethane and polyurea liquids when paired with foam insulation. FM Global’s 2024 wind-driven flame test further narrowed the field, shifting share to acrylic and cementitious chemistries. Compliance testing can exceed USD 0.5 million per product, deterring smaller entrants and raising the bar for innovation.
*Our forecasts treat driver/restraint impacts as directional, not additive. The impact forecasts reflect baseline growth, mix effects, and variable interactions.
Segment Analysis
By Product Type: Liquid Growth Balances Sheet Longevity
Cold liquid applied accounted for 33.99% of the waterproofing membrane market in 2025, and they continue expanding as modular builders adopt factory-spray processes. Fully adhered sheets are forecast to log a 7.42% CAGR, the highest among product categories, because metro tunnels and storm-water conduits demand welded seams that survive hydrostatic loads. Hot rubberized asphalt remains entrenched on plaza decks and parking garages where instant trafficability offsets higher installation temperatures. Loose-laid sheets are losing relevance due to wind-uplift risk and vegetated-roof ballast complications. Integration of IoT sprayers and digital thickness logging reinforces quality assurance for liquids, whereas robotic seam-welders now boost sheet productivity on large infrastructure alignments.
Competitive differentiation hinges on chemistry. Self-healing nano-composite sheets promise service-life extensions of two decades, but their 25-30% price premium restrains penetration beyond high-value applications. Meanwhile, EPA VOC caps accelerate the migration from solvent-borne to water-based acrylics and 100% solids polyureas, advantaging suppliers with polymer-science depth. Fire compliance remains a chokepoint; acrylics gain share after passing NFPA 285, while certain polyurethanes await costly retesting.


By End-use Sector: Infrastructure Momentum Outpaces Housing Cycles
Residential represented 29.71% of 2025 revenue, driven by basement damp-proofing and mandated green roofs in dense metros. The infrastructure segment, however, is projected to expand at a 6.16% CAGR and is on track to eclipse residential spend by 2029 as governments fund tunnels, bridges, and coastal defenses. India’s USD 1.4 trillion pipeline allocates 18% to metros and tunnels, embedding waterproofing procurement in long-cycle public contracts. The U.S. Infrastructure Investment and Jobs Act directs USD 110 billion to roads and bridges through 2026, with waterproofing clauses now standard in bid documents.
Commercial and institutional projects deliver steady baseline volumes—office towers, hospitals, and university labs specify higher-grade membranes with 20-25-year warranties, and green-roof bylaws add incremental square footage. Industrial users such as semiconductor fabs and clean-energy gigafactories drive niche growth for chemical-resistant polyureas and self-healing polyurethanes. Risk-averse asset owners now demand digital documentation of membrane application, a trend advancing contractor adoption of smart sprayers and robotic seam-inspectors.
Geography Analysis
Asia-Pacific commanded 36.14% of 2025 value, reflecting China’s metro boom and India’s urban-transit acceleration. Beijing Oriental Yuhong’s 12% sales rise underscores how domestic makers capture localized demand, while Japanese and Korean suppliers carve export niches in high-speed rail tunnels. Southeast Asia adds incremental volume through flood-mitigation sea walls such as Jakarta’s USD 40 billion Great Garuda project.
In North America, federal infrastructure funding sustains demand, yet skilled-labor scarcity inflates costs and steers contractors toward labor-saving liquids. Stricter VOC and fire codes catalyze reformulation, creating openings for regional chemistry innovators. Europe’s rests on reroofing cycles and embodied-carbon mandates that favor recycled-polymer sheets. EU disclosure rules push builders to run life-cycle analyses, effectively bundling waterproofing selection with structural and enclosure elements.
South America is forecast to grow fastest at a 5.96% CAGR. Brazil’s BRL 1.7 trillion PAC infrastructure plan funds metro extensions in São Paulo and Rio, and Argentina’s Buenos Aires subway restart brings new tunneling kilometers that require fully adhered membranes. Currency volatility and policy shifts remain risk factors, yet local production build-outs by multinationals point to long-run commitment. The Middle-East and Africa are powered by mega-projects like Saudi Arabia’s Neom, where desert temperature swings necessitate high-elongation liquid films.

Competitive Landscape
The waterproofing membrane market remains moderately concentrated: the top five firms—Sika, Holcim, Standard Industries Inc., SOPREMA and Saint-Gobain—capture roughly 32% of global turnover. Their strategies coalesce around vertical integration, digital application tools, and chemistry innovation. Sika’s self-healing copolymer patent positions it for data-center basements, where failure costs exceed USD 10 million per incident. Holcim’s Elevate acquisition adds 140 distribution hubs, ensuring last-mile control and installer training. Beijing Oriental Yuhong couples manufacturing with in-house crews, a model that short-circuits labor gaps on China’s Belt and Road projects.
Digitalization is the next battleground. IoT sprayers and seam-scanning drones feed data into BIM models, enabling performance-based warranties now stretching to 25 years. Suppliers offering these value-added services command price premiums and embed switching costs. Sustainability mandates spur R&D into bio-based polyurethanes and recycled-content sheets; Saint-Gobain’s 2025 launch of 40% post-consumer PVC membranes exemplifies regulatory foresight. Smaller challengers focus on single-chemistry niches—ultra-fast-cure polyureas or ultracold-flexible polyurethanes—then license technology upward to multinationals seeking bolt-on growth.
Regional specialists still thrive where logistics or local codes present barriers to scale. Latin America’s import duties protect mid-tier players partnering with multinational resin suppliers. In Africa, climatic extremes reward firms offering turnkey installation and maintenance bundles. Consolidation will likely continue at 1-2 deals per year as multinationals chase geographic holes and chemistry adjacencies, yet antitrust scrutiny, particularly in the EU, tempers blockbuster mergers.
Waterproofing Membranes Industry Leaders
Sika AG
Standard Industries Inc.
Saint-Gobain
SOPREMA
HOLCIM
- *Disclaimer: Major Players sorted in no particular order

Recent Industry Developments
- November 2025: Sika AG acquired Awazil Al Khaleej Industrial Co. (“Gulf Seal”), a Saudi-based manufacturer of bituminous waterproofing membranes, strengthening its presence in Saudi Arabia and the Gulf Cooperation Council (GCC) region. Established over 20 years ago, Gulf Seal supplied membranes for significant construction projects in Saudi Arabia and other GCC countries.
- March 2025: Eternity Waterproofing, a Singapore-based waterproofing company, announced a strategic partnership with Mapei Far East, a subsidiary of Mapei S.p.A. The collaboration aimed to deliver advanced waterproofing membrane systems tailored to the unique climatic and construction demands of Southeast Asia.


Global Waterproofing Membranes Market Report Scope
Waterproofing membranes are durable, water-resistant sheets or liquid coatings applied to surfaces such as roofs, foundations, and basements to prevent water infiltration, mold growth, and structural damage. The primary types include bituminous, PVC, EPDM, and polyurethane membranes, selected based on specific application needs, such as flexibility or UV resistance.
The waterproofing membranes market is segmented by product type, end-use sector, and geography. By product type, the market is segmented into cold liquid applied, hot liquid applied, fully adhered sheet, and loose-laid sheet. By end-use sector, the market is segmented into residential, commercial, industrial and institutional, and infrastructure. The report also covers the market size and forecasts for the waterproofing membranes in 21 countries across major regions. For each segment, the market sizing and forecasts have been done on the basis of value (USD).
| Cold Liquid Applied |
| Hot Liquid Applied |
| Fully Adhered Sheet |
| Loose-Laid Sheet |
| Residential |
| Commercial |
| Industrial and Institutional |
| Infrastructure |
| Asia-Pacific | China |
| India | |
| Japan | |
| South Korea | |
| Indonesia | |
| Malaysia | |
| Thailand | |
| Vietnam | |
| Rest of Asia-Pacific | |
| North America | United States |
| Canada | |
| Mexico | |
| Europe | Germany |
| United Kingdom | |
| Italy | |
| France | |
| Spain | |
| Russia | |
| Rest of Europe | |
| South America | Brazil |
| Argentina | |
| Rest of South America | |
| Middle-East and Africa | Saudi Arabia |
| United Arab Emirates | |
| Rest of Middle-East and Africa |
| By Product Type | Cold Liquid Applied | |
| Hot Liquid Applied | ||
| Fully Adhered Sheet | ||
| Loose-Laid Sheet | ||
| By End-use Sector | Residential | |
| Commercial | ||
| Industrial and Institutional | ||
| Infrastructure | ||
| By Geography | Asia-Pacific | China |
| India | ||
| Japan | ||
| South Korea | ||
| Indonesia | ||
| Malaysia | ||
| Thailand | ||
| Vietnam | ||
| Rest of Asia-Pacific | ||
| North America | United States | |
| Canada | ||
| Mexico | ||
| Europe | Germany | |
| United Kingdom | ||
| Italy | ||
| France | ||
| Spain | ||
| Russia | ||
| Rest of Europe | ||
| South America | Brazil | |
| Argentina | ||
| Rest of South America | ||
| Middle-East and Africa | Saudi Arabia | |
| United Arab Emirates | ||
| Rest of Middle-East and Africa | ||


Market Definition
- END-USE SECTOR - Waterproofing membranes consumed in the construction sectors such as commercial, residential, industrial, institutional, and infrastructure are considered under the scope of the study.
- PRODUCT/APPLICATION - Under the scope of the study, the consumption of waterproofing membrane products including cold liquid applied, hot liquid applied, fully adhered sheet, and loose laid sheet are considered.
| Keyword | Definition |
|---|---|
| Accelerator | Accelerators are admixtures used to fasten the setting time of concrete by increasing the initial rate and speeding up the chemical reaction between cement and the mixing water. These are used to harden and increase the strength of concrete quickly. |
| Acrylic | This synthetic resin is a derivative of acrylic acid. It forms a smooth surface and is mainly used for various indoor applications. The material can also be used for outdoor applications with a special formulation. |
| Adhesives | Adhesives are bonding agents used to join materials by gluing. Adhesives can be used in construction for many applications, such as carpet laying, ceramic tiles, countertop lamination, etc. |
| Air Entraining Admixture | Air-entraining admixtures are used to improve the performance and durability of concrete. Once added, they create uniformly distributed small air bubbles to impart enhanced properties to the fresh and hardened concrete. |
| Alkyd | Alkyds are used in solvent-based paints such as construction and automotive paints, traffic paints, flooring resins, protective coatings for concrete, etc. Alkyd resins are formed by the reaction of an oil (fatty acid), a polyunsaturated alcohol (Polyol), and a polyunsaturated acid or anhydride. |
| Anchors and Grouts | Anchors and grouts are construction chemicals that stabilize and improve the strength and durability of foundations and structures like buildings, bridges, dams, etc. |
| Cementitious Fixing | Cementitious fixing is a process in which a cement-based grout is pumped under pressure to fill forms, voids, and cracks. It can be used in several settings, including bridges, marine applications, dams, and rock anchors. |
| Commercial Construction | Commercial construction comprises new construction of warehouses, malls, shops, offices, hotels, restaurants, cinemas, theatres, etc. |
| Concrete Admixtures | Concrete admixtures comprise water reducers, air entrainers, retarders, accelerators, superplasticizers, etc., added to concrete before or during mixing to modify its properties. |
| Concrete Protective Coatings | To provide specific protection, such as anti-carbonation or chemical resistance, a film-forming protective coat can be applied on the surface. Depending on the applications, different resins like epoxy, polyurethane, and acrylic can be used for concrete protective coatings. |
| Curing Compounds | Curing compounds are used to cure the surface of concrete structures, including columns, beams, slabs, and others. These curing compounds keep the moisture inside the concrete to give maximum strength and durability. |
| Epoxy | Epoxy is known for its strong adhesive qualities, making it a versatile product in many industries. It resists heat and chemical applications, making it an ideal product for anyone needing a stronghold under pressure. It is widely used in adhesives, electrical and electronics, paints, etc. |
| Fiber Wrapping Systems | Fiber Wrapping Systems are a part of construction repair and rehabilitation chemicals. It involves the strengthening of existing structures by wrapping structural members like beams and columns with glass or carbon fiber sheets. |
| Flooring Resins | Flooring resins are synthetic materials applied to floors to enhance their appearance, increase their resistance to wear and tear or provide protection from chemicals, moisture, and stains. Depending on the desired properties and the specific application, flooring resins are available in distinct types, such as epoxy, polyurethane, and acrylic. |
| High-Range Water Reducer (Super Plasticizer) | High-range water reducers are a type of concrete admixture that provides enhanced and improved properties when added to concrete. These are also called superplasticizers and are used to decrease the water-to-cement ratio in concrete. |
| Hot Melt Adhesives | Hot-melt adhesives are thermoplastic bonding materials applied as melts that achieve a solid state and resultant strength on cooling. They are commonly used for packaging, coatings, sanitary products, and tapes. |
| Industrial and Institutional Construction | Industrial and institutional construction includes new construction of hospitals, schools, manufacturing units, energy and power plants, etc. |
| Infrastructure Construction | Infrastructure construction includes new construction of railways, roads, seaways, airports, bridges, highways, etc. |
| Injection Grouting | The process of injecting grout into open joints, cracks, voids, or honeycombs in concrete or masonry structural members is known as injection grouting. It offers several benefits, such as strengthening a structure and preventing water infiltration. |
| Liquid-Applied Waterproofing Membranes | Liquid-Applied membrane is a monolithic, fully bonded, liquid-based coating suitable for many waterproofing applications. The coating cures to form a rubber-like elastomeric waterproof membrane and may be applied over many substrates, including asphalt, bitumen, and concrete. |
| Micro-concrete Mortars | Micro-concrete mortar is made up of cement, water-based resin, additives, mineral pigments, and polymers and can be applied on both horizontal and vertical surfaces. It can be used to refurbish residential complexes, commercial spaces, etc. |
| Modified Mortars | Modified Mortars include Portland cement and sand along with latex/polymer additives. The additives increase adhesion, strength, and shock resistance while also reducing water absorption. |
| Mold Release Agents | Mold release agents are sprayed or coated on the surface of molds to prevent a substrate from bonding to a molding surface. Several types of mold release agents, including silicone, lubricant, wax, fluorocarbons, and others, are used based on the type of substrates, including metals, steel, wood, rubber, plastic, and others. |
| Polyaspartic | Polyaspartic is a subset of polyurea. Polyaspartic floor coatings are typically two-part systems that consist of a resin and a catalyst to ease the curing process. It offers high durability and can withstand harsh environments. |
| Polyurethane | Polyurethane is a plastic material that exists in various forms. It can be tailored to be either rigid or flexible and is the material of choice for a broad range of end-user applications, such as adhesives, coatings, building insulation, etc. |
| Reactive Adhesives | A reactive adhesive is made of monomers that react in the adhesive curing process and do not evaporate from the film during use. Instead, these volatile components become chemically incorporated into the adhesive. |
| Rebar Protectors | In concrete structures, rebar is one of the important components, and its deterioration due to corrosion is a major issue that affects the safety, durability, and life span of buildings and structures. For this reason, rebar protectors are used to protect against degrading effects, especially in infrastructure and industrial construction. |
| Repair and Rehabilitation Chemicals | Repair and Rehabilitation Chemicals include repair mortars, injection grouting materials, fiber wrapping systems, micro-concrete mortars, etc., used to repair and restore existing buildings and structures. |
| Residential Construction | Residential construction involves constructing new houses or spaces like condominiums, villas, and landed homes. |
| Resin Fixing | The process of using resins like epoxy and polyurethane for grouting applications is called resin fixing. Resin fixing offers several advantages, such as high compressive and tensile strength, negligible shrinkage, and greater chemical resistance compared to cementitious fixing. |
| Retarder | Retarders are admixtures used to slow down the setting time of concrete. These are usually added with a dosage rate of around 0.2% -0.6% by weight of cement. These admixtures slow down hydration or lower the rate at which water penetrates the cement particles by making concrete workable for a long time. |
| Sealants | A sealant is a viscous material that has little or no flow qualities, which causes it to remain on surfaces where they are applied. Sealants can also be thinner, enabling penetration to a certain substance through capillary action. |
| Sheet Waterproofing Membranes | Sheet membrane systems are reliable and durable thermoplastic waterproofing solutions that are used for waterproofing applications even in the most demanding below-ground structures, including those exposed to highly aggressive ground conditions and stress. |
| Shrinkage Reducing Admixture | Shrinkage-reducing admixtures are used to reduce concrete shrinkage, whether from drying or self-desiccation. |
| Silicone | Silicone is a polymer that contains silicon combined with carbon, hydrogen, oxygen, and, in some cases, other elements. It is an inert synthetic compound that comes in various forms, such as oil, rubber, and resin. Due to its heat-resistant properties, it finds applications in sealants, adhesives, lubricants, etc. |
| Solvent-borne Adhesives | Solvent-borne adhesives are mixtures of solvents and thermoplastic or slightly cross-linked polymers such as polychloroprene, polyurethane, acrylic, silicone, and natural and synthetic rubbers. |
| Surface Treatment Chemicals | Surface treatment chemicals are chemicals used to treat concrete surfaces, including roofs, vertical surfaces, and others. They act as curing compounds, demolding agents, rust removers, and others. They are cost-effective and can be used on roadways, pavements, parking lots, and others. |
| Viscosity Modifier | Viscosity Modifiers are concrete admixtures used to change various properties of admixtures, including viscosity, workability, cohesiveness, and others. These are usually added with a dosage of around 0.01% to 0.1% by weight of cement. |
| Water Reducer | Water reducers, also called plasticizers, are a type of admixture used to decrease the water-to-cement ratio in the concrete, thereby increasing the durability and strength of concrete. Various water reducers include refined lignosulfonates, gluconates, hydroxycarboxylic acids, sugar acids, and others. |
| Water-borne Adhesives | Water-borne adhesives use water as a carrier or diluting medium to disperse resin. They are set by allowing the water to evaporate or be absorbed by the substrate. These adhesives are compounded with water as a dilutant rather than a volatile organic solvent. |
| Waterproofing Chemicals | Waterproofing chemicals are designed to protect a surface from the perils of leakage. A waterproofing chemical is a protective coating or primer applied to a structure's roof, retaining walls, or basement. |
| Waterproofing Membranes | Waterproofing membranes are liquid-applied or self-adhering layers of water-tight materials that prevent water from penetrating or damaging a structure when applied to roofs, walls, foundations, basements, bathrooms, and other areas exposed to moisture or water. |


Research Methodology
Mordor Intelligence follows a four-step methodology in all our reports.
- Step-1: Identify Key Variables: The quantifiable key variables (industry and extraneous) pertaining to the specific product segment and country are selected from a group of relevant variables & factors based on desk research & literature review; along with primary expert inputs. These variables are further confirmed through regression modeling (wherever required).
- Step-2: Build a Market Model: In order to build a robust forecasting methodology, the variables and factors identified in Step-1 are tested against available historical market numbers. Through an iterative process, the variables required for market forecast are set and the model is built on the basis of these variables.
- Step-3: Validate and Finalize: In this important step, all market numbers, variables and analyst calls are validated through an extensive network of primary research experts from the market studied. The respondents are selected across levels and functions to generate a holistic picture of the market studied.
- Step-4: Research Outputs: Syndicated Reports, Custom Consulting Assignments, Databases & Subscription Platforms


