
Water Testing Market Size and Share
Market Overview
| Study Period | 2021 - 2031 |
|---|---|
| Market Size (2026) | USD 4.83 Billion |
| Market Size (2031) | USD 6.26 Billion |
| Growth Rate (2026 - 2031) | 5.32 % |
| Fastest Growing Market | Asia-Pacific |
| Largest Market | North America |
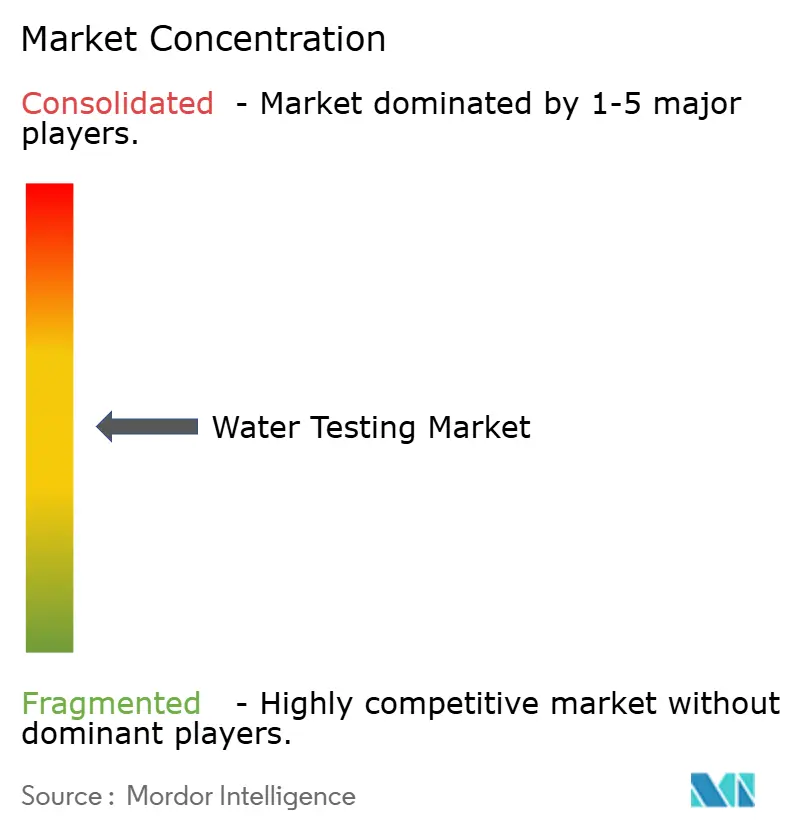
| Market Concentration | Medium |
Major Players
*Disclaimer: Major Players sorted in no particular order Image © Mordor Intelligence. Reuse requires attribution under CC BY 4.0. |
|
Water Testing Market Analysis by Mordor Intelligence
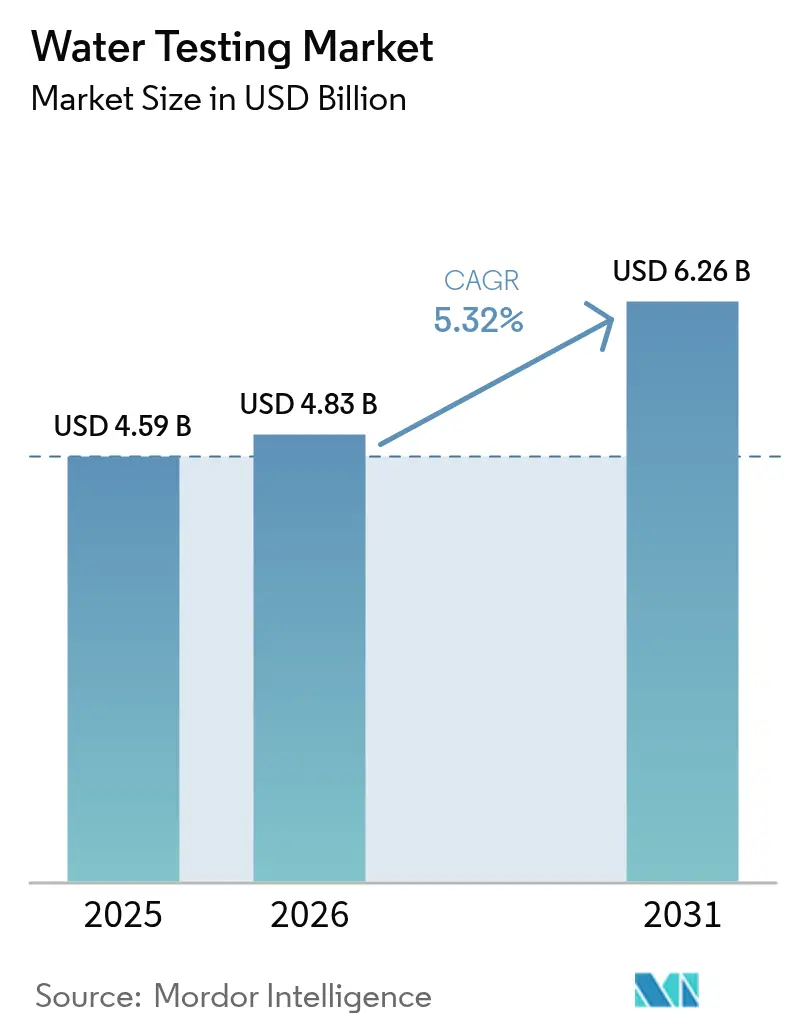
Water testing market size in 2026 is estimated at USD 4.83 billion, growing from 2025 value of USD 4.59 billion with 2031 projections showing USD 6.26 billion, growing at 5.32% CAGR over 2026-2031. This growth is driven by a strategic shift from routine compliance testing to advanced detection of emerging contaminants. In April 2024, the U.S. Environmental Protection Agency set maximum contaminant levels for per- and polyfluoroalkyl substances (PFAS), specifically at 4 parts per trillion for PFOA and PFOS. These new standards, which utilities must adhere to by October 2029, have significantly altered the financial landscape of municipal water testing. As a result, utilities are now compelled to invest in LC-MS/MS instrumentation, which boasts the sensitivity to detect levels below a part per trillion[2]Source: United States Environmental Protection Agency, "Final PFAS National Primary Drinking Water Regulation", epa.gov. Additionally, recurring outbreaks of waterborne diseases are driving demand for faster and more reliable microbiological testing solutions. While chemical testing remains the largest segment due to established regulatory frameworks, growth is increasingly concentrated in microbiological assays and real-time monitoring systems. North America continues to dominate in revenue generation, supported by stringent regulations and a high density of laboratories. However, the Asia-Pacific region is emerging as the fastest-growing market, driven by infrastructure development, rural water initiatives, and stricter industrial discharge norms. These factors are accelerating the adoption of portable, decentralized, and online testing solutions, reshaping the competitive landscape in favor of scalable, technology-driven platforms.
Key Report Takeaways
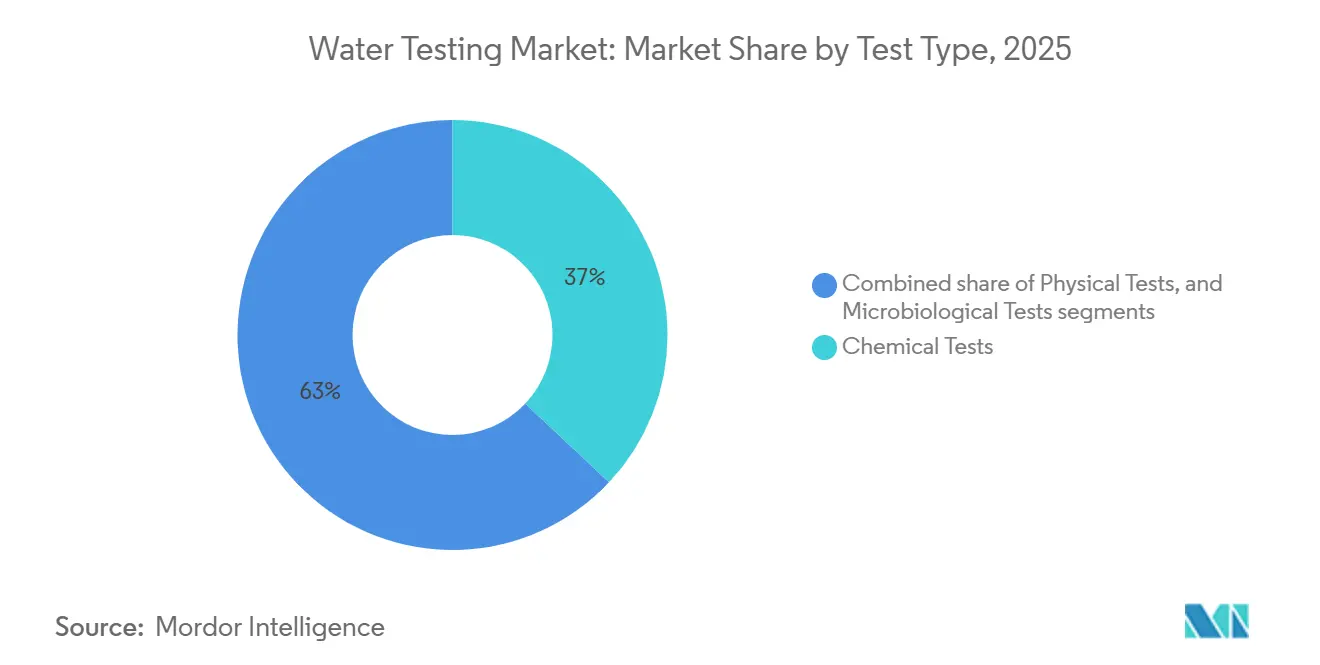
- By test type segmentation, chemical tests lead with 37.02% market share in 2025, while microbiological tests achieve the fastest growth at 6.05% CAGR (2026-2031).
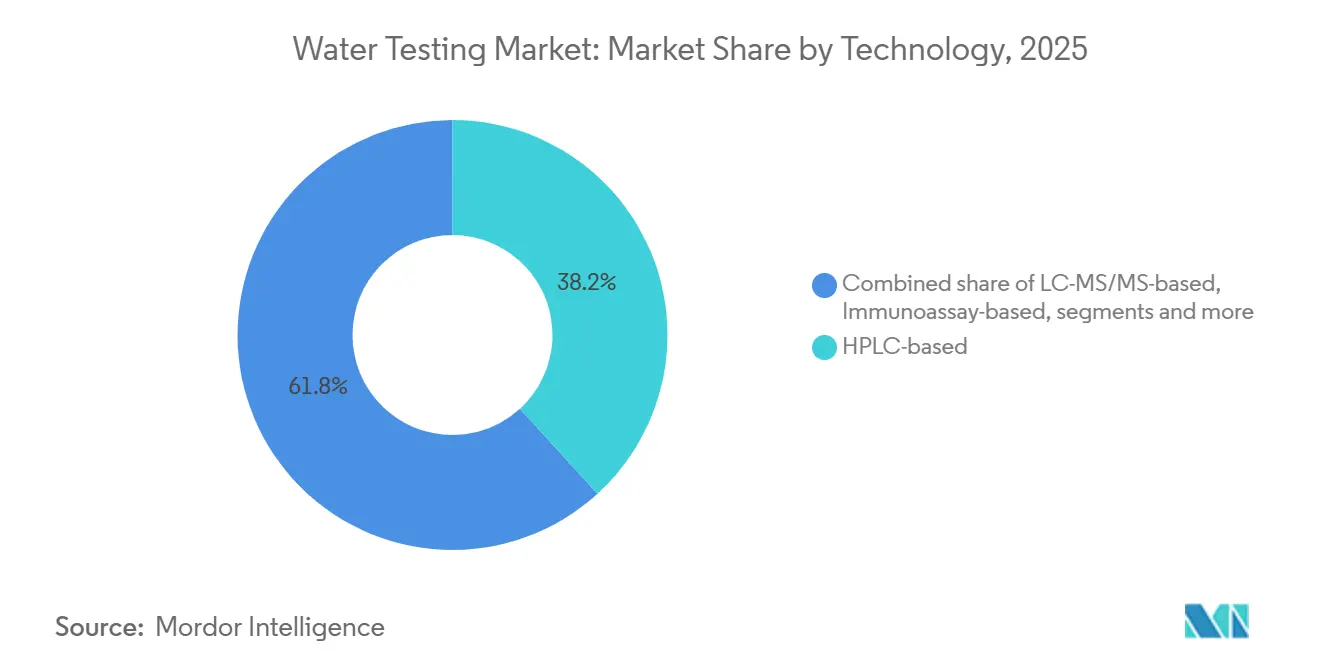
- By technology segmentation, HPLC-based systems dominate with 38.21% market share in 2025, while LC-MS/MS-based platforms capture the highest growth at 5.88% CAGR (2026-2031).
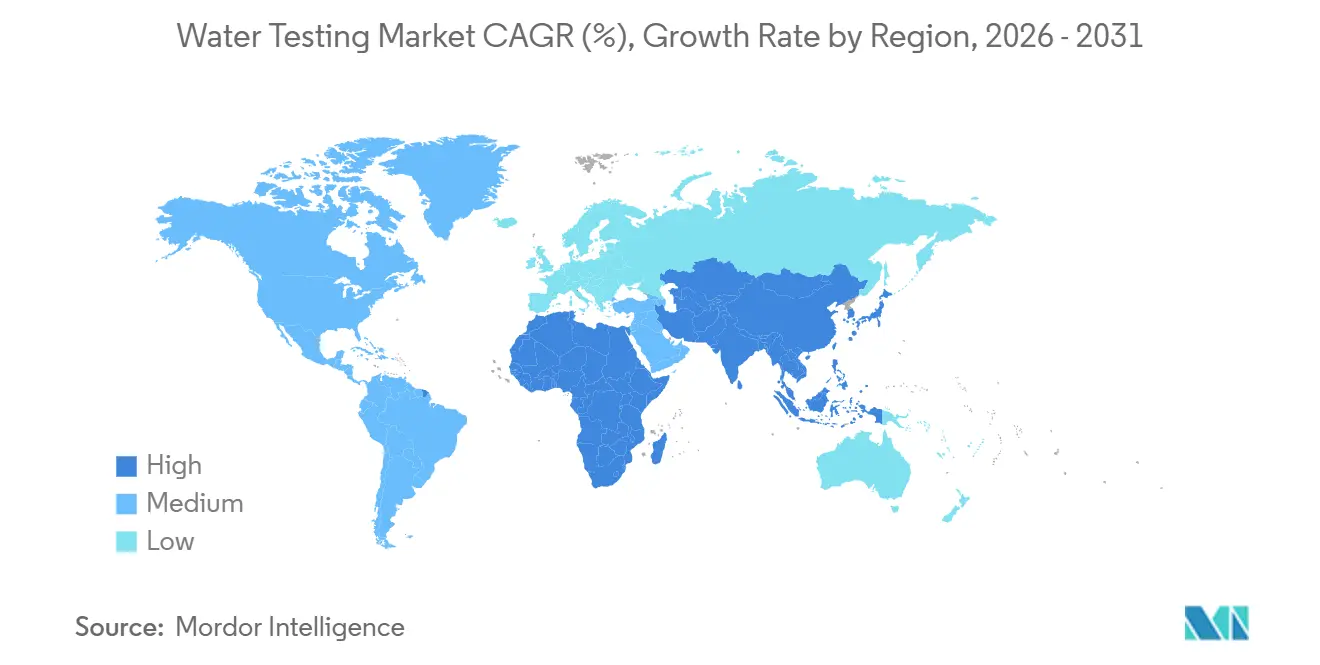
- By geographic, North America holds the largest share at 33.45% in 2025, while Asia-Pacific delivers the fastest growth at 6.28% CAGR (2026-2031).
Note: Market size and forecast figures in this report are generated using Mordor Intelligence’s proprietary estimation framework, updated with the latest available data and insights as of 2026.
Market Trends and Insights
Drivers Impact Analysis of Water Testing Market*
| Driver | (~) % Impact on CAGR Forecast | Geographic Relevance | Impact Timeline |
|---|---|---|---|
| Strict government regulations on water quality standards | +1.8% | Global, with strongest impact in North America and Europe | Medium term (2-4 years) |
| Rising awareness about waterborne diseases and public health concerns | +1.2% | Global, with accelerated adoption in Asia-Pacific and emerging markets | Short term (≤ 2 years) |
| Increasing focus on sustainable water management and resource conservation | +0.9% | Global, with leadership from Europe and North America | Long term (≥ 4 years) |
| Development and adoption of portable, easy-to-use water testing kits | +0.8% | Global, with rapid uptake in Asia-Pacific and Latin America | Short term (≤ 2 years) |
| Growing government initiatives for improved water quality surveillance | +0.6% | North America, Europe, and select Asia-Pacific markets | Medium term (2-4 years) |
| Technological advances enabling multi-parameter simultaneous testing | +0.4% | Global, with early adoption in developed markets | Medium term (2-4 years) |
| Source: Mordor Intelligence | |||
Strict government regulations on water quality standards
Regulatory changes across global jurisdictions are driving demand for advanced analytical capabilities as agencies expand monitored contaminant lists and lower detection thresholds. The EPA's UCMR5 program identified PFAS contamination in approximately one-third of major urban water systems, leading to proposed limits of 4 parts per trillion for PFOA and PFOS. In June 2025, China's Ministry of Ecology and Environment published the Second List of Toxic and Hazardous Water Pollutants, expanding industrial monitoring requirements and increasing laboratory capacity. These regulatory requirements are compelling water utilities and industrial facilities to invest in advanced testing infrastructure, generating consistent revenue streams for instrument manufacturers and service providers. Variations in standards across jurisdictions allow testing companies to maintain premium pricing for specialized analytical services. In February 2025, Wisconsin's USD 145 million PFAS investment demonstrates how state-level initiatives strengthen federal mandates, creating regional demand and supporting local testing laboratories.
Rising awareness about waterborne diseases and public health concerns
As public health agencies adjust risk models to consider climate-driven shifts in pathogen behavior, there's a notable global shift in water testing practices. Despite years of infrastructure investments, waterborne diseases continue to persist and spread. This underscores the urgent need for advanced detection methods, moving beyond the conventional coliform and E. coli tests[3]Source: World Health Organization, "Drinking-water", who.int. Consequently, there's a growing momentum for molecular assays and rapid diagnostic tools. These innovations promise more precise identification of viral and protozoan pathogens, underscoring the pivotal role of water testing in proactive public health management. This has created strong momentum for molecular assays and rapid diagnostic tools that can more accurately identify viral and protozoan pathogens, positioning water testing as a critical component of proactive public health management.
Increasing focus on sustainable water management and resource conservation
With water scarcity emerging as a critical global issue, businesses are increasingly adopting advanced treatment and reuse technologies. These innovations demand robust monitoring systems to ensure compliance with safety and regulatory standards. In China, the updated recycled water quality standards (GB/T 19923-2024) and the Ministry of Water Resources' draft industrial water use quotas have introduced stringent testing requirements for water recycling facilities[1]Source: National Standardization Administration of the State Administration, “Standard number: GB/T 19923-2024,” openstd.samr.gov.cn. To meet these demands, multi-parameter analyzers and automated monitoring systems have become indispensable for optimizing treatment processes and adhering to complex water quality regulations. Reliable monitoring systems are essential for water reuse facilities to demonstrate compliance and enhance operational efficiency. Advanced analytical platforms, such as Waters' Xevo TQ Absolute Triple Quadrupole systems, provide efficient multi-contaminant monitoring while delivering high-quality data critical for regulatory compliance and sustainability reporting.
Development and adoption of portable, easy-to-use water testing kits
Technological advancements are driving significant changes in the water quality testing market, enabling the development of smaller, more user-friendly equipment. This progress is unlocking opportunities beyond traditional laboratory settings, allowing businesses and organizations, particularly in emerging markets, to perform comprehensive water testing in the field. KETOS's SHIELD autonomous monitoring system exemplifies this market evolution by offering testing for over 30 parameters through IoT-enabled subscription models, effectively eliminating traditional barriers to advanced monitoring solutions. The adoption of portable testing systems is addressing regulatory requirements, such as Ontario's private well testing initiatives, where logistical and financial challenges make field-based solutions more practical than centralized laboratory testing. Subscription-based business models are transforming capital expenditures into manageable operational costs, providing a financial advantage to smaller utilities and budget-constrained organizations. Manufacturers are responding to these market demands with innovative solutions. For instance, Hach's SL250 portable parallel analyzer integrates advanced colorimetric and probe-based technologies, enabling organizations to achieve laboratory-grade results directly in the field.
Restraints Impact Analysis of Water Testing Market*
| Restraint | (~) % Impact on CAGR Forecast | Geographic Relevance | Impact Timeline |
|---|---|---|---|
| High cost of advanced water testing equipment and technologies | -1.1% | Global, with strongest impact in emerging markets and small utilities | Medium term (2-4 years) |
| Complex and heterogeneous water quality regulations across countries | -0.7% | Global, with particular challenges in multi-jurisdictional operations | Long term (≥ 4 years) |
| Lack of skilled professionals to operate sophisticated water testing instruments | -0.5% | Global, with acute shortages in Asia-Pacific and Latin America | Long term (≥ 4 years) |
| Difficulty in standardizing test methods across different regions | -0.3% | Global, with emphasis on cross-border laboratory operations | Medium term (2-4 years) |
| Source: Mordor Intelligence | |||
High cost of advanced water testing equipment and technologies
The high cost of advanced water testing equipment remains a critical barrier to market expansion, particularly for smaller utilities and laboratories with limited financial resources to invest in sophisticated systems. Beyond the initial acquisition, ongoing expenses related to maintenance, facility upgrades, consumables, and workforce training significantly increase the total cost of ownership. This disparity enables larger institutions to adopt advanced technologies while smaller entities are compelled to rely on outsourcing or outdated methods. While leasing and equipment-as-a-service models provide partial financial relief, their long-term commitments often strain constrained municipal budgets. Furthermore, regulatory requirements that assume access to advanced instrumentation exacerbate compliance challenges. This scenario perpetuates analytical gaps in rural and low-income regions, impeding the broader adoption of modern water testing solutions.
Complex and heterogeneous water quality regulations across countries
Fragmented regulatory frameworks across countries significantly restrain the global water testing market. Divergent contaminant limits, testing protocols, and accreditation requirements lead to operational inefficiencies for laboratories and equipment manufacturers. For instance, Vietnam's QCVN 40:2025/BTNMT industrial wastewater standards and the Philippines' DENR Administrative Order No. 2025-24 on waterbody classification highlight regional regulatory differences, necessitating specific testing protocols and technical expertise. Multinational players must uphold separate validation procedures to align with varying regional standards. In contrast, developing markets often lack the enforcement capacity, resulting in compliance uncertainties. Additionally, conflicting guidance from international and national bodies muddles sampling and reporting practices. The lack of mutual recognition agreements necessitates redundant audits, inflating costs without enhancing data quality. Despite ongoing efforts, slow progress on harmonization underscores the challenges of achieving global standardization, thereby limiting scalability and consistency in water testing operations.
*Our forecasts treat driver/restraint impacts as directional, not additive. The impact forecasts reflect baseline growth, mix effects, and variable interactions.
Water Testing Market Segment Analysis
By Test Type:
Chemical Tests Lead Amid PFAS SurgeIn 2025, chemical tests led the global water testing market, accounting for 37.02% of the market share. This leadership was primarily driven by stringent regulatory requirements targeting pesticides, heavy metals, and industrial pollutants. The ongoing need to monitor agricultural runoff and contamination from aging infrastructure continues to sustain demand for pesticide and heavy metal testing. At the same time, physical tests like turbidity and pH, though indispensable, have become commoditized. While radiological and specialized organic analyses address niche applications, the majority of chemical testing revenue is anchored in legacy compliance mandates, reinforcing its critical role in maintaining water quality across municipal and industrial systems.
Microbiological tests, while representing a smaller market share in 2025, are poised for significant growth, with a projected CAGR of 6.05% through 2031. This growth is fueled by the increasing need for faster and more precise pathogen detection. Traditional culture-based methods are being replaced by advanced molecular assays and rapid immunoassays, which provide same-day results and enable swift corrective actions in sectors such as utilities, food processing, and building water systems. The rising prevalence of waterborne disease outbreaks has exposed the limitations of conventional testing methods. Additionally, new regulatory mandates, including the monitoring of antimicrobial resistance markers, are expanding the scope of microbiological testing. This shift highlights a growing focus on public health surveillance, positioning microbial assays as a key driver of innovation and a catalyst for future market growth.



By Technology:
LC-MS/MS Gains on HPLC DominanceChromatography continues to dominate the global water testing market. By 2025, HPLC platforms are projected to account for a 38.21% market share, driven by their established application in regulatory methods for pesticides, pharmaceuticals, and industrial pollutants. The versatility and extensive method libraries of HPLC have positioned it as the standard for multi-residue screening. However, its sensitivity limitations are creating opportunities for LC-MS/MS systems. With ppt-level quantitation capabilities, LC-MS/MS is increasingly preferred for detecting emerging contaminants such as PFAS and endocrine disruptors. The segment is expected to grow at a 5.88% CAGR through 2031, supported by regulatory mandates emphasizing ultra-trace detection. This transition is positioning mass spectrometry as the future backbone of chemical water testing.
In microbiological testing, molecular technologies are transforming the market by addressing the demand for faster and more accurate pathogen detection. PCR-based assays deliver results within hours, enabling immediate corrective actions such as boil-water advisories. Immunoassay platforms, on the other hand, provide rapid field screening in minutes. These advancements are displacing traditional culture methods, which are increasingly viewed as too slow for modern operational requirements. While specialized techniques like ion chromatography and atomic absorption spectroscopy remain relevant for niche applications, they face growing competition from multi-analyte platforms that streamline workflows. The market is increasingly bifurcating, with centralized laboratories adopting LC-MS/MS for definitive quantitation and decentralized field testing leveraging PCR and immunoassays. This shift reflects a broader industry trend toward proactive risk management over reactive compliance.
Geography Analysis
North America Water Testing Market
In 2025, North America is projected to hold a 33.45% market share, driven by well-established regulatory frameworks and significant infrastructure investments. in August 2024, the Clean Water State Revolving Fund has allocated USD 630 billion in long-term infrastructure financing, sustaining consistent demand for testing services. Municipal procurement programs across the region continue to generate steady requirements for laboratory services. While Canada and Mexico contribute through federal water quality initiatives and cross-border environmental programs, U.S. federal and state regulations remain the primary market drivers.
APAC Water Testing Market
The Asia-Pacific water testing and analysis market is anticipated to grow at a CAGR of 6.28% through 2031, fueled by rapid industrialization, urban population growth, and evolving water quality regulations in key markets such as China, India, and Southeast Asia. China's regulatory advancements, including the introduction of the Second List of Toxic and Hazardous Water Pollutants in June 2025, have significantly increased the demand for laboratory testing services. Similarly, India's enhanced enforcement of water quality standards and regulatory modernization across Southeast Asia are creating new growth opportunities in the market.
Europe Water Testing Market
In Europe, the market demonstrates stable performance, supported by unified EU water quality directives and national implementation programs. The region's focus on circular economy principles and water reuse has driven demand for advanced monitoring systems. Strategic moves, such as NSF's acquisition of G+S Laboratory in Germany, which added over 40 specialists to its operations, further strengthen the market. Europe's established laboratory networks, coupled with regulatory oversight from the European Environment Agency and national authorities, enable premium pricing for specialized testing services, particularly for emerging contaminants and industrial wastewater analysis.

Regulatory Landscape
Regulatory tightening is expanding required analyte lists and lowering detection thresholds, which is pushing utilities and industrial users toward higher-sensitivity methods. In the United States, the EPA finalized enforceable drinking water limits for PFAS in April 2024, including 4 parts per trillion for PFOA and PFOS, with compliance deadlines extending to October 2029. That change directly increases demand for LC-MS/MS-based confirmation and routine monitoring programs.
In 2025-2026, new and revised requirements broaden enforcement beyond municipal drinking water into food and industrial water use cases. The US FDA advanced FSMA implementation for pre-harvest agricultural water through inspection assignments in August 2025, elevating irrigation and other farm water into routine verification testing. In May 2026, revised EU pollutant lists entered into force under the Water Framework Directive-related legislation, adding stricter monitoring for PFAS and certain pesticides with transposition required by 22 December 2027. In Asia, Thailand issued Notification No. 462 B.E. 2568 (2025) for sealed-container drinking water quality criteria, while India moved packaged drinking and mineral water toward a mandatory Scheme of Testing and Inspection under FSSAI, shifting compliance from one-time certification to ongoing testing cycles.
Competitive Landscape
Leading players such as Eurofins Scientific, SGS, and Intertek maintain a strong foothold in the water testing market by leveraging extensive global laboratory networks and robust regulatory expertise. Concurrently, smaller firms are gaining traction by introducing innovative technological solutions and offering specialized testing services tailored to specific industry requirements.
The market witnessed significant consolidation within the industry, driven by notable acquisitions, including SGS's acquisition of Accutest Laboratories and Eurofins' integration of SF Analytical Laboratories. These strategic initiatives highlight the increasing importance of operational scale in addressing regulatory compliance and achieving broad geographic coverage. Companies that integrate traditional laboratory testing with advanced analytical technologies, such as LC-MS/MS platforms for PFAS and emerging contaminant analysis, have established a competitive advantage.
The market continues to offer growth opportunities, particularly in the development of portable testing equipment and subscription-based monitoring services. Companies like KETOS have successfully entered the market by introducing automated IoT monitoring systems, making advanced testing solutions accessible to a wider customer base. The complex and diverse regulatory landscape across jurisdictions has prevented market commoditization while creating opportunities for companies proficient in navigating intricate compliance requirements. Expertise in managing multiple compliance frameworks has become a critical differentiator for achieving success in this competitive market.
Water Testing Industry Leaders
-
Eurofins Scientific SE
-
Intertek Group plc
-
SGS SA
-
ALS Limited
-
Bureau Veritas SA
- *Disclaimer: Major Players sorted in no particular order
Water Testing Market Companies Covered in this Report
- Eurofins Scientific SE
- SGS SA
- Intertek Group plc
- ALS Limited
- Bureau Veritas SA
- TÜV SÜD
- Institut Mérieux (Mérieux NutriSciences)
- UL LLC
- Neogen Corporation
- NSF International
- Danaher Corporation (Hach)
- Thermo Fisher Scientific Inc.
- Agilent Technologies Inc.
- Shimadzu Corporation
- IDEXX Laboratories Inc.
- Xylem Inc.
- PerkinElmer Inc.
- Bio-Rad Laboratories Inc.
- Palintest Ltd (Halma plc)
- Randox Laboratories Ltd

Market Opportunities and Future Outlook
Compliance-driven testing is widening from end-point product release to continuous verification across source, process, and reuse loops, creating whitespace for hybrid models that combine laboratory confirmation with online monitoring. For bottled water, FDA requirements under 21 CFR Part 129 include recurring source-water analyses (chemical and radiological contaminants at least every four years) and frequent microbiological checks (weekly total coliform testing for certain sources). This supports steady demand for routine microbiological and chemical testing while encouraging producers to standardize methods across multi-site operations. On the public-water side, the EPA timetable around PFAS and future contaminant monitoring cycles, including UCMR 6 sampling proposed for 2028-2030, reinforces demand for ultra-trace analytical capacity and scalable sample throughput in regional laboratories.
A clear opportunity is the shift toward in-line, real-time sensing for operational control in food and beverage water systems and Clean-In-Place (CIP) processes, reducing reliance on delayed lab turnarounds for every decision. In 2026, multiple industrial vendors highlighted deployments of real-time monitoring building blocks, including Burkert sensor-based chlorine monitoring systems (March 2026), METASH online TOC tracking for process water control (April 2026), and Satron multi-wavelength optical turbidity monitoring for CIP (April 2026). These moves support growth in multi-parameter, decentralized monitoring architectures that integrate turbidity, pH, disinfectant residuals, and organic carbon into plant automation, while still requiring periodic lab-based verification for regulated contaminants such as PFAS and pesticides.
Recent Industry Developments in Water Testing Market
- April 2026: SGS opened a new laboratory in Antananarivo, Madagascar, expanding local capabilities in food microbiology and water testing. The added in-country capacity shortens turnaround times for routine compliance and export-related verification, strengthening SGS coverage in an under-served testing geography.
- February 2026: Intertek enhanced its Shanghai food laboratory with new analytical capacity to detect cereulide, a toxin produced by Bacillus cereus. The upgrade broadens Intertek's high-sensitivity food and process-environment testing toolkit, supporting customers that run risk-based monitoring programs where water and hygiene controls are tightly linked to product safety.
- October 2024: NSF expanded its European water testing footprint by acquiring G+S Laboratory in Germany, adding more than 40 specialists. The transaction increased NSF's laboratory scale in Europe and improved its ability to provide harmonized testing support for multinational customers operating across multiple regulatory regimes.


Water Testing Market Report Scope and Research Methodology
Market Definition and Coverage
This market covers revenue generated from testing the quality of water samples using lab methods and field instruments, where results are reported against physical, chemical, and microbiological parameters across major end users.
Scope exclusions: Sales of upstream water treatment equipment and ongoing plant operations spending are not counted unless they are directly part of water testing activities.
Segments Covered in This Report
-
By Test Type
- Physical Tests
-
Chemical Tests
- Pesticides
- Heavy Metals and Others
- Microbiological Tests
-
By Technology
- HPLC-based
- LC-MS/MS-based
- Immunoassay-based
- Other Technologies
-
By Geography
-
North America
- United States
- Canada
- Mexico
- Rest of North America
-
Europe
- Germany
- United Kingdom
- Italy
- France
- Spain
- Netherlands
- Poland
- Belgium
- Sweden
- Rest of Europe
-
Asia-Pacific
- China
- India
- Japan
- Australia
- Indonesia
- South Korea
- Thailand
- Singapore
- Rest of Asia-Pacific
-
South America
- Brazil
- Argentina
- Colombia
- Chile
- Peru
- Rest of South America
-
Middle East and Africa
- South Africa
- Saudi Arabia
- United Arab Emirates
- Nigeria
- Egypt
- Morocco
- Turkey
- Rest of Middle East and Africa
-
North America
Data Sources, Market Sizing, and Validation
Desk Research
Desk work starts with public baselines that anchor demand and compliance needs, and then it is narrowed into what is truly test related. We typically refer to official sources such as the US EPA drinking water and wastewater programs, USGS water data, WHO guidance on water quality, and CDC references on waterborne risks, since these help map why testing is performed and how frequently it is triggered.
We also review standards and method references from bodies such as ISO and ASTM, along with customs and trade statistics where equipment and reagents flows can be used as a reasonableness check. To keep company level estimates grounded, we read annual reports, regulatory filings, and investor presentations, and we complement this with subscriptions used for company financials and intelligence, patent databases, and an import and export shipment level database where relevant. These sources are not exhaustive, and other public documents and data points were also used to collect, validate, and clarify assumptions.
Primary Interviews and Surveys
Primary inputs were gathered from labs, instrument and consumables suppliers, distributors, and end users such as municipal utilities and industrial water managers, so we could validate test volumes, pricing behavior, and replacement cycles. Because this is a global market, we ensured coverage across major regions, and we used follow-up calls when desk signals and interview feedback did not line up cleanly.
Distribution of primary research fieldwork respondents
| Company type | Respondent position | Region |
|---|---|---|
| Top tier: 30% | CXOs: 13% | APAC: 45% |
| Mid tier: 54% | Functional/Unit leaders: 41% | EMEA: 36% |
| Smaller Players: 16% | Managers: 46% | Americas: 19% |
Market-Sizing & Forecasting
Sizing is built using a top-down structure where regulation-led testing frequency and reported water quality monitoring intensity are translated into an addressable pool of tests, and then converted into value using typical price bands by test type and technology. Before totals are finalized, the output is checked with selective bottom-up approximations, such as sampled lab revenue logic, channel feedback on instrument placements, and a few ASP times volume cross checks for consumables.
The model uses practical inputs that can be explained and repeated, including the mix of chemical versus microbiological testing, the share of field testing versus lab testing, typical instrument replacement and calibration cycles, consumables run rates tied to sample throughput, and the pace of tighter compliance monitoring in municipal and industrial sites. Where primary inputs are thin for smaller countries, we fill gaps by using proxy indicators like population served by regulated water systems and the industrial activity mix, and then we adjust with interview-based sanity checks.
For forecasting, scenario analysis is used so drivers can be moved transparently, and the assumptions are aligned to expert views on changes in monitoring intensity, technology adoption (for example, PCR and molecular share movement), and realistic price progression. The forecast is then reviewed against the implied CAGR and whether the mix shifts produce believable revenue distribution across regions.
Data Validation & Update Cycle
Validation is done by comparing results across several independent signals, and then investigating any large variance before numbers are signed off. We check implied test volumes against known compliance cycles, compare pricing assumptions against interview ranges, and look for anomalies like sudden jumps in one region that cannot be explained by monitoring policies or industrial demand.
A multi-step internal review is followed, where another analyst challenges key inputs and recalculates the main sheets to catch errors early. If a major mismatch remains, we re-contact relevant respondents for clarification, particularly on pricing, technology mix, or regional adoption. Reports are refreshed annually, and interim updates are made when material events shift the demand picture, followed by a final pre-delivery pass so clients receive the latest updated view.
Mordor Intelligence's Water Testing Market Size Measured Against Other Published Estimates
Published market sizes for water testing can look far apart because teams may count different revenue streams, use different base years, or apply different price and mix assumptions. Differences also come from how much value is assigned to instruments, consumables, and services, and how regional totals are converted into USD.
Testing services bundled inside broader water and wastewater operations sits outside Mordor Intelligence's scope, which is one reason the table shows a spread versus estimates that fold in wider analysis and monitoring revenue. We also found that some published figures lean heavily on a single base year and then apply an aggressive technology adoption curve, which can overstate short-term gains if replacement cycles and consumables intensity are not validated with field feedback.
Benchmark comparison
| Source | Market Size | Gaps in Research Methodology |
|---|---|---|
| Mordor Intelligence | USD 4.83 B (2026) | |
| Industry Publisher A | USD 8.00 B (2025) | Uses a broader offerings view that includes a wider set of instruments and testing services across many sample types, which can lift totals versus a tighter water testing value capture. The stated base year differs, and the implied price and mix uplift appears to assume faster expansion of premium testing technologies. |
| Global Publisher B | USD 5.54 B (2025) | Defines the market as water testing and analysis, and it can include services revenue structures that blend goods sold with analysis delivery, which changes comparability. Year alignment differs from the 2026 benchmark, and regional aggregation choices can shift results when exchange rates and inflation timing are handled differently. |
Overall, the gap is largely explained by what gets counted as test related revenue, plus timing differences between 2025 and 2026 figures. By keeping inputs tied to test frequency, technology mix, and realistic pricing checks from interviews, we end up with a number that is easier to trace back to repeatable drivers.


Key Questions Answered in the Report
What is the projected value of the global water testing market in 2031?
The water testing market is expected to reach USD 6.26 billion by 2031, advancing at a 5.32% CAGR from 2026.
Which geographic region is forecast to grow fastest through 2031?
Asia-Pacific leads growth with a 6.28% CAGR, driven by stricter standards in China, India, and Southeast Asia.
Which test type currently dominates revenue?
Chemical tests held 37.02% of 2025 revenue owing to expanded PFAS and industrial-chemical monitoring.
Why are LC-MS/MS platforms gaining traction?
LC-MS/MS offers sub-ppt detection that new PFAS and endocrine-disruptor rules require, supporting a 5.88% CAGR for the technology.
What are the main factors restraining adoption of advanced instruments?
High capital costs and fragmented regulations increase ownership complexity, slowing upgrades among smaller utilities.
Page last updated on:





