
Global GMO Testing Market Size and Share
Market Overview
| Study Period | 2021 - 2031 |
|---|---|
| Market Size (2026) | USD 4.03 Billion |
| Market Size (2031) | USD 5.18 Billion |
| Growth Rate (2026 - 2031) | 5.17 % |
| Fastest Growing Market | Middle East and Africa |
| Largest Market | Europe |
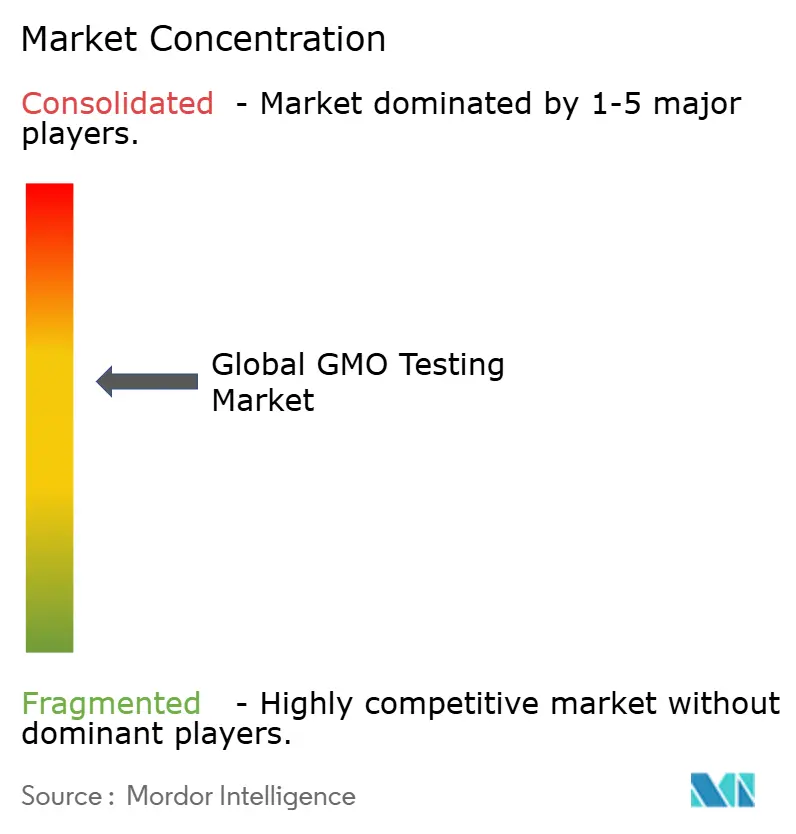
| Market Concentration | Medium |
Major Players
*Disclaimer: Major Players sorted in no particular order Image © Mordor Intelligence. Reuse requires attribution under CC BY 4.0. |
|
Global GMO Testing Market Analysis by Mordor Intelligence
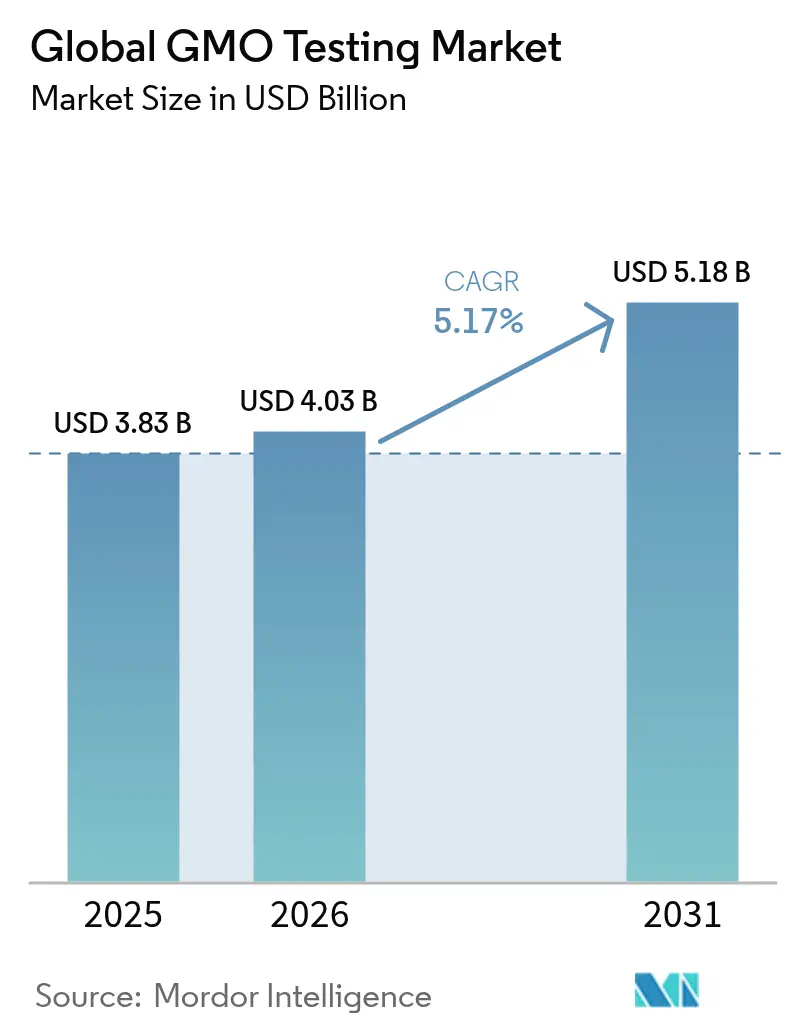
The GMO Testing market size is expected to grow from USD 3.83 billion in 2025 to USD 4.03 billion in 2026 and is forecast to reach USD 5.18 billion by 2031 at 5.17% CAGR over 2026-2031. This growth is driven by increasing regulatory requirements for genetically modified organisms and the wider adoption of bioengineered crops worldwide. According to the United States Department of Agriculture, genetically modified varieties accounted for 96% of soybean acreage planted in 2024, generating significant testing requirements throughout the agricultural supply chain. The growth of organic and natural food markets, which require non-GMO verification, has also increased the demand for GMO testing services. Food manufacturers and agricultural producers are adopting advanced testing technologies to verify product claims, mitigate risks, and ensure consumer confidence. The GMO testing market continues to expand as regulatory frameworks develop and bioengineered crop cultivation increases globally, supported by both compliance requirements and consumer demand.
Key Report Takeaways
- By technology, PCR held 62.65% of the GMO testing market share in 2025, while next-generation sequencing is projected to grow at a 6.32% CAGR through 2031.
- By crop type, corn accounted for 33.78% of the GMO testing market size in 2025; canola is poised for the fastest 6.89% CAGR through 2031.
- By application, processed food testing represented 45.52% of the GMO testing market size in 2025, whereas seed testing is advancing at a 6.18% CAGR through 2031.
- By geography, Europe led with a 30.95% revenue share in 2025, and the Middle East and Africa region is expected to expand at a 6.78% CAGR through 2031.
Note: Market size and forecast figures in this report are generated using Mordor Intelligence’s proprietary estimation framework, updated with the latest available data and insights as of 2026.
Market Trends and Insights
Drivers Impact Analysis of Global GMO Testing Market*
| Driver | (~) % Impact on CAGR Forecast | Geographic Relevance | Impact Timeline |
|---|---|---|---|
| Stringent government regulations for GMO labeling | +1.2% | Global, with strongest impact in European Union and North America | Long term (≥ 4 years) |
| Rising consumer awareness and demand for GMO-free products | +0.9% | North America and the European Union, expanding to Asia-Pacific | Medium term (2-4 years) |
| Rising cultivation of GM corn, soy, cotton, and canola globally | +1.1% | Global, concentrated in Americas and select Asia-Pacific markets | Long term (≥ 4 years) |
| Technological advancements in testing | +0.8% | Global, with early adoption in developed markets | Medium term (2-4 years) |
| Rising adoption of non-GMO labels by food brands | +0.6% | North America and the European Union primarily | Short term (≤ 2 years) |
| Food safety and allergen concerns linked to GMOs | +0.5% | Global, varying by regulatory environment | Medium term (2-4 years) |
| Source: Mordor Intelligence | |||
Stringent Government Regulations for GMO Labeling
The Food and Drug Administration (FDA)'s February 2024 guidance on genome-edited plants established a risk-based assessment approach for both genetically engineered and conventional foods. The National Bioengineered Food Disclosure Standard requires labeling for products with bioengineered ingredients, while the United States Department of Agriculture (USDA) performs annual reviews of bioengineered foods to maintain regulatory alignment. In September 2024, China expanded regulations for genetically modified microorganisms in food processing, requiring safety evaluations for GMM-derived products used as food raw materials. The European Union's Regulation 2023/915 sets maximum contaminant levels in food, requiring precise testing methods to ensure compliance and consumer safety. These regulatory frameworks across multiple jurisdictions drive continuous demand for food testing services as manufacturers work to meet compliance requirements.
Rising Consumer Awareness and Demand for GMO-Free Products
The global GMO testing market is primarily driven by increasing consumer demand for GMO-free and clearly labeled food products. Consumers are becoming more health-conscious, environmentally aware, and ethically minded, leading to greater scrutiny of food production practices, particularly regarding genetically modified organisms (GMOs). Public perception of GMOs remains cautious, with concerns about potential long-term health and environmental effects. This awareness has increased the demand for organic and non-GMO labeled foods, requiring food manufacturers and suppliers to verify their products' non-GMO status through comprehensive testing. According to the Food Standards Agency (UK) in 2024, 28% of respondents in England, Wales, and Northern Ireland expressed significant concerns about genetically modified foods [1]Source: Food Standards Agency (UK), "Level of concern about genetically modified foods", www.food.gov.uk. This data indicates a substantial portion of the population seeking food safety assurance, directly contributing to the increased demand for GMO testing services and verification systems.
Rising cultivation of GM corn, soy, cotton, and canola globally is driving demand for seed and field-level testing
The global expansion of genetically modified (GM) crops, including corn, soy, cotton, and canola, drives market growth. Argentina maintains its position as the third-largest GM crop producer globally, with 100% of cotton and soybean crops and 99% of corn being genetically engineered [2]Source: United States Department of Agriculture (USDA), "Agricultural Biotechnology Annual", www.usda.gov. The country approved five new genetic engineering events in 2023-2024, according to the United States Department of Agriculture (USDA). The USDA's 2024 crop production data indicates corn production of 14.9 billion bushels with record yields of 179.3 bushels per acre, while soybean production reached 4.37 billion bushels. South America has developed into a biotechnology hub, with Brazil and Argentina leading GM crop commercialization and Chile functioning as a major seed export center for global markets. This growth in cultivation creates increased testing requirements, as regulatory authorities mandate GM content verification throughout the supply chain.
Technological Advancements in Testing
Next-generation sequencing (NGS) technologies have improved GMO detection capabilities by providing efficient analysis of whole-genome sequencing data and identification of T-DNA insertion sites compared to traditional Southern blotting methods. Digital PCR (dPCR) advancements are increasing quantification precision, as demonstrated by Mexico's Centro Nacional de Metrologia's development of dPCR assays that enable absolute quantification of GMO content and improve the reliability of certified reference materials used in testing. QIAGEN's expansion of its QIAcuity digital PCR platform with over 100 new validated assays in 2024 shows the industry's commitment to improving detection capabilities for cancer research, infectious diseases, and food safety applications, including GMO detection. CRISPR-Cas13a technology has emerged as a diagnostic tool for rapid plant RNA virus detection, offering high sensitivity and field-deployable applications that may extend to GMO testing. These technological developments have reduced testing costs while improving accuracy and speed, making GMO testing more accessible across market segments.
Restraints Impact Analysis of Global GMO Testing Market*
| Restraint | (~) % Impact on CAGR Forecast | Geographic Relevance | Impact Timeline |
|---|---|---|---|
| High Cost of advanced GMO testing technologies | -0.7% | Global, with greater impact in developing markets | Medium term (2-4 years) |
| Lack of global method harmonisation | -0.5% | Global, particularly affecting international trade | Long term (≥ 4 years) |
| Technical complexity of detecting stacked traits | -0.8% | Global, with highest impact in major GM crop producing regions | Medium term (2-4 years) |
| Inconsistent sampling and quality control practices | -0.7% | Developing markets and regions with emerging regulatory frameworks | Short term (≤ 2 years) |
| Source: Mordor Intelligence | |||
High Cost of Advanced GMO Testing Technologies
The GMO testing market faces significant constraints due to the substantial capital investments required for advanced testing methodologies. Next-generation sequencing platforms and digital PCR systems present major entry barriers for smaller laboratories and emerging market participants. The detection of stacked traits and novel genomic techniques requires sophisticated instrumentation and specialized expertise, creating cost pressures that restrict market access. Bio-Rad Laboratories reported total sales of USD 2.67 billion in 2023, demonstrating the scale of investment required by testing companies to maintain competitive capabilities in molecular diagnostics. Regulatory compliance adds further financial burden, as testing laboratories must maintain certifications and validation protocols that necessitate continuous investment in quality systems and personnel training.
Lack of Global Method Harmonisation
International trade faces challenges due to varying testing standards and regulatory requirements across countries, which affect the efficiency of global food supply chains. Food companies must perform multiple tests for identical products across different markets due to the lack of standardized testing protocols, resulting in increased operational costs and delayed market entry. While regional initiatives like Argentina's International Biosafety Network with Brazil, Paraguay, and Uruguay aim to streamline biosafety assessments, global standardization remains a challenge. The European Union's precautionary regulatory approach differs significantly from the United States' risk-based framework, creating both opportunities and compliance challenges for international food manufacturers. In Africa, countries struggle to establish unified regulatory frameworks, as limited resources and technical expertise restrict their capacity to implement standardized GMO testing protocols.
*Our forecasts treat driver/restraint impacts as directional, not additive. The impact forecasts reflect baseline growth, mix effects, and variable interactions.
Global GMO Testing Market Segment Analysis
By Technology:
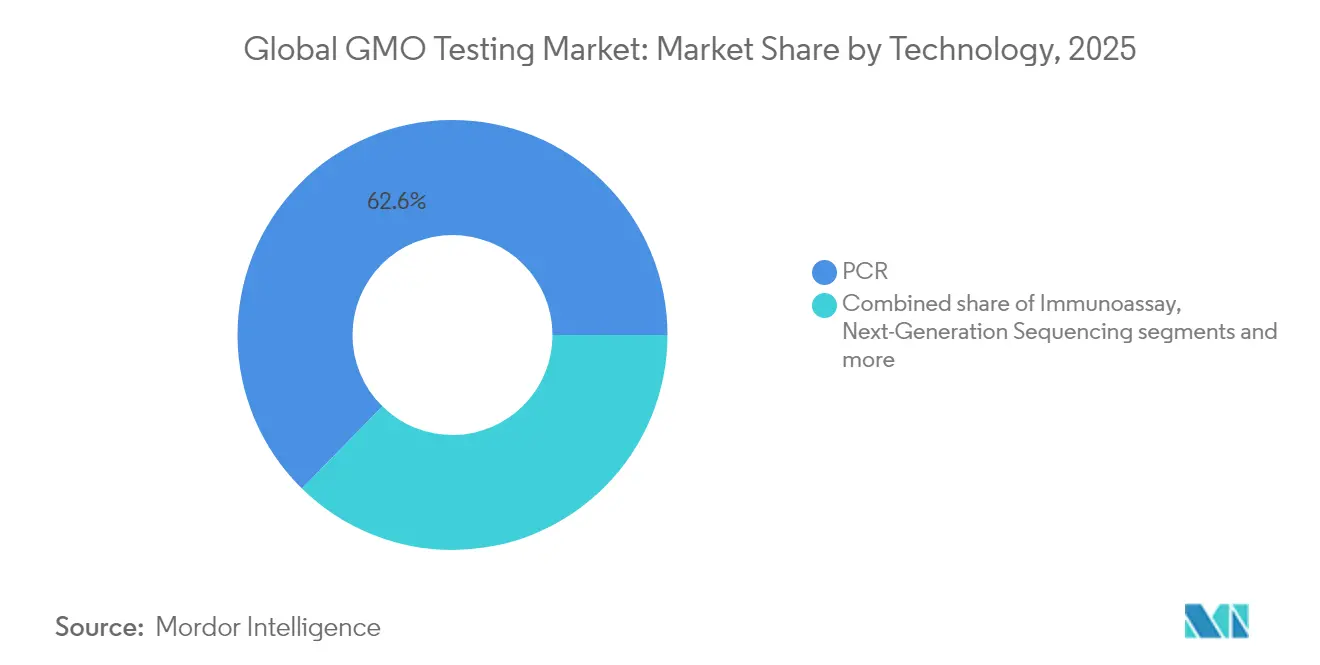
PCR Dominance Faces NGS InnovationPCR technology holds 62.65% market share in 2025, maintaining its dominant position due to its reliability, cost-effectiveness, and widespread adoption in global testing laboratories. The technology's effectiveness in qualitative and quantitative GMO detection makes it the primary choice for compliance testing, especially in developing markets where cost efficiency is essential. Next-generation sequencing shows the highest growth rate at 6.32% CAGR through 2031, driven by increased regulatory acceptance for molecular characterization submissions and its ability to analyze complex genetic modifications. Immunoassay technologies, including ELISA and lateral flow assays, fulfill specific market requirements where rapid screening takes precedence over detailed analysis, particularly in field testing and initial screening procedures.
Biosensor-based rapid tests meet the increasing need for on-site testing capabilities, providing real-time monitoring in agricultural and food processing facilities. The International Conference on GMO Analysis and NGTs in March 2024 highlighted the requirement for enhanced detection methods to address new genomic technique challenges. This development reflects the technology segment's progression toward advanced analytical methods. LGC Biosearch Technologies' IntelliQube automated PCR instrument exemplifies the industry's emphasis on high-throughput multiplexing capabilities, delivering efficient genetic testing and GMO detection with improved sensitivity and consistency.



By Crop Type:
Corn Leadership Challenged by Canola GrowthCorn type holds a 33.78% market share in 2025, as the world's most extensively cultivated GM crop with herbicide tolerance and insect resistance modifications. The crop's genetic modifications, particularly stacked traits that combine multiple resistance mechanisms, necessitate comprehensive testing protocols. Canola type exhibits the highest growth rate at 6.89% CAGR through 2031, driven by increased cultivation in the United States and emerging markets. The United States recorded over 2.7 million harvested acres of canola in 2024, a 15% increase from 2023, according to the United States Canola Association.
Soybean testing constitutes a significant market segment, generating steady testing requirements throughout the agricultural supply chain. Cotton testing fulfills specific market needs where fiber quality and pest resistance modifications require validation, especially in major producing countries like the United States and Argentina. Potato, wheat, and rice testing support developing GM varieties as biotechnology firms expand beyond traditional commodity crops to address nutritional and agronomic needs. Other crops, including specialty vegetables and fruits, present growth opportunities as gene editing advances enable targeted modifications for improved nutritional profiles and shelf life.
By Application:
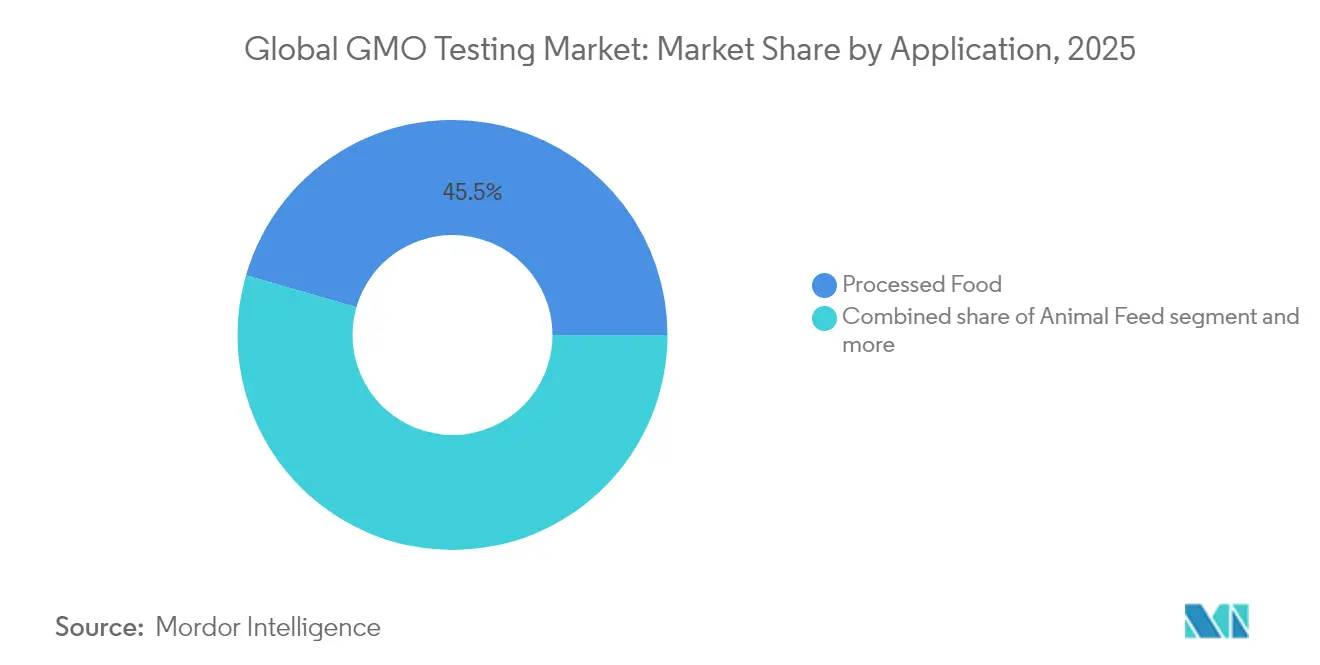
Processed Food Testing Drives Market ValueProcessed food testing holds the dominant position with a 45.52% market share in 2025. This leadership stems from increased consumer demands for transparency and strict regulatory requirements for labeling, which require thorough ingredient verification across supply chains. The segment's prominence reflects the industry's obligation to validate non-GMO claims and meet mandatory disclosure requirements across different regulatory jurisdictions.
Seed testing exhibits the highest growth rate at 6.18% CAGR through 2031. This growth is driven by the expansion of biotechnology companies' genetic modification programs and regulatory requirements for detailed molecular characterization of new varieties. The segment's expansion is supported by increased investment in agricultural biotechnology, focusing on climate-resilient traits, nutritional improvements, and sustainable farming methods.
Geography Analysis
Europe GMO Testing Market
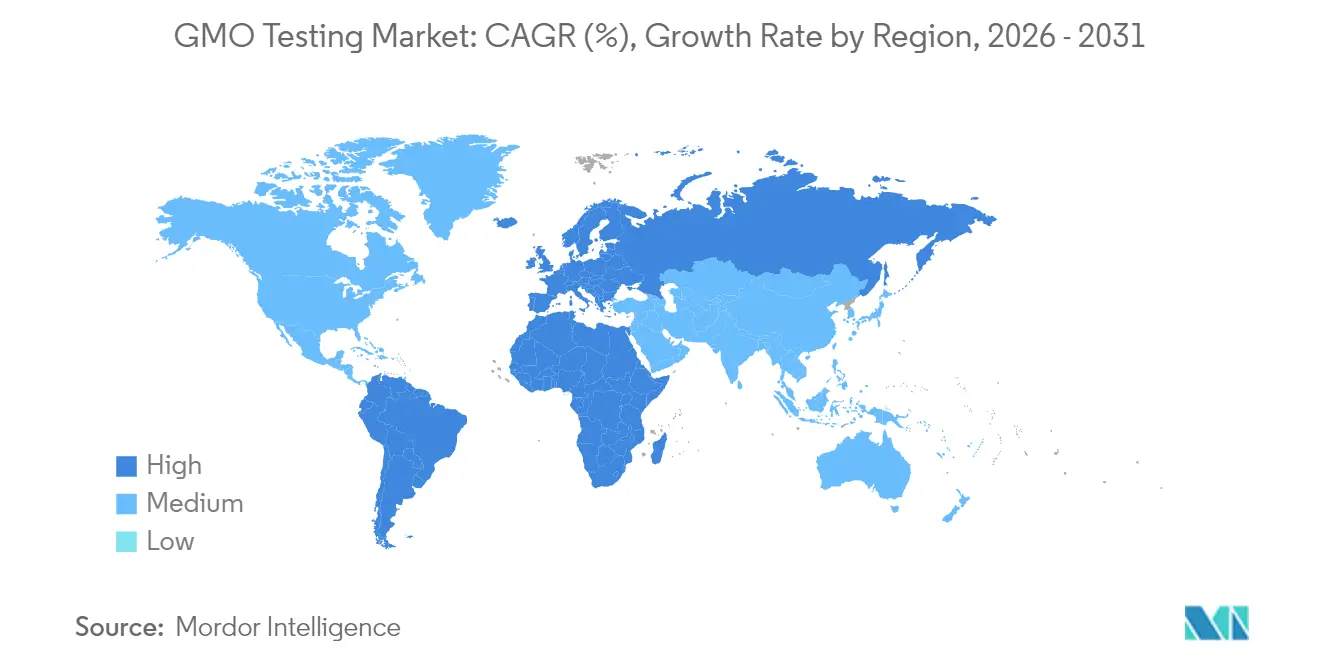
Europe holds a dominant 30.95% market share in 2025, driven by the European Union's comprehensive regulatory framework. This framework mandates labeling for products containing more than 0.9% GMO content and requires thorough safety assessments through the European Food Safety Authority (EFSA)'s evaluation protocols . The region's established regulatory environment generates consistent testing demand as food manufacturers comply with requirements across member states, each with distinct consumer preferences and market dynamics.
MEA GMO Testing Market
The Middle East and Africa region demonstrates the highest growth rate at 6.78% CAGR through 2031. This growth stems from increased agricultural biotechnology adoption and developing regulatory frameworks as countries aim to strengthen food security through enhanced crop varieties. African nations are implementing biosafety regulations for genetic engineering, with varying levels of progress across different countries.
The Americas and APAC GMO Testing Market
North America maintains a significant market presence, with the United States as the primary global GM crop producer and Canada as a major canola and wheat producer. The region's risk-based regulatory approach through the Coordinated Framework for Biotechnology differs from the European Union's precautionary principle, affecting market dynamics and testing protocols. In Asia-Pacific, China's Ministry of Agriculture approved 37 GM corn and 14 GM soybean varieties in October 2023, creating new testing requirements. Japan continues to implement strict monitoring protocols despite positive safety assessments. South America generates substantial testing demand, with Argentina and Brazil leading GM crop production. These countries require extensive testing services due to exports to markets with diverse GMO acceptance levels and regulatory requirements.

Regulatory Landscape
GMO testing demand continues to be shaped by divergent regulatory approaches across major trading blocs. In the European Union, authorization and official controls frameworks rely on event-specific detection, and June 2026 actions reinforced this: Commission Implementing Decision (EU) 2026/1185 authorized marketing of soybean MON 94637 and required validated, event-specific real-time PCR detection methods assessed through the EU reference laboratory system. In parallel, Regulation (EU) 2026/1388 (June 2026) introduced specific provisions for plants obtained by certain new genomic techniques (NGTs) and amended Regulation (EU) 2017/625 on official controls, increasing the need for clear classification, documentation, and fit-for-purpose analytical verification pathways across supply chains.
In North America, oversight remains anchored in the US Coordinated Framework for the Regulation of Biotechnology, spanning FDA, EPA, and USDA, with labeling compliance driven by the National Bioengineered Food Disclosure Standard administered by USDA AMS. In May 2026, USDA APHIS issued a Request for Information on regulatory considerations for certain modified organisms under the Plant Protection Act, signaling continued evolution in how products enter and move through commerce and, by extension, how testing and documentation are organized. Elsewhere, regulators use Codex Alimentarius guidance as a benchmark. For example, Bhutan's Food and Drug Authority published revised GM plant-derived food and feed safety assessment guidelines in March 2026 aligned with Codex (CAC/GL 44-2003 and CAC/GL 45-2003), supporting adoption of internationally recognized assessment and testing practices in emerging markets.
Competitive Landscape
The GMO testing market demonstrates moderate concentration with a score of 6 out of 10, characterized by established global players dominating through extensive laboratory networks and regulatory compliance expertise. Market leaders implement comprehensive vertical integration strategies, combining testing services with consulting and certification capabilities to strengthen client relationships and increase market share. Key players include Eurofins Scientific SE, Intertek Group plc, ALS Limited, Mérieux NutriSciences Corp., and Cotecna Group, who collectively shape market dynamics through their global presence and service portfolios.
Eurofins Scientific's revenue growth to EUR 5.142 billion in the first nine months of 2024 exemplifies the scale advantages achieved through strategic geographic expansion and service diversification. The company's planned acquisition of SGS's crop science operations signals ongoing market consolidation and highlights the industry trend toward strategic mergers and acquisitions to enhance market position and service capabilities. Market players continuously invest in expanding their testing infrastructure and developing specialized expertise to maintain competitive advantages in key regions.
Companies differentiate themselves through strategic technology adoption, investing significantly in automation, digitalization, and advanced analytical capabilities to enhance service quality and operational efficiency. Emerging markets present substantial growth opportunities as regulatory frameworks evolve and local testing capacity remains limited, creating entry points for specialized providers. The integration of artificial intelligence and machine learning in testing workflows enables companies to improve testing accuracy and reduce turnaround times, while blockchain technology implementation strengthens supply chain traceability and testing result verification, providing additional competitive advantages in the market.
Global GMO Testing Industry Leaders
-
Eurofins Scientific SE
-
Intertek Group plc
-
ALS Limited
-
Mérieux NutriSciences Corp.
-
Cotecna Group
- *Disclaimer: Major Players sorted in no particular order
Global GMO Testing Market Companies Covered in this Report
- Eurofins Scientific SE
- Intertek Group plc
- ALS Limited
- Merieux NutriSciences Corp.
- Cotecna Group
- Bio-Rad Laboratories Inc.
- Thermo Fisher Scientific Inc.
- QIAGEN N V
- N.H.P. Laboratories Inc.
- Neogen Corporation
- Bia Diagnostics
- Envirologix Inc.
- Neotron Pharma
- TUV SUD
- FoodChain ID
- SGS Societe Generale de Surveillance SA.
- LGC Group
- Microbac Laboratories Inc.
- Vimta Labs Limited
- Randox Food Diagnostics

Market Opportunities and Future Outlook
Regulatory differentiation between conventional GMOs and NGT-derived products is creating a more targeted whitespace for testing providers that can operationalize fit-for-purpose verification. The EU framework continues to require robust detection, identification, and quantification method submissions for authorizations. Regulation (EU) 2026/1388 (adopted 17 June 2026) also formalized specific provisions for certain NGT plants and amended official controls, which translates into practical demand for compliant sampling plans, method validation, and auditable documentation in cross-border trade. In the United States, the USDA National Bioengineered Food Disclosure Standard allows multiple fit-for-purpose testing approaches and references recognized method frameworks (such as ISO, Codex, and AOAC), supporting service offerings that combine analytical testing with record-keeping and supply-chain assurance for brand and retailer programs.
Technology-driven opportunities are concentrating around method performance, multiplexing, and quantification where conventional PCR panels face limitations for stacked traits and emerging product types. EU Minimum Performance Requirements (MPR) guidance expanding to include digital PCR and considerations for products developed via new genomic techniques points to demand for laboratories that can validate higher-precision quantification and demonstrate comparability across matrices. Service differentiation is also visible in rapid portfolio updates tied to regulatory status and customer standards, including Eurofins GeneScan introducing sensitive screening approaches for soy to detect specific unauthorized events and updating VLOG-compliant analysis packages for soy and rapeseed. These updates reflect commercial pull for certification-aligned test menus and faster turnaround in processed food and ingredient supply chains.
Recent Industry Developments in Global GMO Testing Market
- June 2026: Eurofins highlighted the European Commission authorization of genetically modified soybean MON 94637 for food and feed use. The update aligns lab service menus with newly authorized events, supporting compliant market access for importers and manufacturers handling soy-derived ingredients. It also reinforces the importance of event-specific real-time PCR capability and validated methods in EU-facing supply chains.
- April 2026: Eurofins GeneScan introduced an enhanced GMO analysis strategy for soy to identify HB4 soy, an event not authorized in the EU. This expanded screening helps food and feed operators manage zero-tolerance risk for unauthorized events and reduces the chance of downstream disruptions from non-compliant lots. The move also illustrates how providers adjust assay coverage as the regulatory and trade environment changes.
- January 2026: Eurofins implemented updated VLOG-compliant analysis packages for soy and rapeseed aligned with revised minimum requirements from the German Association Food without Genetic Engineering (VLOG). Standardized packages simplify procurement for manufacturers pursuing non-GMO claims in Germany and adjacent EU markets where private standards complement regulation. The update increases demand for consistent, auditable testing workflows across high-volume commodity ingredients.


Global GMO Testing Market Report Scope and Research Methodology
Market Definition and Coverage
This market covers revenues generated from laboratory and on-site testing used to detect genetically modified material in crops and crop-derived food and feed, including screening and confirmatory workflows carried out for regulatory, labeling, and supply-chain verification.
Scope exclusions: It excludes farm input sales and crop production value, and it also excludes the sales of genetically modified seeds and traits themselves.
Segments Covered in This Report
-
By Technology
- Polymerase Chain Reaction (PCR)
-
Immunoassay
- ELISA
- Lateral Flow
- Next-Generation Sequencing
- Biosensor-based Rapid Tests
-
By Crop Type
- Corn
- Soybean
- Cotton
- Canola
- Potato
- Wheat
- Rice
- Others
-
By Application
- Processed Food
- Animal Feed
- Seed Testing
- Others
-
By Geography
-
North America
- United States
- Canada
- Mexico
- Rest of North America
-
Europe
- Germany
- United Kingdom
- Italy
- France
- Spain
- Netherlands
- Poland
- Belgium
- Sweden
- Rest of Europe
-
Asia-Pacific
- China
- India
- Japan
- Australia
- Indonesia
- South Korea
- Thailand
- Singapore
- Rest of Asia-Pacific
-
South America
- Brazil
- Argentina
- Colombia
- Chile
- Peru
- Rest of South America
-
Middle East and Africa
- South Africa
- Saudi Arabia
- United Arab Emirates
- Nigeria
- Egypt
- Morocco
- Turkey
- Rest of Middle East and Africa
-
North America
Data Sources, Market Sizing, and Validation
Desk Research
Desk research was used to set the market frame and anchor the model to observable signals. We used public and official sources such as USDA for bioengineered food disclosure context, the European Commission and EFSA for GMO rules and testing expectations, Codex Alimentarius guidance for sampling and method practices, and ISO method references (including PCR-related standards) to understand what is counted as testing work.
To translate activity into value, we reviewed company filings, investor presentations, laboratory accreditation and method notes, and reputable press coverage on food testing demand. In parallel, paid subscriptions were used for company financials and intelligence, patent databases, and shipment-level import-export checks when they helped confirm test kit flows and lab service exposure. These desk sources are not exhaustive, and additional public documents and data points supported data collection, validation, and clarification.
Primary Interviews and Surveys
Primary work focused on interviews and short surveys with testing laboratories, method developers, and food and feed quality teams that commission tests, where pricing and repeat-test behavior can be discussed in practical terms. Since this is a global market, interviews were spread across APAC, EMEA, and the Americas, so regional labeling rules, crop mix, and trade-linked testing demand could be cross-checked before assumptions were finalized.
This respondent input was used to refine how confirmatory testing is triggered, how often positives lead to re-testing, and how routine screening volumes translate into billed samples.
Distribution of primary research fieldwork respondents
| Company type | Respondent position | Region |
|---|---|---|
| Top tier: 34% | CXOs: 13% | APAC: 48% |
| Mid tier: 50% | Functional/Unit leaders: 38% | EMEA: 31% |
| Smaller Players: 16% | Managers: 49% | Americas: 21% |
Market-Sizing & Forecasting
For sizing, a top-down build was used where testing demand was reconstructed from regulated and voluntary verification needs across key crop and food flows, then translated into value through typical test mixes and price ranges. Totals were corroborated with selective bottom-up checks using sampled lab revenue splits, service menu price points, and volume proxies from channel conversations, which helped adjust outliers.
Inputs that shaped the model included the share of labeled and identity-preserved supply chains, the mix of PCR versus immunoassay and strip tests used in routine screening, retest rates when positives appear, average samples per batch for processed foods and feed, and regional differences in accreditation and reporting requirements. Where direct volume signals were weak, gaps were handled using proxy indicators such as export-oriented commodity movements and the installed base of accredited labs, and then narrowing the range through interview feedback.
Forecasts were developed using scenario analysis, because regulation changes and trade disruptions can shift testing demand quickly. The forward view projected key drivers (crop acreage under bioengineered traits, labeling enforcement intensity, and non-GMO claim growth), then applied expert-validated shifts in method mix and pricing to reach the final year-by-year values.
Data Validation & Update Cycle
Validation was done through multiple passes, starting with internal consistency checks on volumes, prices, and method shares, then moving to variance checks by region and application. Outputs were compared against independent signals, including lab accreditation counts, regulatory testing requirements, and import-export patterns that typically drive verification testing.
When an anomaly appeared, the underlying assumption was revisited, and respondents were re-contacted if the mismatch could not be explained by seasonality or method shifts. Reports refresh annually, with interim updates made when material events occur, such as major labeling rule changes or sharp commodity trade shifts. Before delivery, an analyst completes a final review so clients receive the most current view that can be supported by clear inputs.
Mordor Intelligence's Gmo Testing Market Size Versus Other Published Estimates
Published numbers for GMO testing often differ because the scope line is drawn differently, and because test pricing and method mix assumptions are not always stated in a consistent way. Differences also show up from the base year used and from how quickly each model is refreshed after regulation or trade shifts.
Testing for adjacent food safety categories, like pathogen and contaminant panels, sits outside Mordor Intelligence's scope here, which keeps the total tied to GMO detection work (PCR, immunoassay, and strip-based workflows) rather than broader lab revenue. Other estimates may also treat test revenues as only services or only kits, then use a single global average price that does not capture regional accreditation costs and repeat-testing behavior.
Benchmark comparison
| Source | Market Size | Gaps in Research Methodology |
|---|---|---|
| Mordor Intelligence | USD 4.03 B (2026) | |
| Industry Publisher A | USD 2.52 B (2024) | Uses an earlier base year and appears to treat GMO testing as a narrower service-only activity, with limited allowance for confirmatory retests and regional method mix differences. |
| Market Tracker B | USD 2.23 B (2024) | Frames the market as GMO testing services and may exclude test kits and routine screening workflows, which can lower totals when PCR and immunoassay screening volumes are material. |
The spread across published values is mainly explained by what is included around services versus kits, how much routine screening is counted, and whether nearby food testing categories are bundled in. By keeping the inputs tied to observable demand triggers and by checking price and method assumptions with practitioners, the resulting estimate remains traceable and repeatable for planning discussions.


Key Questions Answered in the Report
What is the current value of the GMO testing market?
The GMO testing market is valued at USD 4.03 billion in 2026 and is projected to reach USD 5.18 billion by 2031.
Which technology holds the largest GMO testing market share?
PCR remains dominant with a 62.65% share in 2025, favored for its cost-effectiveness and regulatory acceptance.
Which geographic region is growing fastest in GMO testing demand?
The Middle East & Africa region is expanding at a 6.78% CAGR through 2031 as countries adopt biotech crops to bolster food security.
Why is processed food testing the biggest application segment?
Mandatory labeling rules and consumer transparency demands require end-product verification, giving processed foods a 45.52% revenue share in 2025.
Page last updated on:


 Your data is secure and never sold or shared.


