
Market Overview
| Study Period | 2021 - 2031 |
|---|---|
| Market Size (2026) | USD 289.41 Billion |
| Market Size (2031) | USD 391.68 Billion |
| Growth Rate (2026 - 2031) | 6.23% CAGR |
| Fastest Growing Market | Asia Pacific |
| Largest Market | Asia Pacific |
| Market Concentration | Medium |
Major Players
*Disclaimer: Major Players sorted in no particular order Image © Mordor Intelligence. Reuse requires attribution under CC BY 4.0. |
|
Dehydrated Food Market Analysis by Mordor Intelligence
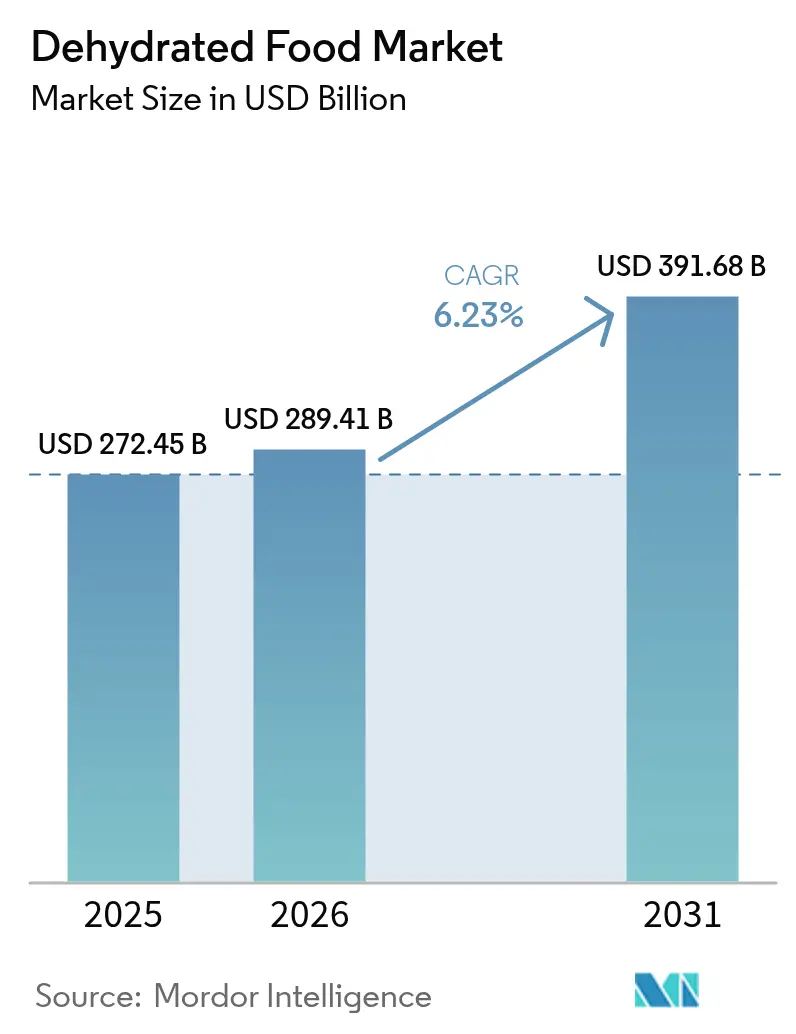
The dehydrated food market size was valued at USD 272.45 billion in 2025 and estimated to grow from USD 289.41 billion in 2026 to reach USD 391.68 billion by 2031, at a CAGR of 6.23% during the forecast period (2026-2031). This growth rests on several converging forces that favor shelf-stable nutrition, including urban lifestyles, advanced drying technologies, and efficiency gains in industrial food processing. According to the Natural Resources Institute Finland, in 2024, the consumption of smoked, salted, or dried fish was 0.6 kilograms per capita[1]Source: Natural Resources Institute Finland, "Consumption of food commodities per capita (kg/year)", statdb.luke.fi. Consumer preference for convenient formats is aligning with outdoor recreation trends, while clean-label demand pushes producers toward natural formulations that still deliver long shelf life. Spray-drying remains the backbone technology because it balances cost, quality, and throughput, yet capital is flowing into hybrid systems that promise energy savings and better nutrient retention. Asia-Pacific leads adoption, helped by vast raw-material bases and rising disposable incomes, whereas North America leverages its mature outdoor segment and Europe capitalizes on organic positioning to defend price premiums. Risks revolve around energy-intensive operations, raw-material volatility, and evolving global food-safety rules that raise compliance costs.
Key Report Takeaways
- By drying technology, spray-drying commanded 38.05% of the dehydrated food market share in 2025, while freeze-drying is forecast to advance at a 7.12% CAGR to 2031.
- By product category, fruits and vegetables held 31.76% of the dehydrated food market size in 2025, while nutraceutical and functional powders are forecast to advance at an 8.74% CAGR to 2031.
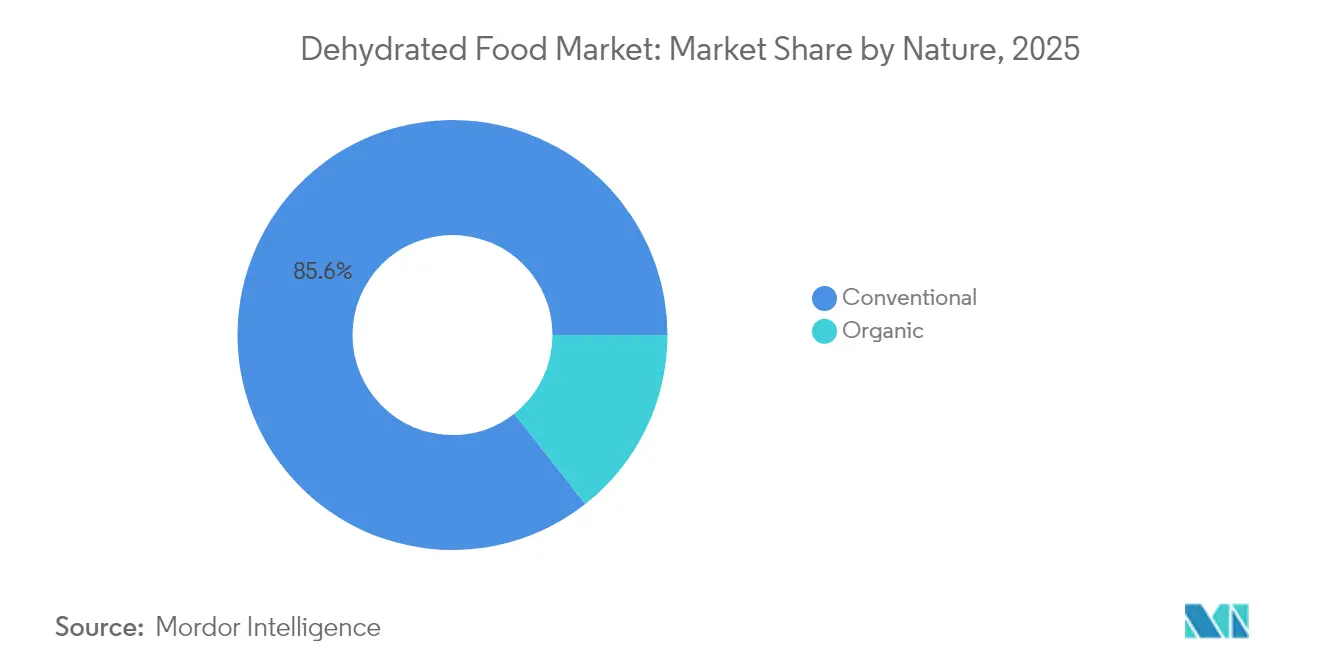
- By nature, the conventional segment captured 85.60% of the dehydrated food market size in 2025, while organic products are forecast to advance at a 15.05% CAGR to 2031.
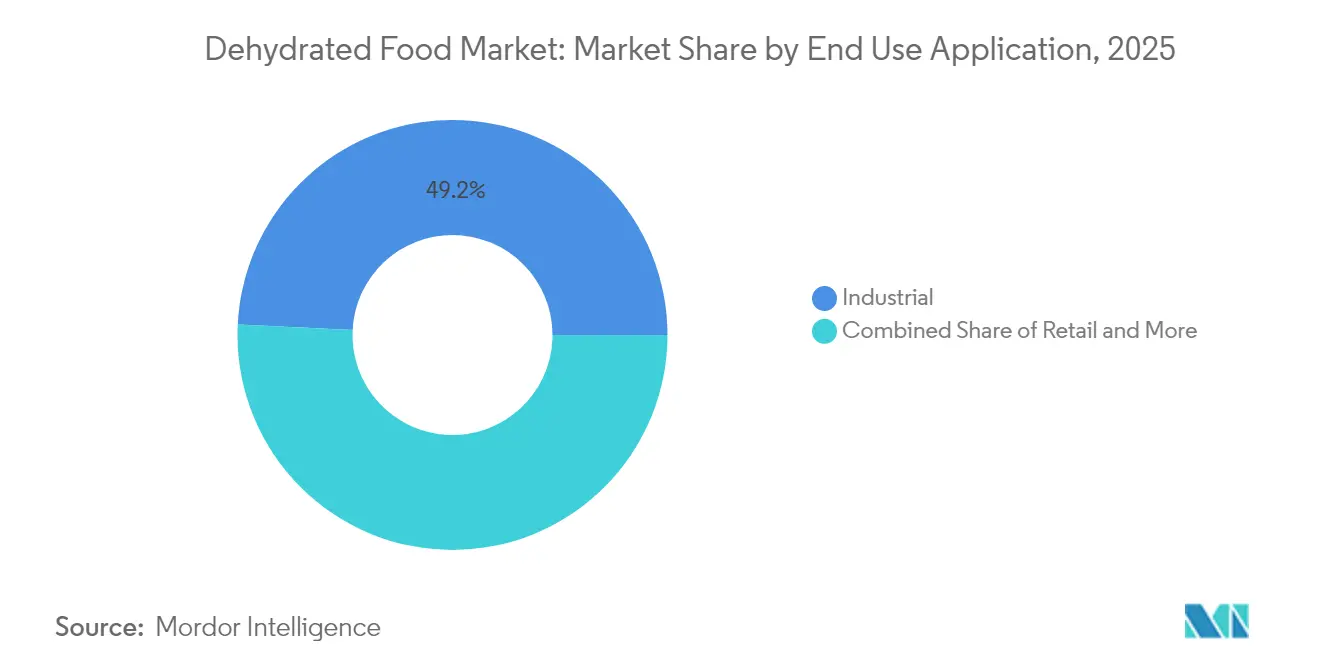
- By end use, industrial applications accounted for 49.22% of the dehydrated food market size in 2025, while retail is forecast to advance at an 8.07% CAGR to 2031.
- By geography, Asia-Pacific led with 39.18% of the dehydrated food market share in 2025 and is forecast to advance at a 7.42% CAGR to 2031.
Note: Market size and forecast figures in this report are generated using Mordor Intelligence’s proprietary estimation framework, updated with the latest available data and insights as of 2026.
Global Dehydrated Food Market Trends and Insights
Drivers Impact Analysis*
| Driver | (~) % Impact on CAGR Forecast | Geographic Relevance | Impact Timeline |
|---|---|---|---|
| Demand for Convenience and Long Shelf-Life | +1.8% | Global, with the strongest impact in North America and Asia-Pacific | Medium term (2-4 years) |
| Growth in Outdoor and Adventure Activities | +1.2% | North America and Europe core, expanding to Asia-Pacific | Short term (≤ 2 years) |
| Innovation in Drying Technologies | +1.0% | Global, led by developed markets | Long term (≥ 4 years) |
| Consumer Focus on Clean Label and Natural Products | +0.9% | North America and Europe, spreading globally | Medium term (2-4 years) |
| Sustainability Concerns and Packaging Innovation | +0.7% | Europe-led, expanding to North America and Asia-Pacific | Long term (≥ 4 years) |
| Stringent Food Safety and Quality Regulations | +0.6% | Global, with varying implementation timelines | Medium term (2-4 years) |
| Source: Mordor Intelligence | |||
Demand for Convenience and Long Shelf-Life
Urbanization and evolving consumer lifestyles are reshaping food preferences, with dehydrated products leading the way in convenience and longevity. Post-pandemic, there's been a notable shift towards on-the-go eating. Working professionals and busy families now favor foods that are quick to prepare yet nutritionally rich. Dehydrated foods cater to this demand, boasting shelf lives of up to 25 years for freeze-dried variants, a stark contrast to the mere days or weeks of fresh products. This extended shelf life is especially valuable for emergency preparedness, prompting governments and institutions to stockpile dehydrated foods as strategic reserves. For instance, according to the International Trade Centre, the value generated from the import of dried vegetables in the United Kingdom increased by GBP 6.8 million (+8.23%) in 2024 in comparison to the previous year. With GBP 89.9 million, the value is its highest in the past decade[2]Source: International Trade Centre, "Value of dried vegetables imported to the United Kingdom", www.trademap.org . Beyond individual consumers, institutional foodservice operations are reaping the benefits of dehydrated ingredients. These ingredients not only cut storage costs and reduce waste but also ensure consistent menu execution across various locations. Innovations in packaging, such as resealable pouches and portion-controlled servings, further bolster the appeal, allowing consumers to use products gradually without sacrificing quality.
Growth in Outdoor and Adventure Activities
As the outdoor recreation industry grows, there's a rising demand for lightweight, nutrient-rich food solutions tailored for hiking, camping, and adventure sports aficionados. The Outdoor Foundation reports that in 2024, over 56 million Americans aged six and up went camping, marking a significant uptick from participation rates of previous decades[3]Source: Outdoor Foundation, "2025 Sports, Fitness, and Leisure Activities Topline Participation Report", sfia.users.membersuite.com. Reflecting this trend, Mountain House's 2024 brand refresh introduced flavors like Chicken Tikka Masala and Kung Pao Chicken, showcasing how established brands are evolving to resonate with younger, socially media-savvy audiences. The adventure food segment capitalizes on the weight-to-nutrition advantage of dehydration: freeze-dried meals can weigh up to 90% less than their fresh counterparts, yet retain most of their nutritional value. This weight benefit is vital for backpackers and outdoor enthusiasts who need to pack food for multiple days. The market is also seeing innovations in flavor and convenience, with brands crafting meals that only need hot water and minimal cleanup. Furthermore, the rising allure of van life and overlanding has broadened the target audience. Beyond just traditional backpackers, car campers and RV travelers now appreciate the storage efficiency and easy preparation of dehydrated foods.
Innovation in Drying Technologies
Technological advancements in dehydration processes are enhancing product quality, boosting energy efficiency, and expanding processing capabilities. A notable innovation, spray freeze drying, merges the benefits of traditional freeze-drying and spray-drying. This method yields high-quality, stable powders ideal for thermosensitive foods and bioactive ingredients. The global market for spray freeze drying equipment signals robust industrial investments in these advanced processing technologies. Another breakthrough, Refractance Window drying technology, operates at lower temperatures yet achieves superior thermal efficiency over conventional methods, making it a prime choice for heat-sensitive products. As processing costs climb, the push for energy efficiency becomes paramount. Innovations like waste heat recovery systems are leading the charge, boasting 38% gains in energy efficiency and a 34% cut in carbon emissions. Such technological strides empower processors to uphold product quality while trimming operational costs, positioning dehydrated foods as formidable competitors to their fresh counterparts.
Consumer Focus on Clean Label and Natural Products
As the clean label movement gains momentum, the dehydrated food sector is witnessing a significant shift in product formulations. Consumers are increasingly steering clear of artificial preservatives, additives, and processing aids. The International Food Information Council reported that in 2023, about 29% of U.S. respondents regularly purchased food and beverages labeled with "clean ingredients." This inclination is especially evident in the organic segment, with projections indicating growth in the organic snack market. Furthermore, the USDA's Strengthening Organic Enforcement rule bolsters oversight of organic products, mandating enhanced recordkeeping and traceability to thwart food fraud. This move not only strengthens the integrity of organic dehydrated products but also bolsters consumer trust. In response to these trends, manufacturers are pivoting away from chemical preservatives like sulfur dioxide, opting instead for natural preservation methods and advanced packaging technologies. Ingredient sourcing is also evolving, with companies such as Seawind Foods championing GMO-free, clean-label dehydrated vegetables and fruits tailored for industrial food processors. Moreover, as functional food applications hone in on specific benefits like mood enhancement and cognitive performance, dehydrated ingredients are emerging as pivotal components in these targeted formulations.
Restraints Impact Analysis*
| Restraint | (~) % Impact on CAGR Forecast | Geographic Relevance | Impact Timeline |
|---|---|---|---|
| Competition from Fresh or Minimally Processed Foods | -0.8% | Global, strongest in developed markets | Short term (≤ 2 years) |
| High Energy Consumption in Dehydration Processes | -1.2% | Global, particularly in energy-intensive regions | Medium term (2-4 years) |
| Rising Raw Material Costs and Price Volatility | -1.5% | Global, with regional variations | Short term (≤ 2 years) |
| Limited Adoption of Sustainable Processing | -0.4% | Europe and North America focus | Long term (≥ 4 years) |
| Source: Mordor Intelligence | |||
Competition from Fresh or Minimally Processed Foods
As global cold chain infrastructure advances and consumers lean towards "natural" food experiences, the dehydrated food sector grapples with stiff competition from fresh and minimally processed alternatives. Fresh produce, lauded for its superior taste, texture, and nutritional benefits, poses a challenge for dehydrated products, which struggle to assert their value beyond convenience and shelf stability. This competition is especially pronounced in developed markets, where consumers not only have year-round access to fresh foods but are also inclined to pay a premium for perceived quality. Meanwhile, minimally processed offerings, like fresh-cut vegetables and ready-to-eat salads, straddle the line, merging convenience with fresher sensory attributes, and directly challenging dehydrated products in specific uses. Retailers face a particular challenge, vying for shelf space and consumer attention against the allure of fresh options. Yet, this competitive landscape fuels innovation within the dehydrated sector, urging manufacturers to enhance rehydration, flavor retention, and nutritional preservation, thereby bridging the gap with their fresh counterparts.
Rising Raw Material Costs and Price Volatility
In 2024, sugar prices hit their highest point since 2011, marking a 0.8% uptick in January alone. This surge has had a direct ripple effect on the prices of dehydrated fruits and confectionery products. For most processors, raw material costs account for 60-70% of total production expenses. The USDA has projected a 3.4% rise in food prices for 2025. Notably, categories like sugar and sweets are anticipated to see a sharper increase of 6.4%. This poses a challenge for manufacturers, as they grapple with passing these heightened costs onto consumers who are increasingly price-sensitive. Geopolitical tensions, especially the ongoing conflict in Ukraine, have been a significant disruptor, affecting grain exports and the flow of agricultural commodities. Compounding this, climate change is casting a shadow of uncertainty over major growing regions. New tariff policies in the US are poised to escalate costs for certain ingredients that are hard to substitute. Vanilla is facing a steep 47% tariff, while cashew nuts are not far behind at 46%. These tariffs have direct implications on specialty dehydrated product formulations. Additionally, energy costs, which constitute 15-20% of dehydration processing expenses, are adding to the volatility, especially as global energy markets remain in flux.
*Our forecasts treat driver/restraint impacts as directional, not additive. The impact forecasts reflect baseline growth, mix effects, and variable interactions.
Segment Analysis
By Drying Technology: Spray-Drying Dominance Drives Industrial Applications
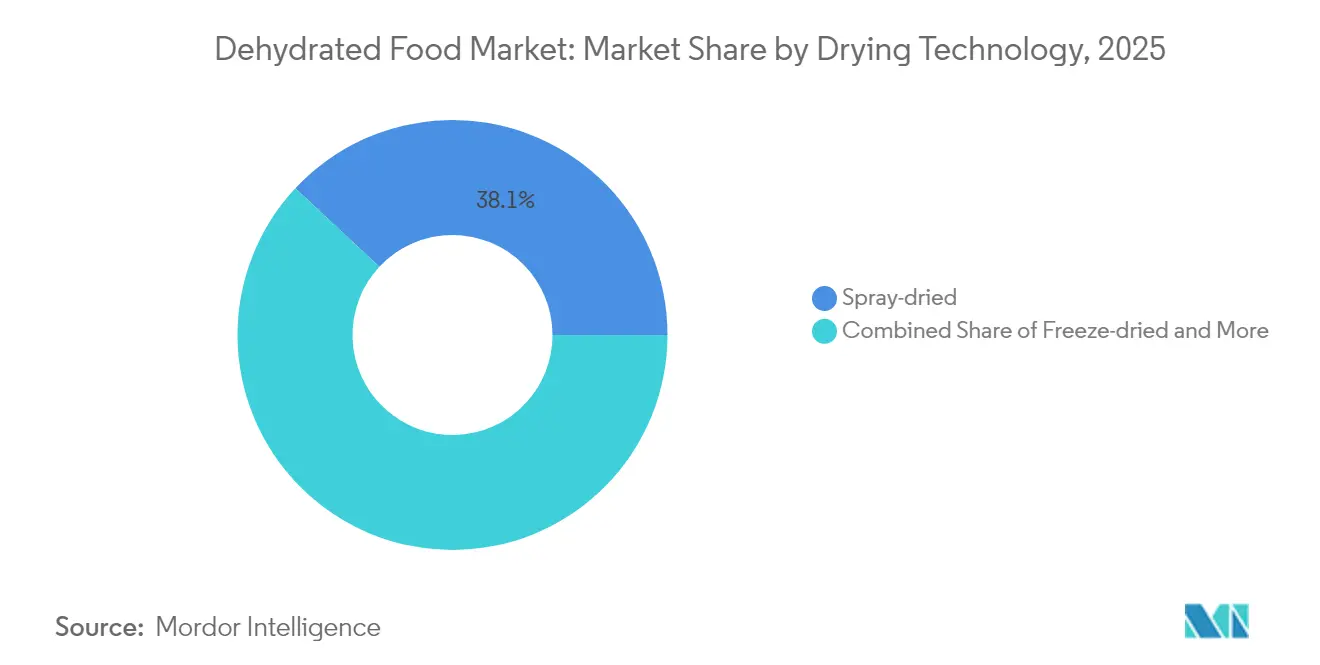
In 2025, spray-drying technology captures a 38.05% share of the market, underscoring its adaptability and cost-efficiency in a range of food applications, spanning from dairy powders and instant beverages to pharmaceutical excipients. This technology's leading position is attributed to its proficiency in managing heat-sensitive materials, all while ensuring a consistent particle size distribution and high solubility, both crucial for industrial food processing. While freeze-drying is expected to grow at a 7.12% CAGR, it commands a premium due to its exceptional nutrient retention and rehydration capabilities. This makes freeze-drying the go-to choice for high-value applications, such as outdoor adventure foods and certain pharmaceuticals. Meanwhile, vacuum-drying and sun/solar-drying methods cater to specialized niches. Solar drying, despite its lower efficiency compared to mechanical methods, is garnering attention for its sustainability advantages.
Market evolution is being propelled by innovations in spray-drying equipment. For instance, Hosokawa Micron is pioneering DMR flash dryers that seamlessly integrate drying, milling, and classifying into a single unit, leading to optimized energy consumption and reduced operational costs. Additionally, the rise of spray freeze drying as a hybrid technology marks a significant advancement, merging the benefits of both spray-drying and freeze-drying to yield high-quality powders suitable for thermosensitive applications. Furthermore, regulatory compliance is playing an increasingly pivotal role in technology selection. Notably, FDA guidelines for low-moisture ready-to-eat foods underscore the necessity of validated drying processes to guarantee pathogen elimination and ensure product safety.



By Product Category: Fruits and Vegetables Lead Health-Conscious Consumption
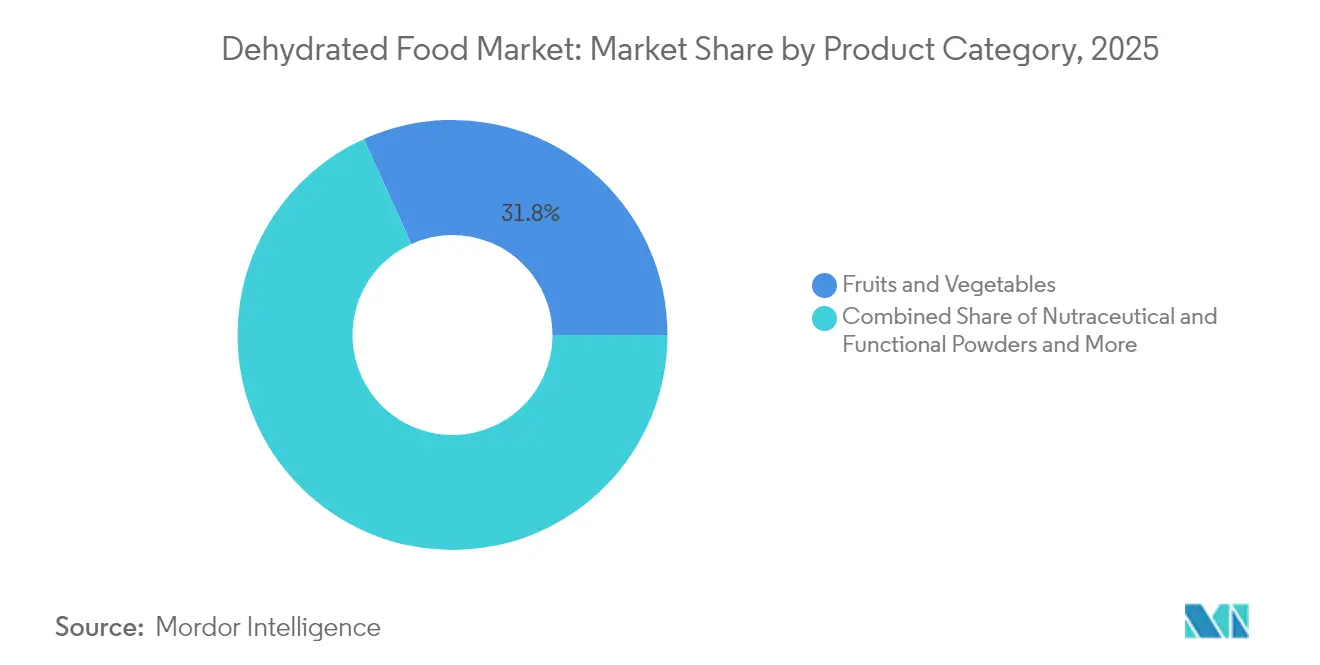
In 2025, health-conscious trends and the versatility of fruits and vegetables in snacking, cooking, and foodservice applications drive the segment to capture a 31.76% market share. The natural allure of plant-based nutrition, combined with dehydration techniques that intensify flavors and significantly prolong shelf life, bolsters this segment's appeal. Meanwhile, nutraceutical and functional powders emerge as the fastest-growing segment, growing at an 8.74% CAGR, underscoring the surging demand for specialized nutrition and the expanding functional food market. Additionally, meat and seafood products enjoy consistent demand, especially in niche areas like outdoor recreation and emergency preparedness.
Highlighting category dynamics, the European dried mango market anticipates a sustainable annual growth, spurred by a shift towards healthier snacking. However, economic factors pose potential short-term challenges. Germany and the UK dominate European consumption, with Germany particularly excelling in organic dried fruit sales. Companies are harnessing dehydration technology in prepared meals and soups, crafting advanced flavor systems that retain their appeal post-rehydration. Furthermore, the instant coffee and beverage sector witnesses innovations, such as Nestlé's cutting-edge freeze-drying technology, tackling clumping challenges in cold coffee applications.
By Nature: Conventional Processing Maintains Dominance Despite Organic Growth
In 2025, conventional processing methods dominate the market with an 85.60% share, bolstered by established supply chains, cost advantages, and widespread consumer acceptance, especially in price-sensitive segments. Leveraging economies of scale in both processing and raw material sourcing, the conventional segment offers competitive pricing, facilitating its mass market penetration. While organic dehydrated foods are expected to grow at a 15.05% CAGR, they're witnessing rapid growth as consumers lean towards natural and sustainably sourced options. Notably, the organic segment commands premium pricing.
To bolster the integrity of the organic market, regulatory frameworks are tightening. For instance, the USDA's Strengthening Organic Enforcement rule mandates improved recordkeeping and traceability to thwart fraud and bolster consumer trust. Yet, the organic segment grapples with distinct hurdles in dehydration processing. Organic certification constraints limit the adoption of certain processing aids and preservation techniques prevalent in conventional methods. Furthermore, the complexity of the supply chain for organic products is heightened by segregation mandates and a scarcity of organic raw materials, especially specialty ingredients. On the upside, there's a burgeoning institutional demand for organic dehydrated ingredients, with foodservice operators and manufacturers keen to align with the consumer shift towards clean-label products.
By End Use Application: Industrial Dominance Reflects B2B Market Strength
In 2025, industrial applications dominate with a 49.22% market share, highlighting the dehydrated food market's pivotal role as a supplier to food manufacturers, rather than merely catering to end consumers. This industrial dominance is attributed to the efficiency benefits dehydrated ingredients offer food processors, such as lower storage costs, prolonged shelf life, and the consistent quality vital for large-scale production. While the retail segment is expected to grow at an 8.07% CAGR, it boasts significant growth potential, driven by rising consumer awareness and expanding distribution channels. Meanwhile, foodservice applications find themselves in a balanced position, reaping the benefits of operational efficiencies and menu consistency afforded by dehydrated ingredients.
Companies like Seawind Foods epitomize the industrial segment's prowess, having carved out a substantial niche by supplying dehydrated vegetables and fruits to global food processors, further bolstered by international joint ventures. Supermarkets and hypermarkets lead the charge in retail distribution, yet online retail is swiftly gaining ground, thanks to enhanced product visibility and consumer education via e-commerce platforms. Specialty stores cater to niche markets, focusing on premium outdoor recreation products and organic selections. Notably, convenience stores are emerging as key distribution hubs, especially for single-serve dehydrated snacks and meal solutions, catering to the on-the-go consumer.
Geography Analysis
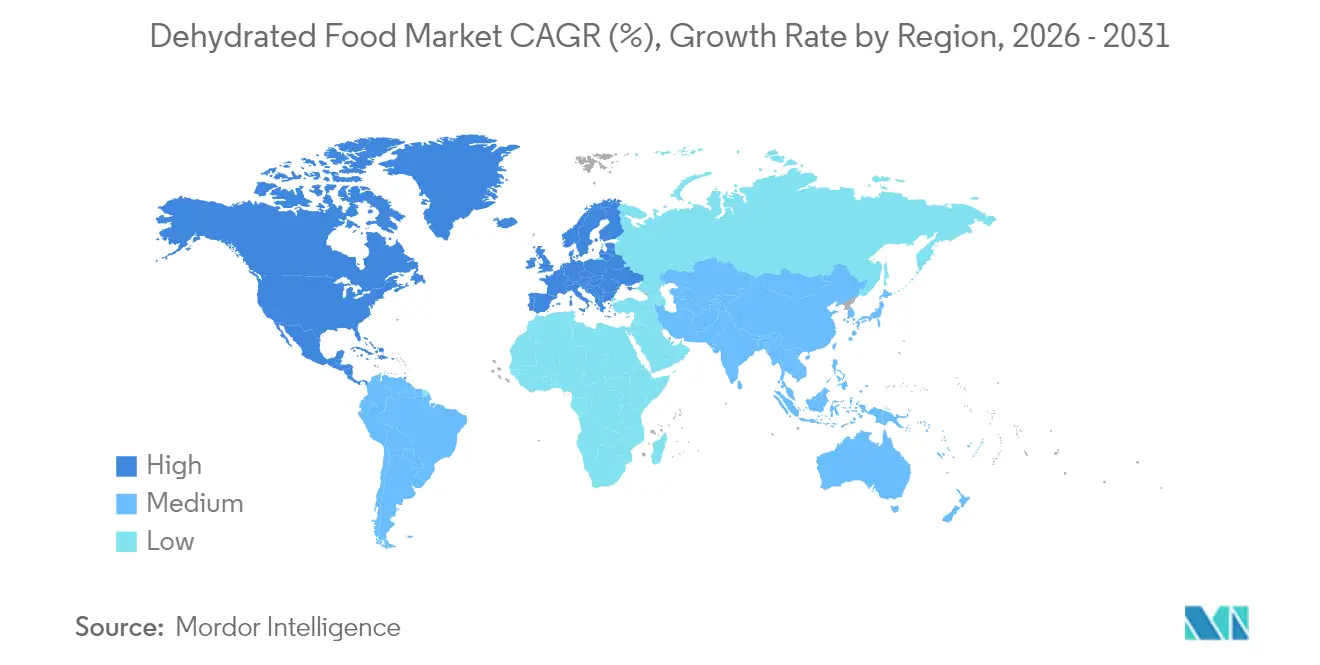
In 2025, Asia-Pacific dominated the dehydrated food market, claiming a 39.18% share, driven by robust fruit and vegetable yields and surging urban demand in China, India, and Southeast Asia. Despite this, processing remains underutilized; for instance, India currently dehydrates low quantities of its horticultural output, highlighting significant room for growth. To mitigate post-harvest losses, which can be substantial, regional governments are promoting value-added exports. There's a noticeable uptick in investments for mid-scale dryers close to farm clusters, with the resultant powders gaining traction in instant noodles and spice blends.
North America, bolstered by a deep-rooted outdoor recreation culture and a sophisticated specialty retail network, commands a substantial market share. Brands are increasingly turning to direct-to-consumer avenues, allowing them to swiftly gauge flavor preferences and cultivate communities centered around adventure travel. Furthermore, with the FDA providing clear guidelines on preventive measures for low-moisture foods, investments are flowing into new plants. These facilities boast the versatility to handle dairy, plant protein, and beverage powders, all while ensuring there's no risk of cross-contamination.
Europe's market stance is firmly anchored in organic and sustainability principles. Stringent environmental mandates are nudging suppliers towards adopting energy-efficient dryers and using recyclable mono-material pouches. Consumers are willing to pay a premium, provided there's transparency and carbon labeling on products. Additionally, Europe's enforcement of standardized contaminant limits fosters a stable trade landscape, enticing non-EU exporters to prioritize compliance and certification.

Regulatory Landscape
Regulation for dehydrated foods is shaped by a mix of national food-safety rules and Codex Alimentarius benchmarks used in cross-border trade. At the international level, Codex standards and hygiene guidance (including the Code of Hygienic Practice for Dehydrated Fruits and Vegetables, CXC 5-1971) provide reference points for controls around contaminants, processing hygiene, and permitted additives. In November 2025, the Codex Alimentarius Commission (48th Session) adopted and amended elements that affect dehydrated categories, including standards tied to dehydrated garlic (CXS 347-2019) and dried chilli pepper/paprika (CXS 353-2022). This reinforces the need for suppliers to keep specifications and additive systems aligned for export-facing SKUs.
Country-level updates can materially change compliance requirements for moisture limits, microbiological criteria, and labeling and traceability obligations. China notified a draft national food safety standard covering dried fruit and dried vegetable to the WTO/SPS system in July 2024, which signals potential revisions versus older national hygiene requirements. In the United States, FSMA preventive controls continue to anchor compliance for shelf-stable foods, while the Food Traceability Rule enforcement timing has shifted, as an FY2026 appropriations restriction (P.L. 119-37) limits enforcement of the rule until July 2028. Emerging markets are also codifying product-specific requirements, including Uganda developing a dehydrated garlic specification (DEAS 1341:2026) that references Codex CXS 347-2019, tightening documentation and certificate needs for regional trade.
Competitive Landscape
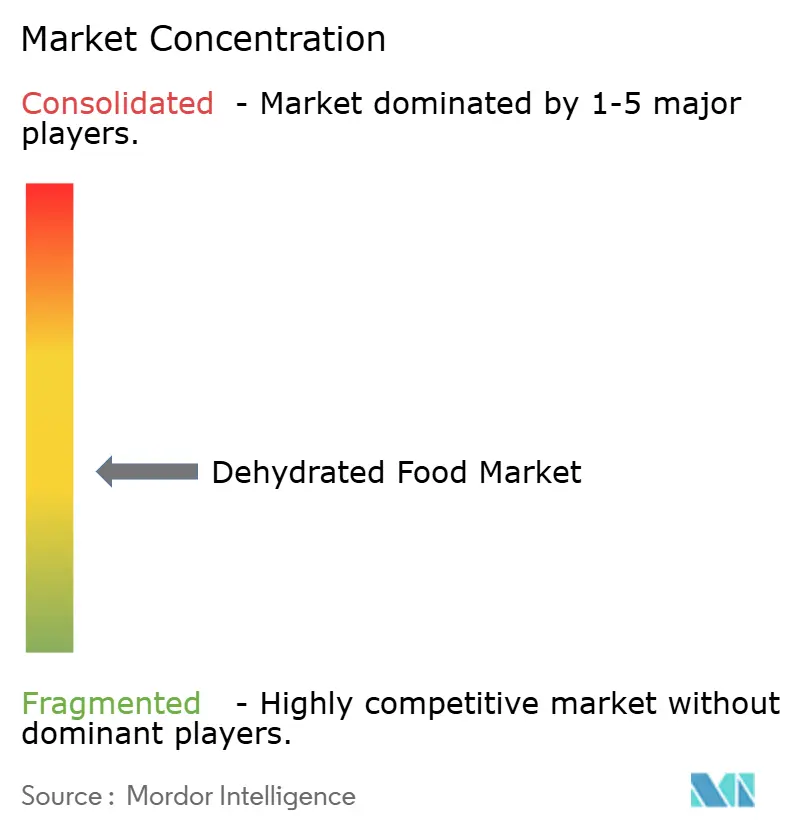
The competitive landscape remains moderately fragmented. Multinationals such as Nestlé SA, Ajinomoto Co. Inc., and OFD Foods LLC boast scale, diverse portfolios, and expansive global distribution networks. Yet, their collective market share hovers below 40%, paving the way for regional specialists. These specialists hone in on niches like fruit powders, specialty coffee, and ethnic cuisine mixes. The capital-intensive nature of spray-drying lines is driving consolidation. A prime example is Mars Incorporated’s USD 35.9 billion acquisition of Kellanova in 2024, a strategic move to bolster its snacking platform.
Technology differentiation is surfacing as a pivotal strategy. Firms that secure patents for energy-efficient dryers or unique encapsulation systems often land long-term contracts. Beverage giants, in turn, seek these innovations for enhanced flavor stability. A notable uptick in intellectual-property filings for refractance window systems hints at their growing acceptance. Furthermore, sustainability claims are reshaping tender processes. Buyers now evaluate suppliers based on the carbon intensity of each ton of finished powder.
Regional players are capitalizing on their proximity to raw-material sources. In China, firms are delving into fruit farming, ensuring a steady feedstock supply. Meanwhile, exporters in Chile are artfully packaging berry powders, weaving in narratives of their origin to allure European snack brands. Venture capitalists are showing heightened interest in hybrid dehydration startups. These startups, boasting 25–35% energy savings, underscore a belief in the potential of process innovation to revolutionize cost structures in the coming decade.
Dehydrated Food Industry Leaders
-
Nestlé SA
-
Ajinomoto Co. Inc.
-
Asahi Group Holding Ltd
-
OFD Foods LLC
-
European Freeze Dry
- *Disclaimer: Major Players sorted in no particular order

Market Opportunities and Future Outlook
Capacity build-out and technology licensing are creating whitespace in origin-adjacent dehydration, particularly where raw materials are abundant but local value addition is underdeveloped. Asia is showing this most clearly in potato and vegetable dehydration, with Aviko advancing its Gansu, China footprint. The company launched Phase III of the Gansu Aviko Potato Processing project in Zhangye in December 2025 and started physical expansion works in January 2026, which supports ingredient security for industrial customers covering soups, snacks, seasonings, and prepared meals.
A second opportunity area is the spread of modular or licensed drying platforms that let processors commercialize dehydrated fruits, vegetables, and herbs closer to farms and export hubs, which can reduce logistics friction and wastage. In April 2026, EnWave Corporation signed an exclusive commercial license agreement with The Dry Hub in Egypt to establish commercial dehydration operations using Radiant Energy Vacuum (REV) technology. This illustrates how licensing can seed new regional production clusters without requiring buyers to build in-house dryer IP. Alongside these project-led moves, the market is adopting multi-stage drying, heat recovery, and automation to address dehydration's energy-intensity constraint, with suppliers able to validate energy-performance gains while maintaining low-moisture safety controls and clean-label formulations positioned to win industrial supply contracts and premium retail placements.
Recent Industry Developments
- April 2026: EnWave Corporation signed an exclusive commercial license agreement with The Dry Hub in Egypt for the use of Radiant Energy Vacuum (REV) technology to establish commercial dehydration operations. The agreement expands the licensing-led route to new processing capacity in an emerging production geography, supporting local value addition for dehydrated fruits, vegetables, and herbs. It also increases competitive pressure on conventional drying solutions by enabling faster market entry for regional processors.
- July 2025: BranchOut Food expanded the distribution of its Brussels Sprout Crisps nationwide to nearly 4,000 retail outlets, using its GentleDry dehydration process positioned around nutrient retention and texture. Wider retail penetration for a vegetable-based dehydrated snack highlights the role of dehydration in better-for-you snacking and supports incremental shelf space for plant-forward formats. It also raises the bar for differentiated processing claims and consistent quality at scale.
- March 2024: OFD Foods LLC announced an organizational restructuring into two business verticals, Food and Life Sciences, with dedicated leadership for each. This separation clarifies investment priorities and capabilities across consumer and industrial freeze-dried foods versus higher-specification applications, reinforcing the strategic value of drying expertise beyond traditional pantry-stable products. The refocus also signals more targeted commercial execution across end-use segments that rely on dehydration and lyophilization.


Research Methodology Framework and Report Scope
Market Definition and Coverage
For this study, the dehydrated food market covers food products where moisture is removed to extend shelf life and improve storage. This includes common dried formats sold through retail, used in foodservice, and consumed as ingredients in packaged food manufacturing.
Scope exclusions: Fresh and chilled foods, plus products that are only lightly dried for short-term handling, are not counted as dehydrated foods.
Segmentation Overview
-
By Drying Technology
- Spray-dried
- Freeze-dried
- Vacuum-dried
- Sun / Solar-dried
- Other Drying Technologies
-
By Product Category
- Fruits and Vegetables
- Meat and Seafood
- Dairy and Eggs
- Instant Coffee and Other Beverages
- Prepared Meals and Soups
- Spices, Herbs, and Seasonings
- Nutraceutical and Functional Powders
-
By Nature
- Conventional
- Organic
-
By End Use Application
- Industrial Packaged Food
- Foodservice
-
Retail
- Supermarkets/Hypermarkets
- Specialty Stores
- Convenience Stores
- Online Retail Stores
- Other Retail Channels
-
By Geography
-
North America
- United States
- Canada
- Mexico
- Rest of North America
-
South America
- Brazil
- Argentina
- Colombia
- Chile
- Rest of South America
-
Europe
- United Kingdom
- Germany
- France
- Italy
- Spain
- Russia
- Sweden
- Belgium
- Poland
- Netherlands
- Rest of Europe
-
Asia-Pacific
- China
- Japan
- India
- Thailand
- Singapore
- Indonesia
- South Korea
- Australia
- New Zealand
- Rest of Asia Pacific
-
Middle East and Africa
- United Arab Emirates
- South Africa
- Saudi Arabia
- Nigeria
- Egypt
- Morocco
- Turkey
- Rest of Middle East and Africa
-
North America
Data Sources, Market Sizing, and Validation
Desk Research
Desk research was used to set the market boundaries and to anchor the model to visible food production and trade signals. We referred to public sources such as FAOSTAT, UN Comtrade, the USDA, Eurostat, and national customs and agriculture statistics to understand category direction, import dependence, and major supply flows tied to dried food ingredients and finished products.
To keep assumptions grounded, we also reviewed company annual reports, investor presentations, trade association websites, and credible press coverage to track capacity additions, product mix changes, and shifts across retail and foodservice channels. In a few places, paid subscriptions for company financials and intelligence, plus an import-export shipment-level database, were used to cross-check revenue splits and trade movements that are not cleanly visible in aggregated tables. The desk sources listed above are illustrative, and we consulted additional public materials during data collection, validation, and clarification.
Primary Interviews and Surveys
Primary work was completed through expert interviews and structured surveys with dehydrated food ingredient suppliers, packaged food manufacturers, distributors, and category-focused buyers across retail and foodservice. These discussions helped confirm what is counted as dehydrated food in day-to-day purchasing, sanity-check price ranges by product group, and validate how demand differs across APAC, EMEA, and the Americas.
Distribution of primary research fieldwork respondents
| Company type | Respondent position | Region |
|---|---|---|
| Top tier: 33% | CXOs: 15% | APAC: 41% |
| Mid tier: 51% | Functional/Unit leaders: 27% | EMEA: 32% |
| Smaller Players: 16% | Managers: 58% | Americas: 27% |
Market-Sizing & Forecasting
Sizing was built using a top-down approach where food production and trade data reconstruct the demand pool for key dehydrated categories, and then shares are applied based on channel and use patterns validated in interviews. Because coverage varies by country and product group, we added selective bottom-up checks, such as supplier revenue sampling for dehydrated lines and price times volume logic for a few high-visibility categories.
Key inputs tracked included dried product import-export values, packaged food output trends, shifts in dehydration technology mix (spray-dried, freeze-dried, vacuum-dried, and sun-dried), organic versus conventional penetration, and the split of demand across retail, foodservice, and industrial packaged food use. When a data series was missing, proxy ratios were applied using comparable markets and then adjusted after follow-up calls, so totals remained consistent with observable trade and production signals.
Forecasting was done through scenario analysis supported by simple time-series smoothing for the main demand indicators, and then cross-checked against expert views on price movement, product substitution, and channel recovery patterns. Assumptions were kept explicit so the model can be re-run as new trade tables, inflation signals, and category shifts become available.
Data Validation & Update Cycle
Validation was handled through triangulation across independent indicators, followed by variance checks on growth rates, implied consumption patterns, and regional shares, so outliers were flagged early. If a total created an unusual jump against trade movements or category demand signals, we reviewed the inputs again and re-contacted respondents to confirm the cause.
Before sign-off, the model and its inputs go through multi-step analyst review so calculation errors and inconsistent definitions are caught. Reports are refreshed annually, and interim updates are triggered when material events occur, such as sharp commodity price swings, major capacity additions, or meaningful regulation changes affecting dried food labeling or trade. Right before delivery, we complete a final pass so clients receive the most current view available.
Mordor Intelligence's Dehydrated Food Market Size Versus Other Published Estimates
Published market sizes for dehydrated foods often do not match because different publishers apply different inclusion rules, choose different base years, and convert mixed product baskets into USD using their own timing. Differences also come from how end uses are treated, since industrial ingredients, retail packs, and foodservice demand can be grouped together or separated.
Some external estimates narrow the definition to packaged dehydrated meals or selected retail items, which can lower totals even when the growth narrative looks similar. For Mordor Intelligence, nutraceutical and functional powders are included only when they are sold and consumed as dehydrated food products, and they are not counted when they sit inside broader supplements or ingredient-only totals.
Benchmark comparison
| Source | Market Size | Gaps in Research Methodology |
|---|---|---|
| Mordor Intelligence | USD 289.41 B (2026) | |
| Industry Publisher A | USD 238.00 B (2024) | Uses an earlier base year, and totals can shift when product groups are mapped differently across regions and then converted using a different currency timing. |
| Global Consultancy B | USD 292.28 B (2025) | Different base year and forecast window, and category mapping can vary when beverage-related dehydrated products and functional powders are grouped under adjacent ingredient markets. |
The spread is mainly explained by base-year selection, category mapping for borderline dehydrated items, and how mixed regional prices are translated into a single USD value. With inputs tied back to trade signals and end-use splits, the resulting number is easier to repeat and refresh when new data is released.


Key Questions Answered in the Report
How large is the dehydrated food market in 2026?
It is valued at USD 289.41 billion and is forecast to reach nearly USD 391.68 billion by 2031 at a 6.23% CAGR.
Which region leads global demand?
Asia-Pacific commands 39.18% of global revenue due to abundant raw materials and rising processed-food consumption.
What technology holds the biggest share?
Spray-drying accounts for 38.05% of revenue because it balances cost, quality, and throughput for a wide array of products.
Why are organic dehydrated foods growing faster?
Strengthened certification rules and consumer preference for clean labels support a 15.05% CAGR in organic snacks through 2031.
Which end-use sector buys the most dehydrated foods?
Industrial food manufacturers absorb 49.22% of volume as powders and flakes simplify large-scale production and extend shelf life.
What are the main barriers to new entrants?
High capital costs for efficient dryers, stringent FDA preventive controls, and the need for robust supply agreements with raw-material producers limit easy entry.
Page last updated on:




