
Food Packaging Testing Market Size and Share
Market Overview
| Study Period | 2021 - 2031 |
|---|---|
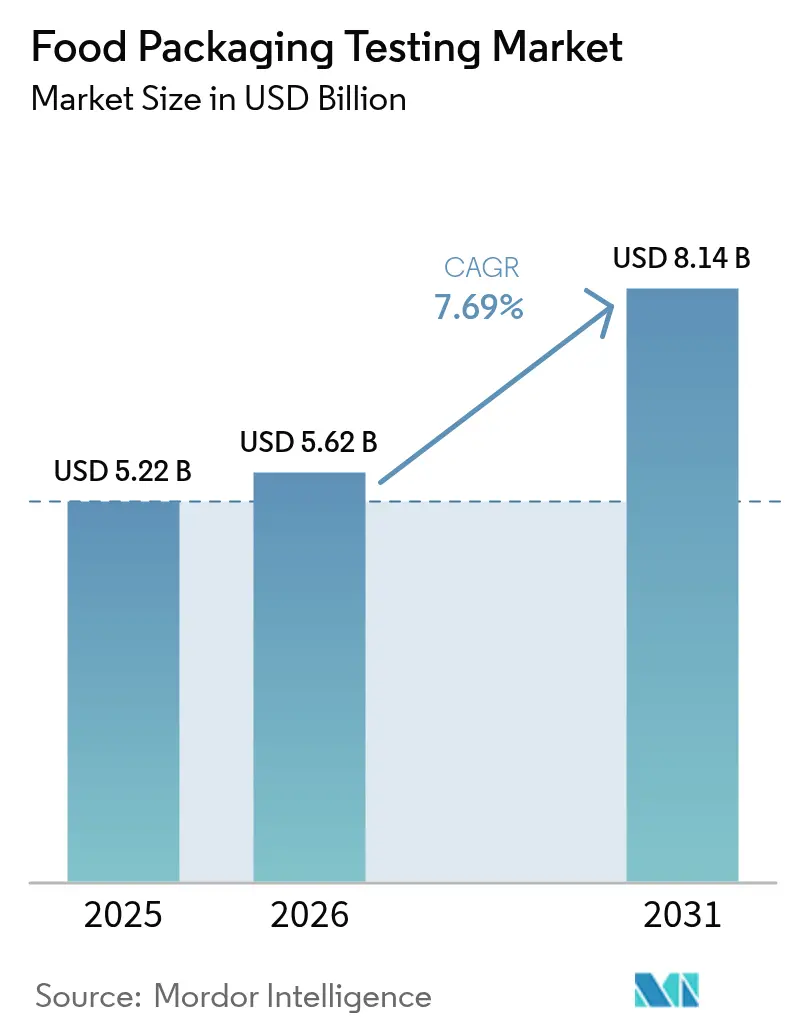
| Market Size (2026) | USD 5.62 Billion |
| Market Size (2031) | USD 8.14 Billion |
| Growth Rate (2026 - 2031) | 7.69 % |
| Fastest Growing Market | Asia Pacific |
| Largest Market | Europe |
| Market Concentration | Medium |
Major Players *Disclaimer: Major Players sorted in no particular order Image © Mordor Intelligence. Reuse requires attribution under CC BY 4.0. | |
Food Packaging Testing Market Analysis by Mordor Intelligence
Food packaging testing market size in 2026 is estimated at USD 5.62 billion, growing from 2025 value of USD 5.22 billion with 2031 projections showing USD 8.14 billion, growing at 7.69% CAGR over 2026-2031. The market growth is driven by stringent global migration limits, increased PFAS monitoring, and the integration of digital traceability platforms that link laboratory data with supply-chain dashboards. The expansion of laboratory capacity through investments in high-resolution mass spectrometry, automated shelf-life simulation chambers, and cloud-based data reporting systems enables detailed contaminant analysis. Major service providers expand their operations through geographic consolidation and international acquisitions to build specialized infrastructure that smaller independent laboratories find difficult to fund. The market scope is expanding as new regulations for recycled content, NIAS disclosure, and design-for-recycling verification create demand for comprehensive test panels beyond standard compliance testing, resulting in higher per-sample revenue.
Key Report Takeaways
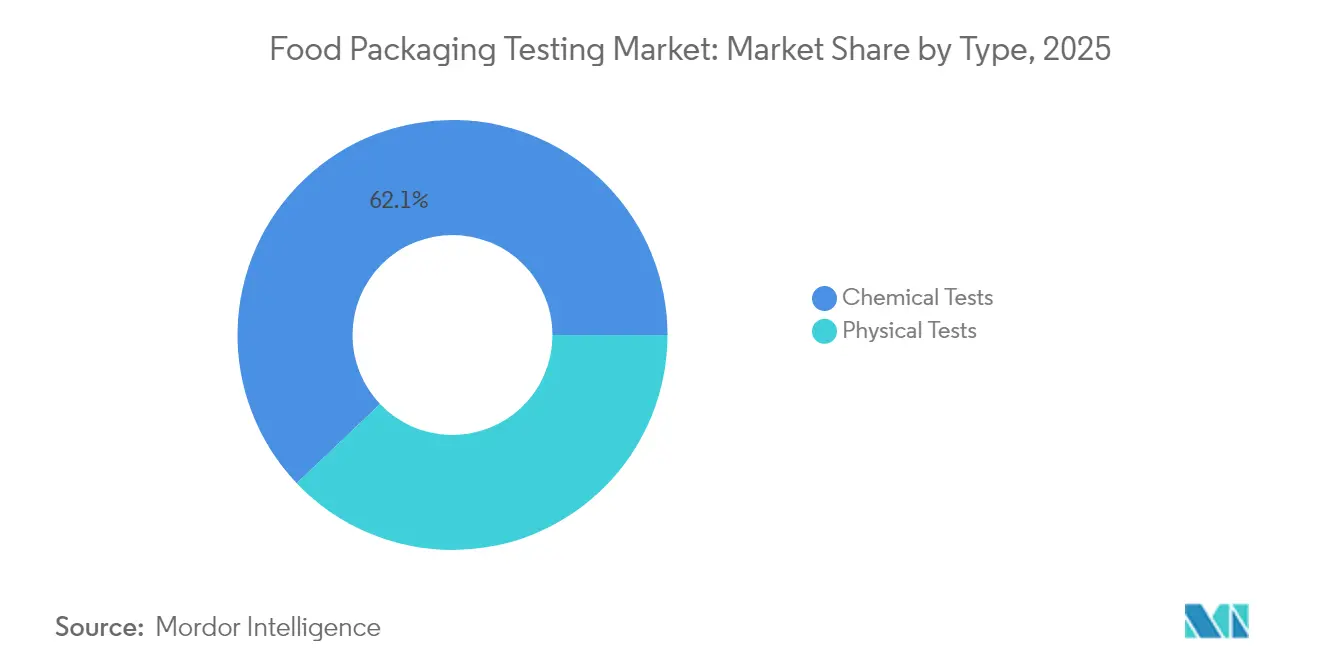
- By type, chemical testing led with 62.10% of the Food Packaging Testing market share in 2025 and is projected to grow at 7.28% CAGR between 2026-2031, while physical testing is forecast to advance at 8.32% CAGR.
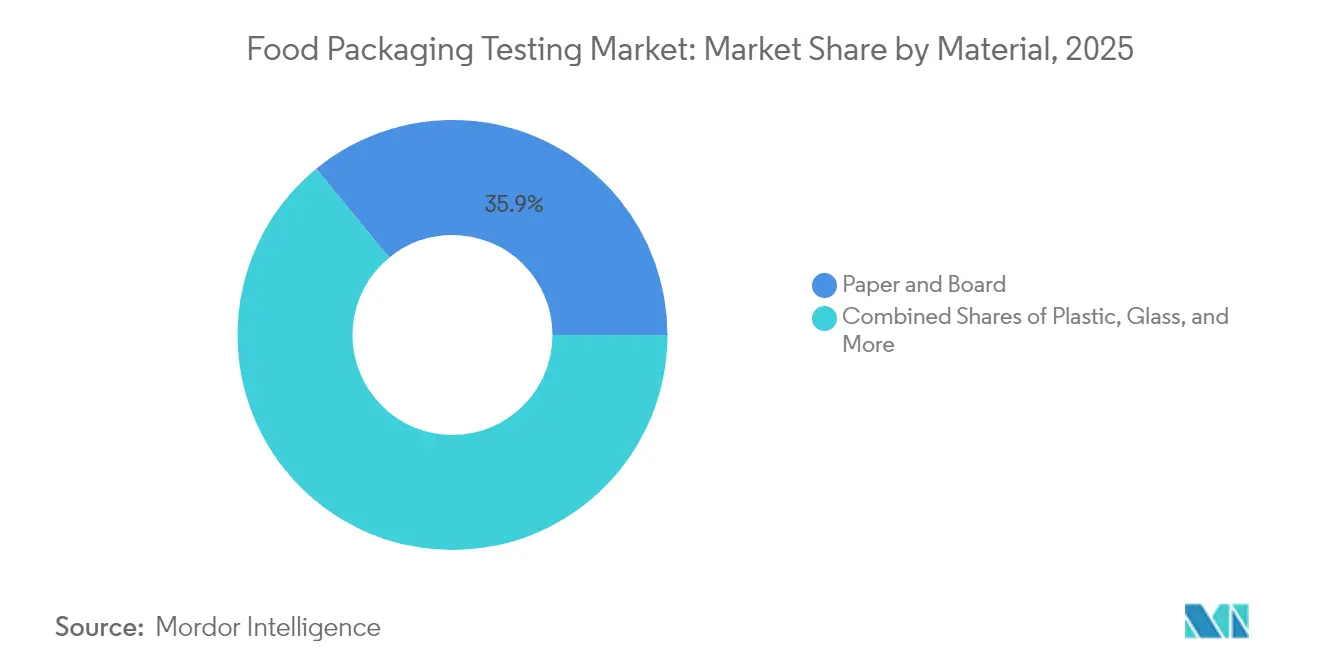
- By material, paper and board commanded 35.92% of 2025 revenue and is set to expand at 8.55% CAGR through 2031, benefitting from the EU Packaging and Packaging Waste Regulation recyclability thresholds.
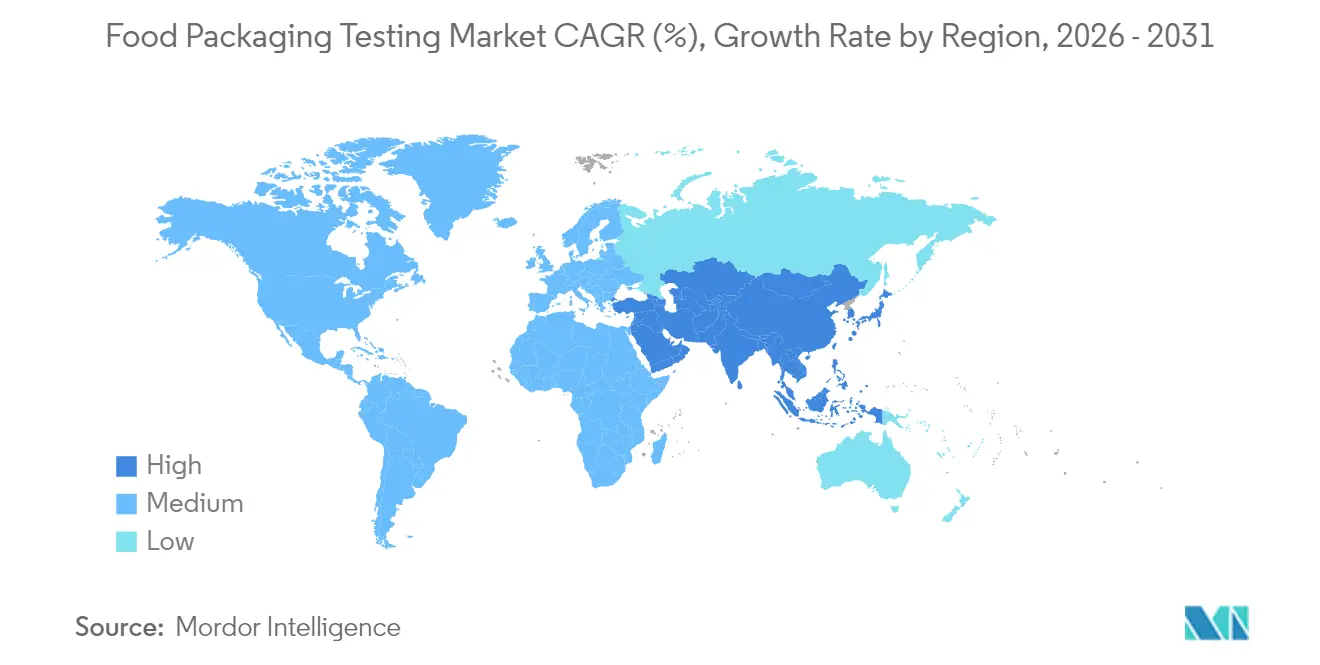
- By geography, Europe held 30.78% of global sales in 2025; Asia-Pacific is poised for the fastest 9.06% CAGR with new Chinese national standards entering force in 2025.
Note: Market size and forecast figures in this report are generated using Mordor Intelligence’s proprietary estimation framework, updated with the latest available data and insights as of 2026.
Market Trends and Insights
Drivers Impact Analysis of Food Packaging Testing Market*
| Driver | (~) % Impact on CAGR Forecast | Geographic Relevance | Impact Timeline |
|---|---|---|---|
| Increasing consumer awareness about food safety and health concerns | +2.1% | Global, with stronger influence in North America & EU | Medium term (2-4 years) |
| Growing demand for processed and packaged food sectors | +1.8% | Asia-Pacific core, spill-over to MEA | Short term (≤ 2 years) |
| Expansion of e-commerce and online grocery shopping | +1.6% | Global, led by North America and Asia-Pacific urban centers | Short term (≤ 2 years) |
| Rising focus on sustainable and eco-friendly packaging solutions | +1.9% | EU and North America primary, expanding to Asia-Pacific | Long term (≥ 4 years) |
| Fueling demand for longer shelf-life and ready-to-eat food products | +1.4% | Global, with early gains in developed markets | Medium term (2-4 years) |
| Development of testing laboratories and service providers globally | +1.2% | Asia-Pacific and MEA expansion, capacity additions in established markets | Long term (≥ 4 years) |
| Source: Mordor Intelligence | |||


Consumer Awareness Drives Advanced Safety Testing Protocols
Consumer awareness regarding food safety and health concerns has undergone a significant transformation, moving beyond traditional pathogen detection methods to incorporate sophisticated chemical migration analysis and comprehensive endocrine disruptor screening. The European Union's decisive action to ban bisphenol A (BPA) in food contact materials, which takes effect in July 2026 with minimal exceptions, illustrates the growing emphasis on preventive regulation driven by public health considerations. Testing laboratories have observed a substantial increase in demand for NIAS (Non-Intentionally Added Substances) identification services, with research revealing that 61 out of 68 detected PFAS compounds in food contact materials were identified as non-intentionally added substances not currently included in regulatory inventories [1]Source: Food Packaging Forum, “Overview of use, migration, and hazards of PFAS in food contact materials,”foodpackagingforum.org. This industry-wide development has necessitated substantial investments in sophisticated analytical equipment, particularly high-resolution mass spectrometry systems and comprehensive non-target screening methodologies. The regulatory landscape continues to evolve, with the FDA providing detailed guidance on chemistry recommendations while EFSA works to establish more comprehensive NIAS assessment protocols to ensure consumer safety.
Processed Food Sector Expansion Accelerates Packaging Innovation Testing
The continuous expansion of the global processed and packaged food market creates increasing demand for sophisticated packaging solutions. These solutions must effectively maintain product quality and safety across complex international supply chains while meeting stringent regulatory standards across different regions. For ready-to-eat food products, manufacturers must conduct comprehensive shelf-life validation studies that include detailed microbiological challenge testing, with particular emphasis on Listeria monocytogenes risk assessment as mandated by Regulation (EC) 2073/2005 [2]Source: Food Standard Scotland, “Testing and Shelf Life,” foodstandards.gov.scot. The industry has widely adopted accelerated shelf-life testing protocols, as research demonstrates their successful implementation for short-shelf-life products through controlled thermal abuse conditions and Q10 calculations in kinetic modeling. The investment in these critical testing procedures varies significantly, with basic six-month shelf-stable studies ranging from USD 400-800, while more complex high-risk challenge studies can cost between USD 900-2,000 or more, reflecting both the technical sophistication required and the comprehensive regulatory compliance measures [3]Source: Michigan State University, “Understanding shelf-life testing for packaged food products,”canr.msu.edu.
E-commerce Growth Transforms Packaging Performance Requirements
The rapid expansion of e-commerce platforms and online grocery services has fundamentally transformed how companies approach packaging testing requirements. The industry has witnessed a significant shift from traditional retail display testing methods to comprehensive distribution-focused stress evaluations. This transformation is clearly illustrated by Amazon's Ships in Product Packaging (SIPP) certification program, which implements stringent testing protocols including a sequence of 17 drops from precise heights of 18" and 36", along with flexible packaging durability tests utilizing 3-pound sand bags dropped from 3 feet in April 2024. Temperature control testing has emerged as a crucial component in this evolution, necessitating detailed thermal profiling, thorough cold-chain validation procedures, and extensive compartment effectiveness evaluation for secondary packaging solutions. In response to these market demands, the International Safe Transit Association (ISTA) has developed specialized Amazon-specific testing protocols that accurately simulate fulfillment center conditions, generating substantial opportunities for companies offering specialized testing equipment and certification services.
Sustainability Focus Drives Advanced Material Testing and Circular Economy Validation
The global packaging industry is experiencing a significant shift toward sustainable and eco-friendly solutions, which has created substantial demand for comprehensive testing and validation services. The European Union has implemented the Packaging and Packaging Waste Regulation, which sets clear requirements for packaging recyclability. Under this regulation, manufacturers must ensure their packaging achieves a minimum recyclability rate of 70% (Grades A-C) by 2030. For starch-based biodegradable packaging materials, manufacturers must conduct specific testing procedures, including detailed analysis of retrogradation kinetics through FTIR spectroscopy, evaluation of thermal stability using DSC/TGA methods, and thorough migration testing for nanoparticle additives. The regulatory environment continues to evolve, incorporating ISO 22000 certification requirements and new compliance frameworks for bio-based materials. Companies must also obtain lifecycle assessment validation and compostability certification in accordance with EN13432 standards to meet market requirements.
Restraints Impact Analysis of Food Packaging Testing Market*
| Restraint | (~) % Impact on CAGR Forecast | Geographic Relevance | Impact Timeline |
|---|---|---|---|
| High cost of advanced testing technologies and facilities | -2.3% | Global, particularly affecting emerging markets | Medium term (2-4 years) |
| Lack of standardized and uniform testing methods globally | -1.8% | Global, with acute challenges in cross-border trade | Long term (≥ 4 years) |
| Complexity and variation in regulatory requirements across regions | -1.5% | Global, most pronounced between US, EU, and Asia-Pacific | Long term (≥ 4 years) |
| Shortage of skilled personnel qualified for specialized testing | -1.2% | Global, with critical gaps in advanced analytical techniques | Medium term (2-4 years) |
| Source: Mordor Intelligence | |||
High Technology Costs Create Market Access Barriers
The substantial investment required for advanced testing technologies and facilities poses a significant barrier to market expansion, particularly impacting laboratories in developing regions and smaller testing facilities. The specialized nature of PFAS analysis demands sophisticated high-resolution mass spectrometry systems, while conducting migration tests requires dedicated environmental chambers and precise analytical instruments. The stringent regulatory landscape, exemplified by the EU's strict PFAS detection requirements of 25 ppb for individual substances and 250 ppb for total measurements, necessitates laboratories to make considerable financial commitments in highly sensitive analytical equipment. In response to these cost challenges, industry leaders such as SGS, Eurofins, and Mérieux NutriSciences are pursuing strategic acquisitions to create larger laboratory networks, enabling them to spread their infrastructure investments across a broader testing volume base and achieve operational efficiencies.
Regulatory Fragmentation Challenges Global Harmonization
The fragmented landscape of testing methods worldwide presents significant operational and compliance hurdles for multinational food packaging manufacturers. China's introduction of new national testing standards (GB 31604-30 through GB 31604-63), taking effect in September 2025, implements region-specific protocols for measuring phthalate migration, vinyl chloride determination, and N-nitrosamine analysis. The US FDA maintains its independent Food Contact Substance Notification (FCN) framework, which differs substantially from EU authorization requirements, while Japan implements a distinct positive list system for synthetic resins. The inconsistency in PFAS testing methodologies across various laboratories results in unreliable data, making it difficult for companies to validate their supply chains and demonstrate regulatory compliance. To address these challenges, international bodies are working toward harmonization through initiatives like Codex Alimentarius, while major trading partners engage in bilateral recognition agreements to streamline compliance processes.
*Our forecasts treat driver/restraint impacts as directional, not additive. The impact forecasts reflect baseline growth, mix effects, and variable interactions.
Food Packaging Testing Market Segment Analysis
By Type:
Chemical Testing Dominance Faces Physical Testing RenaissanceThe chemical testing segment maintains its strong market position with a substantial 62.10% share in 2025. This dominance stems from its comprehensive capabilities in migration analysis, PFAS detection, and NIAS identification. The segment has experienced significant growth following the implementation of expanded regulations, particularly the EU 2025/351, which now encompasses substances found in adhesives, coatings, and printing inks applied to plastics. Testing laboratories have responded to these requirements by implementing sophisticated GC-MS and LC-MS methodologies for specific migration testing, while also investing in high-resolution mass spectrometry equipment to conduct thorough non-target screening procedures.
The physical testing segment demonstrates remarkable market momentum, achieving the highest growth rate at 8.32% CAGR. This growth is primarily fueled by the increasing demands of e-commerce packaging validation requirements and the implementation of accelerated shelf-life testing protocols. The segment has evolved to meet industry needs by incorporating comprehensive thermal shock testing in accordance with EN 1183:1997 standards. Additionally, testing facilities have enhanced their capabilities in barrier efficiency assessment through the implementation of surrogate compound breakthrough methods, reflecting the industry's shift toward more performance-based validation approaches.


By Material:
Paper and Board Leadership Reflects Sustainability and Safety ConvergencePaper and board materials dominate the market with a substantial 35.92% share in 2025, while exhibiting robust growth at 8.55% CAGR. This market leadership stems from the increasing emphasis on sustainability requirements and the critical need for contamination control in packaging applications. The evolution of laboratory testing for recycled paperboard now encompasses comprehensive surrogate compound breakthrough tests, which evaluate migration potential through the analysis of model contaminants including benzophenone, diisopropylnaphthalenes, and phthalates.
The industry has established structured protocols through the FEFCO methodology for testing printed corrugated board in food contact applications, ensuring consistent migration assessment and GMP compliance. In the plastics segment, materials continue to maintain a significant market position despite increasing regulatory pressures, primarily due to innovations in barrier technology and the availability of recycled content validation services. The implementation of EU recycled plastics regulation (EU 2022/1616) has introduced new requirements for decontamination process verification and challenge testing protocols, creating a specialized market for testing services in this segment.
Geography Analysis
Europe Food Packaging Testing Market
The European market demonstrates its dominance in the global landscape, commanding a substantial 30.78% market share in 2025. This leadership position stems from the region's well-established regulatory infrastructure, anchored by the Framework Regulation (EC) 1935/2004 and various material-specific directives. The sophisticated regulatory environment has created a robust demand for advanced testing services, with particular emphasis on PFAS analysis and NIAS assessment following EFSA guidelines. The implementation of the EU's PPWR in August 2026 further strengthens this framework by introducing stringent PFAS limits and recyclability requirements, which in turn necessitates expanded testing capabilities. The region's technical prowess is exemplified by Germany's specialized expertise in mineral oil migration testing and the Netherlands' sophisticated PFAS analytical capabilities.
APAC Food Packaging Testing Market
The Asia-Pacific region has emerged as the most dynamic market segment, achieving an impressive growth rate of 9.06% CAGR. This remarkable expansion is primarily attributed to China's ongoing regulatory modernization efforts and the rapid development of its food processing industries. The region's growth trajectory is further reinforced by China's National Health Commission's upcoming implementation of five new testing method standards in September 2025, which will generate substantial testing requirements. Additionally, Japan's comprehensive positive list system for synthetic resins mandates thorough substance validation, contributing to the region's expanding market presence.
North America Food Packaging Testing Market
The North American market maintains a stable growth pattern, supported by the FDA's comprehensive regulatory oversight and increasingly stringent state-level PFAS restrictions. Several states, including California, Connecticut, and Maine, have taken proactive measures by implementing PFAS prohibitions in food packaging. The market's development is further influenced by the FDA's voluntary industry phase-out of PFAS grease-proofing agents, which necessitates continuous monitoring and compliance measures across the industry.

Regulatory Landscape
Regulation of food packaging testing is tightening around chemical migration, PFAS screening, and positive-list compliance across major markets. In the European Union, Packaging and Packaging Waste Regulation (EU) 2025/40 entered into force on 11 February 2025 and applies from 12 August 2026, including an Article 5(5) restriction on PFAS in food-contact packaging above defined concentration limits. The EU also advanced food-contact substance controls through Commission Regulation (EU) 2026/245, which updates Annex I of Regulation (EU) No 10/2011 by authorizing specific substances and setting conditions and migration limits, expanding the scope of analytical verification required from packaging suppliers and laboratories.
Bisphenol controls are a second major compliance driver. Commission Regulation (EU) 2026/250 restricts BPA and related derivatives in food-contact materials and sets transition timelines, including a July 2026 market placement milestone and specified exemptions extending to January 2028 for certain applications. Outside the EU, national frameworks continue to diverge: India updated its Compendium of Food Safety and Standards (Packaging) Regulations via FSSAI notification No. STD/SP-20/T(Recycledplastics-N) dated 28 March 2025, while the United States maintains the FDA Food Contact Substance Notification (FCN) program and associated 21 CFR requirements, reinforcing the need for region-specific test panels and documentation aligned to each regulator’s acceptance pathways.
Competitive Landscape
Top Companies in Food Packaging Testing Market
The food packaging testing market maintains moderate concentration levels, characterized by strategic consolidation through major acquisitions and geographic expansion initiatives. Leading companies have established extensive global laboratory networks to meet the growing demands of multinational clients who require consistent testing protocols across different regions. The significant acquisition of Bureau Veritas' food testing business by Mérieux NutriSciences for EURO 360 million illustrates this trend, resulting in an expansive network of 140 laboratories spanning 32 countries.
Companies in the market are increasingly focusing on developing and implementing advanced analytical capabilities, particularly in areas such as PFAS detection and NIAS identification, to address evolving regulatory requirements. This focus on technical advancement is complemented by strategic geographic expansion, as demonstrated by SGS's enhancement of food and nutraceutical testing capacity in North America. Similarly, Eurofins has strengthened its market position through multiple strategic acquisitions, including SF Analytical Laboratories and APAL, highlighting the importance of both geographic coverage and specialized expertise in the industry.
The market continues to present significant growth opportunities, particularly in emerging regions, digital testing integration, and sustainability validation services. Companies are actively investing in technological advancements, including automation systems, high-throughput screening capabilities, and sophisticated data integration platforms to enhance supply chain transparency. The competitive landscape is significantly influenced by regulatory standards, with ISO/IEC 17025 accreditation requirements and GFSI-benchmarked certification schemes playing crucial roles in determining market positioning and success.
Food Packaging Testing Industry Leaders
SGS Société Générale de Surveillance SA
Eurofins Scientific
Intertek Group plc
Mérieux NutriSciences
TÜV SÜD
- *Disclaimer: Major Players sorted in no particular order

Food Packaging Testing Market Companies Covered in this Report
- SGS Société Générale de Surveillance SA
- Eurofins Scientific
- Intertek Group plc
- Mérieux NutriSciences
- TÜV SÜD
- ALS Limited
- UL Solutions
- NSF International
- TÜV Rheinland Group
- Element Materials Technology
- Smithers (Group)
- Labthink Instruments
- Microbac Laboratories Inc.
- AGQ Labs
- LGC Group
- QIMA Limited
- IFP Institute for Product Quality
- Tentamus Group
- EMSL Analytical Inc.
- Campden BRI

Market Opportunities and Future Outlook
The near-term opportunity centers on enabling brand owners and converters to demonstrate compliance with tightening EU chemical requirements. Demand is moving beyond declarations toward analytical substantiation across diverse materials, including paper and board, plastics, and multilayer structures. The EU’s PPWR applying from 12 August 2026 includes chemical requirements for packaging, such as PFAS restrictions and a 100 mg/kg combined limit for cadmium, lead, mercury, and hexavalent chromium. This expands the need for multi-analyte screening, method validation, and imported-material verification programs. Separately, BPA-related restrictions taking effect in July 2026 elevate demand for sensitive migration and confirmatory workflows, including verification at very low detection thresholds and broader bisphenol and NIAS-oriented panels.
A second opportunity area is testing for advanced functional and barrier solutions that require updated protocols to support market access and risk mitigation claims. Aptar Active Material Science reported a USPTO patent allowance in June 2026 for its N-Sorb technology, aimed at packaging-delivered nitrosamine risk mitigation, which can add demand for efficacy testing, extractables and leachables-style assessments, and compatibility studies across real food matrices and packaging formats. Trade and enforcement pressure also creates room for laboratories and platforms that can combine regulatory intelligence with fast-turnaround testing and digital reporting, particularly for exporters shipping into the EU under heightened scrutiny of chemical compliance in food-contact packaging.
Recent Industry Developments in Food Packaging Testing Market
- March 2026: SGS announced strengthened PFAS testing capabilities to support businesses meeting global safety standards, with a stated focus on consumer products and food materials. The company said the update supports PPWR chemical requirements applying from 12 August 2026 and improves readiness for multi-material screening programs demanded by packaging suppliers and brand owners.
- October 2025: SGS stated that its Naucalpan laboratory became Mexico’s first facility accredited to test food contact materials against US FDA standards, including references to 21 CFR test needs for common packaging polymers and coatings. This accreditation expands cross-border compliance options for manufacturers supplying the US market and reduces reliance on shipping samples to US or EU labs for FDA-aligned verification.
- September 2024: Eurofins Scientific completed the acquisition of Infinity Laboratories, an operator of eight laboratories in the United States offering chemistry, microbiology, sterilization, and package testing services. The acquisition broadens Eurofins’ package testing footprint and increases its ability to serve regulated packaging qualification and contamination-control workflows across multiple end-user industries that also utilize food-contact packaging test methods.


Food Packaging Testing Market Report Scope and Research Methodology
Market Definition and Coverage
This market counts revenues from third-party testing services used to verify that food packaging is safe, compliant, and fit for use, including checks such as migration behavior and barrier performance across common packaging materials.
Scope exclusions: We exclude in-house quality lab activities that are not billed as a third-party testing service, and we also exclude packaging machinery testing.
Segments Covered in This Report
- By Type
- Physical Tests
- Durability Testing
- Heat Resistance Testing
- Water Vapor /Gas Permeability Testing
- Chemical Tests
- Migration Testing
- Extractable Testing
- Leachable Testing
- Others
- Physical Tests
- By Material
- Plastic
- Glass
- Metal
- Paper and Board
- Layer Packaging
- By Geography
- North America
- United States
- Canada
- Mexico
- Rest of North America
- Europe
- Germany
- United Kingdom
- Italy
- France
- Spain
- Rest of Europe
- Asia-Pacific
- China
- India
- Japan
- Australia
- Rest of Asia-Pacific
- South America
- Brazil
- Argentina
- Rest of South America
- Middle East and Africa
- South Africa
- Saudi Arabia
- United Arab Emirates
- Rest of Middle East and Africa
- North America
Data Sources, Market Sizing, and Validation
Desk Research
We start with public, repeatable references that help map the demand pool for packaging tests and the rules that trigger them. This includes sources such as the US FDA food contact materials guidance and notifications, the European Commission framework on food contact materials, and EFSA scientific opinions that influence migration testing panels.
To connect regulations with real-world volumes, we also review trade and production indicators, along with packaging conversion signals from sources such as UN Comtrade, national statistics offices, and association publications in the packaging and food safety ecosystem. Company annual reports, investor decks, and credible press are used to understand service mix, lab footprint expansion, and pricing language. Where needed, we add paid subscriptions for company financials, news screening, and patent lookups to validate technology shifts (for example, non-intentionally added substances screening or recycled-content compliance needs). The desk sources listed here are illustrative, and we also check additional public references for data collection, cross-checking, and clarification.
Primary Interviews and Surveys
Next, we speak with testing labs, packaging converters, food and beverage quality teams, and regulatory specialists so the model assumptions match actual buying behavior. These discussions confirm which tests are routinely purchased by material type, what drives retesting (supplier change, recycled content, or new regulation), and how pricing moves when panels expand or when turnaround times tighten across major regions.
Distribution of primary research fieldwork respondents
| Company type | Respondent position | Region |
|---|---|---|
| Top tier: 25% | CXOs: 19% | APAC: 46% |
| Mid tier: 56% | Functional/Unit leaders: 38% | EMEA: 33% |
| Smaller Players: 19% | Managers: 43% | Americas: 21% |
Market-Sizing & Forecasting
Sizing is built using a top-down and bottom-up sequence that is easy to audit. We first reconstruct the service revenue pool by linking packaging material output and food packaging usage to testing intensity typically required for food contact compliance, then adjust by region based on how strict and how frequently enforced the testing triggers are.
To keep the numbers grounded, we cross-check totals with selective bottom-up approximations. This includes sample roll-ups using lab capacity signals, typical test-panel pricing, and observed project volumes from interviews. Key inputs include the split of demand by test family (physical versus chemical), the share of plastic and multilayer structures in food packaging, retest frequency tied to supplier or formulation changes, migration and NIAS screening requirements, and average turnaround time premiums that affect pricing. When bottom-up checks show gaps (for example, undercounting smaller local labs in emerging markets), we apply a controlled uplift supported by interview feedback and by visible lab footprint expansion.
For forecasting, we use scenario analysis supported by a multivariate relationship between packaged food output, regulation-driven test frequency, recycled-content adoption, and price per test panel. Assumptions are re-checked with experts so the base case reflects what buyers and labs expect, rather than relying on a purely mathematical trendline.
Data Validation & Update Cycle
We validate results by triangulating the model against independent signals such as packaging material production, trade flows for packaged foods, and the implied testing spend per unit of packaging in mature markets. Outliers are reviewed region by region, and underlying drivers are revisited when a variance is too large to explain with known regulation or material mix differences.
Before sign-off, the work goes through multi-step analyst reviews, including logic checks on pricing, volume, and penetration assumptions. We also use re-contact triggers when an input moves sharply, for example, a new restriction that expands migration panels. Reports refresh annually, and interim updates are made when major regulatory or technology changes materially shift testing scope or pricing. Immediately before delivery, we perform a final pass to ensure the latest public signals are reflected in the numbers.
Mordor Intelligence's Food Packaging Testing Market Size Compared With Other Published Estimates
Published market sizes for food packaging testing often differ because teams do not refresh pricing and compliance assumptions at the same time, and they may also anchor the market to different test bundles. Currency conversion timing, and whether an estimate uses current-year or average-year exchange rates, can widen the gap even when the same regions are covered.
The spread usually comes from practical choices, such as whether only physical and chemical testing are counted, or whether microbiological and functional checks are also included. Differences also show up in how average selling prices are modeled, since a simple inflation uplift can miss shifts caused by expanded migration panels, recycled-content verification, and faster turnaround premiums. By re-checking ASP logic using recent field inputs and applying consistent currency timing before totals are finalized, Mordor Intelligence reduces drift that can build up when older price points are carried forward without a fresh validation loop.
Benchmark comparison
| Source | Market Size | Gaps in Research Methodology |
|---|---|---|
| Mordor Intelligence | USD 5.62 B (2026) | |
| Industry Publisher A | USD 4.87 B (2025) | This estimate is anchored to a different base year and can compress the value if currency timing and one-year price changes are not normalized to the same reference point. |
| Industry Publisher B | USD 6.36 B (2025) | The scope appears broader in testing types and end uses, which can lift the total if microbiological, functional, or adjacent compliance activities are included alongside packaging-specific work. |
Across the figures, timing, test-bundle boundaries, and price-per-panel assumptions can move the total up or down. A model that keeps test scope explicit, ties demand to packaging material and compliance triggers, and then re-validates pricing and regional splits through interviews tends to produce a steadier number that is repeatable year after year.


Key Questions Answered in the Report
How big is the Food Packaging Testing market in 2026?
The Food Packaging Testing market size reached USD 5.62 billion in 2026.
What CAGR is expected for Food Packaging Testing between 2026-2031?
Global revenue is projected to rise at 7.69% CAGR during the forecast window.
Which testing type holds the largest share?
Chemical testing led with 62.10% share in 2025 owing to stringent migration and PFAS mandates.
Which material category is growing fastest?
Paper and board packaging tests are expanding at 8.55% CAGR on sustainability demand.
Which region is expected to grow quickest?
Asia-Pacific is forecast for a 9.06% CAGR, propelled by new Chinese and Japanese standards.
Page last updated on:


 Your data is secure and never sold or shared.


