
Market Overview
| Study Period | 2021 - 2031 |
|---|---|
| Market Size (2026) | USD 1.35 Billion |
| Market Size (2031) | USD 1.89 Billion |
| Growth Rate (2026 - 2031) | 6.96 % |
| Fastest Growing Market | Asia Pacific |
| Largest Market | Europe |
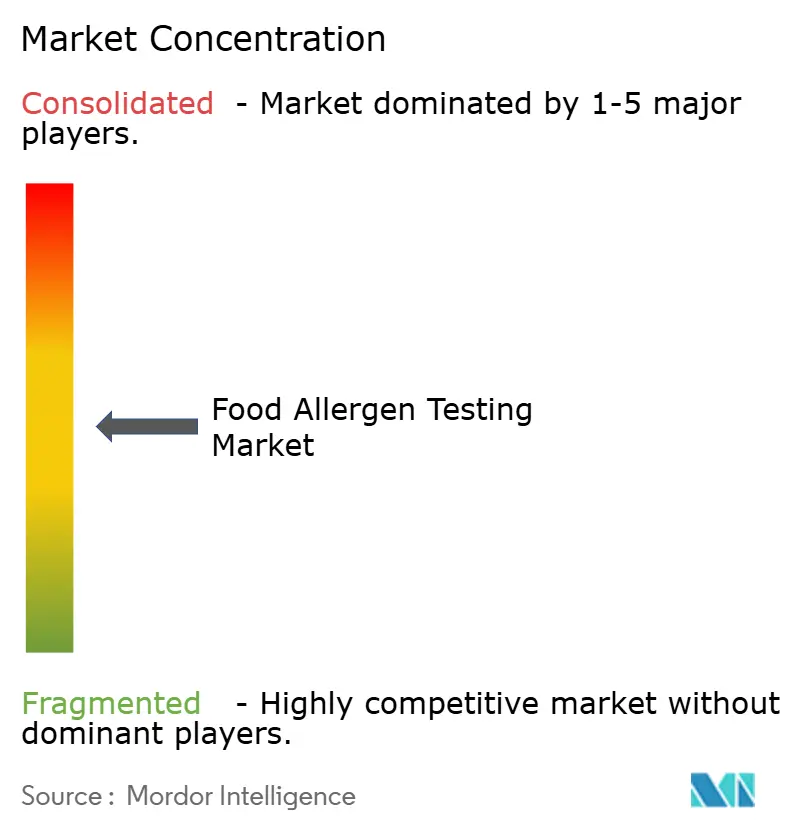
| Market Concentration | Medium |
Major Players
*Disclaimer: Major Players sorted in no particular order Image © Mordor Intelligence. Reuse requires attribution under CC BY 4.0. |
|
Food Allergen Testing Market Analysis by Mordor Intelligence
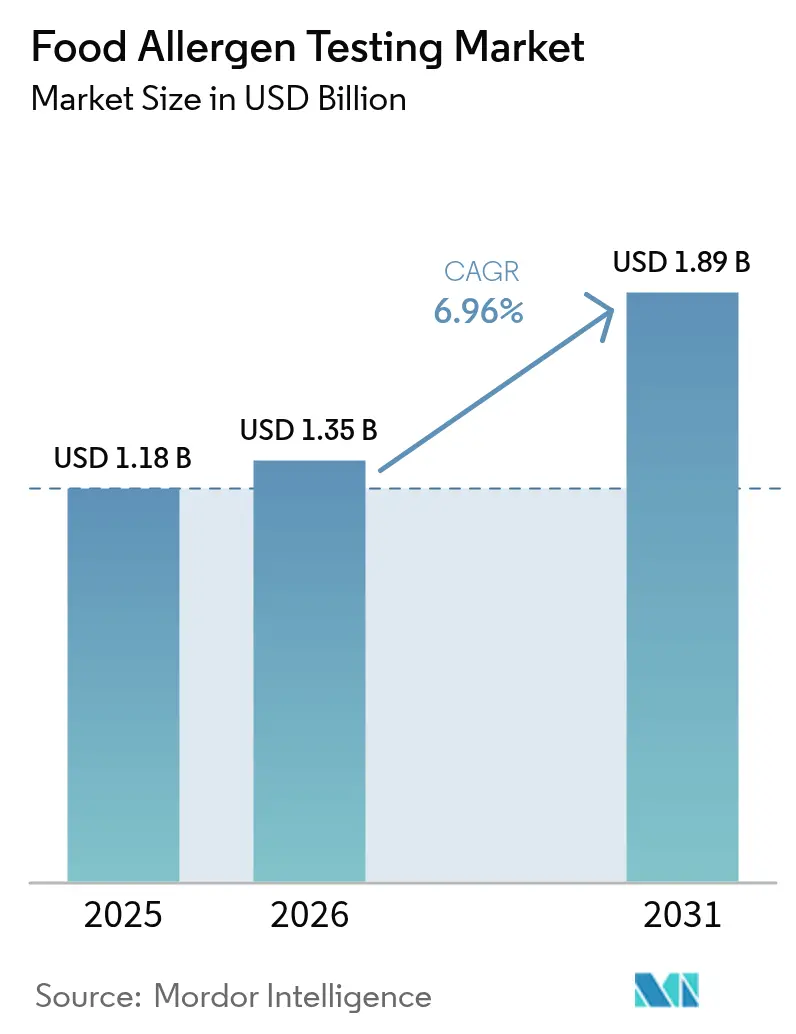
The food allergen testing market size is projected to grow from USD 1.18 billion in 2025 to USD 1.35 billion in 2026, reaching USD 1.89 billion by 2031, with a CAGR of 6.96% during 2026-2031. Manufacturers are transitioning from end-line checks to in-process verification, as undeclared allergens remain the leading cause of food recalls, significantly increasing brand-risk costs that often surpass withdrawal expenses. While Europe remains the primary market, demand in the Asia-Pacific region is rising due to export growth and the adoption of EU-style labeling regulations. Immunoassay methods dominate in terms of volume due to their portability; however, polymerase chain reaction (PCR) platforms are experiencing faster growth as retailers require sequence-level verification for ISO 17025 audits. Additionally, capital-intensive mass spectrometry is gaining popularity in high-value categories, such as infant formula, where sub-ppm limits are essential.
Key Report Takeaways
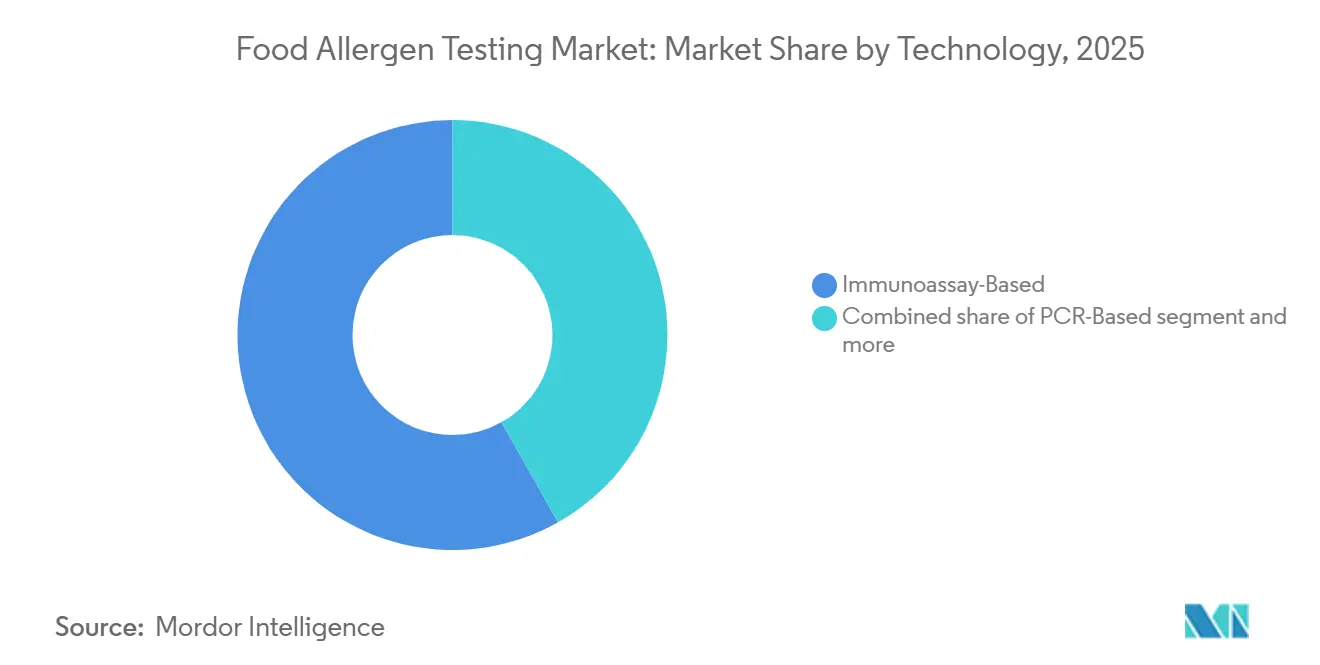
- By technology, immunoassay methods accounted for 58.17% of the food allergen testing market share in 2025, while polymerase chain reaction-based platforms are expected to grow at a CAGR of 7.38% through 2031.
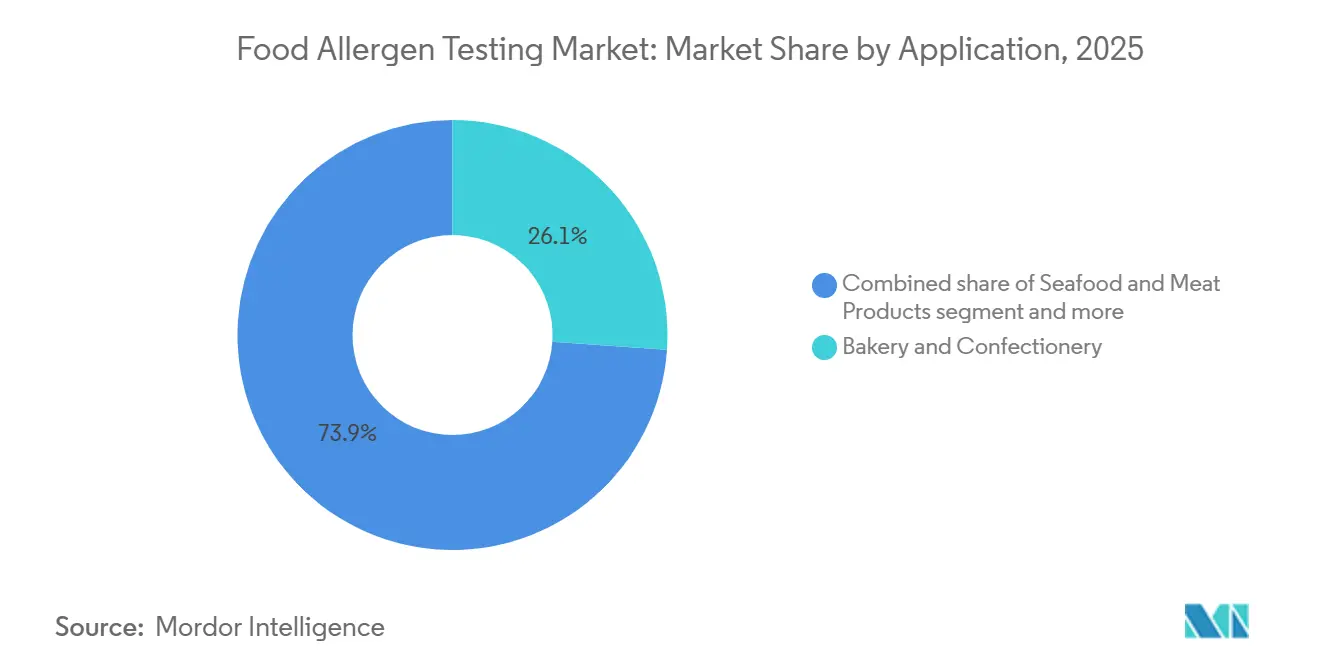
- By application, bakery and confectionery represented 26.09% of the food allergen testing market size in 2025, whereas seafood and meat products are projected to achieve a CAGR of 9.56% between 2026 and 2031.
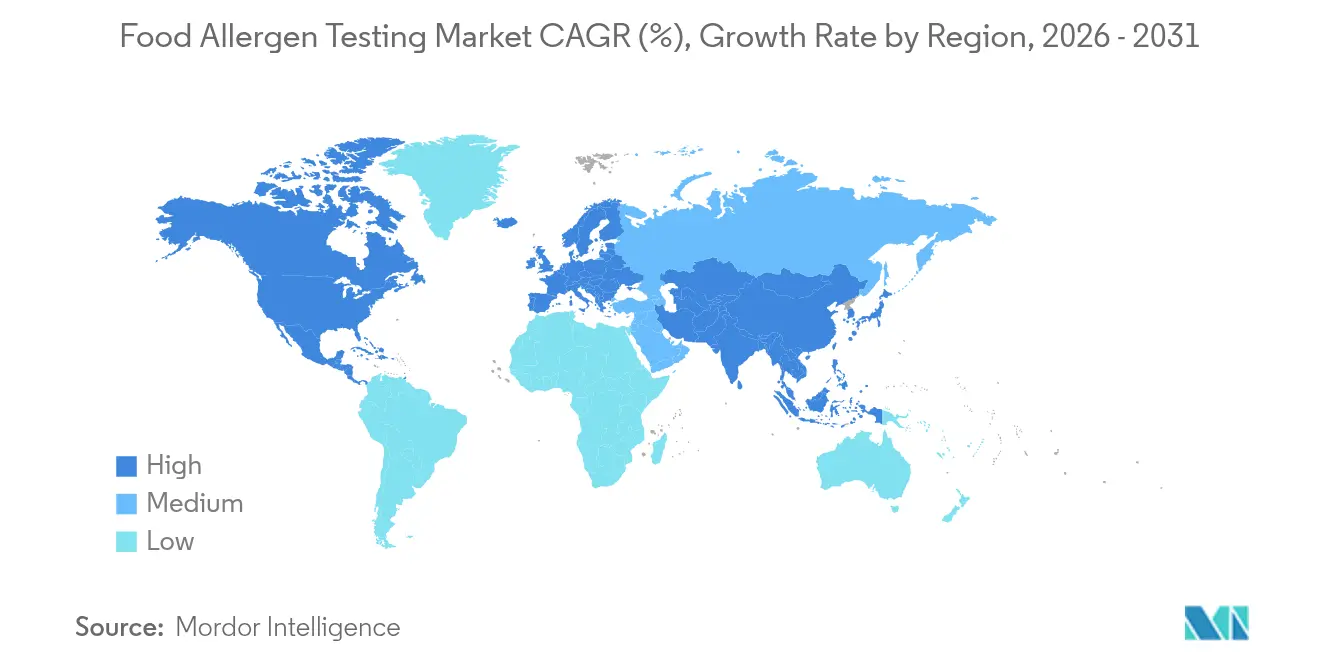
- By geography, Europe held 34.47% of the food allergen testing market share in 2025, while Asia-Pacific is anticipated to grow at a CAGR of 8.98% during the same period.
Note: Market size and forecast figures in this report are generated using Mordor Intelligence’s proprietary estimation framework, updated with the latest available data and insights as of 2026.
Market Trends and Insights
Drivers Impact Analysis of Food Allergen Testing Market*
| Driver | (~) (%) Impact on CAGR Forecast | Geographic Relevance | Impact Timeline |
|---|---|---|---|
| Surge in food recalls and brand-risk costs | +1.4% | North America, European Union (EU) | Short term (≤ 2 years) |
| Tightening allergen labeling laws and enforcement | +1.6% | North America, European Union (EU), Asia-Pacific | Medium term (2-4 years) |
| Expansion of global processed-food trade | +1.2% | Asia-Pacific export hubs, Middle East, Africa | Medium term (2-4 years) |
| Harmonized reference-dose rules lowering LOQs | +0.9% | European Union (EU) first, adoption in Asia-Pacific and South America | Long term (≥ 4 years) |
| Consumer demand for clean-label and allergen-free foods | +1.1% | North America, European Union (EU), urban Asia-Pacific | Medium term (2-4 years) |
| Accredited labs and audit readiness standardize test protocols | +0.7% | Global, led by ISO 17025 uptake | Long term (≥ 4 years) |
| Source: Mordor Intelligence | |||


Surge in food recalls and brand-risk costs
The increasing frequency and economic impact of allergen-related food recalls are driving significant changes in the food industry's approach to risk management. Undeclared allergens remain the primary cause of global recalls. In the United Kingdom, 53 cases of undeclared allergen recalls were reported in 2024, representing a 10% increase and highlighting ongoing challenges in preventing cross-contamination [1]Source: Food Safety, "Proactive Allergen Prevention in the Foodservice Industry", food-safety.com. Regulatory changes are also shaping industry practices. The FDA’s Food Safety Modernization Act (FSMA) Section 204, scheduled for enforcement in January 2026, requires digital traceability systems to improve visibility into allergen control failures and their associated legal and financial risks. This regulation is encouraging manufacturers to focus on proactive testing and preventive measures rather than reactive responses to recalls, leading to a steady increase in the adoption of rapid allergen detection technologies. Risk reduction and regulatory compliance are particularly crucial in the foodservice sector, which reports the second-highest rate of allergic incidents after household consumption.
Tightening allergen labeling laws and enforcement
The push for regulatory alignment across major global markets is increasing pressure on food manufacturers, extending beyond traditional labeling requirements to encompass production practices and supply chain verification protocols. In 2024, the FDA released Edition 5 guidance on allergen control, introducing more stringent requirements for cleaning validation and environmental monitoring. Concurrently, the USDA’s Food Safety and Inspection Service launched a dedicated allergen verification initiative targeting meat and poultry processors. Similarly, the Dutch Food and Consumer Product Safety Authority revised its guidelines on preventing cross-contact, detailing testing frequencies and analytical methods for manufacturers. These regulatory updates significantly affect multinational food companies, which must manage varying levels of enforcement across regions, with Europe imposing some of the most stringent compliance standards. Emerging markets are also impacted, as export-driven producers adopt international allergen testing protocols to access high-value markets.
Expansion of global processed-food trade
The globalization of food supply chains presents significant challenges in allergen management, surpassing the capabilities of conventional testing methods. With ingredients sourced from multiple regions governed by varying regulatory frameworks, manufacturers must adopt standardized testing protocols to comply with destination market requirements while mitigating contamination risks from source countries. The emergence of alternative proteins, such as plant-based, fungal, and insect-derived ingredients, introduces new allergen-related complexities that demand specialized analytical techniques beyond traditional immunoassays [2]Source: National Center for Biotechnology Information, "Allergenicity of Alternative Proteins: Reduction Mechanisms and Processing Strategies," pmc.ncbi.nlm.nih.gov. Furthermore, processing methods like heat treatment, enzymatic hydrolysis, and fermentation can modify protein structures, potentially impacting their detectability. This necessitates the use of advanced analytical tools, including mass spectrometry and peptidomics. This challenge is particularly evident in the Asia-Pacific region, where urbanization and an expanding middle class are driving increased demand for imported processed foods. These factors create substantial opportunities for internationally accredited allergen testing service providers, as manufacturers prioritize reliable solutions to ensure regulatory compliance and protect consumer safety within increasingly intricate supply chains.
Harmonized reference-dose rules lowering LOQs
The global effort to standardize reference-dose methodologies is driving the adoption of advanced and highly sensitive analytical platforms for allergen detection, as regulators enforce stricter quantification limits. This shift from basic presence/absence testing to quantitative risk assessment requires measurements at sub-parts-per-million levels, which traditional methods often fail to achieve. Complex food formulations pose additional challenges for conventional Enzyme-Linked Immunosorbent Assay (ELISA) techniques due to their limited sensitivity and specificity. This has led to an increasing preference for Liquid Chromatography–Tandem Mass Spectrometry (LC-MS/MS) and other advanced analytical methods. Laboratories utilizing these technologies gain a competitive advantage, while those dependent on traditional immunoassays face operational limitations. The adoption of ISO 16140-2 validation standards for alternative testing methods ensures consistency and reliability across global supply chains, but also raises entry barriers for new analytical technologies [3]Source: Royal Society of Chemistry, "Advancements in Food Quality monitoring: integrating biosensors for precision detection", rsc.org . This regulatory-driven transformation is reshaping the competitive dynamics of allergen testing, encouraging investments in high-precision instrumentation and validated methodologies.
Restraints Impact Analysis of Food Allergen Testing Market*
| Restraint | (~) (%) Impact on CAGR Forecast | Geographic Relevance | Impact Timeline |
|---|---|---|---|
| High cost of testing technologies | -1.3% | Global, acute in South America and Middle East and Africa SMEs | Short term (≤ 2 years) |
| Complexity of multi-allergen testing | -0.8% | Global, multi-product plants | Medium term (2-4 years) |
| Limited shelf-life of rapid test kits | -0.6% | Asia-Pacific the Middle East and Africa with long supply chains | Short term (≤ 2 years) |
| Lack of harmonized global methods | -0.7% | Trade interfaces between regulatory zones | Long term (≥ 4 years) |
| Source: Mordor Intelligence | |||
High cost of testing technologies
The substantial capital requirements for advanced allergen testing platforms pose significant entry barriers, particularly for small and medium-sized food manufacturers, which represent the majority of global food production capacity. Confirmatory allergen analysis using LC-MS/MS systems demands an initial investment exceeding USD 500,000, with annual maintenance and consumable costs amounting to approximately USD 100,000 per instrument. Beyond equipment expenses, additional costs include specialized personnel training, method validation, and regulatory compliance documentation, collectively surpassing USD 1 million for comprehensive allergen testing capabilities. This cost structure has led to a segmented market, where large multinational corporations operate in-house testing facilities. At the same time, smaller manufacturers rely on contract testing services, potentially causing delays during periods of high demand. The financial barrier is particularly pronounced in emerging markets, where local laboratories often lack the resources to acquire advanced analytical platforms, resulting in reliance on international testing providers and extended turnaround times for safety assessments.
Complexity of multi-allergen testing
The simultaneous detection of multiple allergens in complex food matrices presents significant technical challenges, limiting market growth and testing efficiency within the industry. Cross-reactivity among allergen proteins can lead to false-positive results. At the same time, matrix interference from food components may suppress analytical signals, resulting in false-negative outcomes that undermine food safety assurance. Regulatory authorities mandate separate validation documentation for each allergen-matrix combination, adding considerable complexity as food manufacturers diversify their product portfolios across various allergen categories. Additionally, processing-induced protein modifications can affect allergen detectability, necessitating specialized extraction methods and analytical techniques, which increase both costs and analytical uncertainty.
*Our forecasts treat driver/restraint impacts as directional, not additive. The impact forecasts reflect baseline growth, mix effects, and variable interactions.
Food Allergen Testing Market Segment Analysis
By Technology:
PCR-Based Methods Drive InnovationIn 2025, immunoassay-based techniques are expected to dominate the market, accounting for 58.17% of the share due to their reliability, cost-effectiveness, and broad compliance with international food safety standards. PCR-based approaches are projected to grow at a CAGR of 7.38% through 2031, driven by their high specificity and ability to detect multiple allergens simultaneously. Mass spectrometry is increasingly utilized for confirmatory testing, particularly in processed foods where protein modifications can affect the accuracy of immunoassays. Spectroscopy and imaging tools are mainly used for rapid screening, while nanobiosensor platforms are advancing on-site testing through smartphone integration and AI-driven analysis.
The market is shifting toward hybrid systems that integrate multiple detection methods to address technical limitations while maintaining cost efficiency for routine testing. Advanced biosensors employing gold nanoparticles and graphene-based transducers are achieving femtomolar-level sensitivity, surpassing the performance of traditional ELISA methods and enabling the detection of trace allergens that were previously undetectable. However, regulatory approval remains a significant challenge, as compliance with ISO 16140-2 requires extensive validation studies, often delaying market entry by 2–3 years.


By Application:
Seafood and Meat Products AccelerateIn 2025, bakery and confectionery products are expected to dominate the allergen testing market, holding a 26.09% share. These products frequently contain multiple allergenic ingredients, such as wheat, eggs, milk, nuts, and soy. The production processes for these items present significant challenges for allergen management due to shared equipment, airborne flour contamination, and complex supply chains, which increase the risk of cross-contact. The seafood and meat segment is projected to grow at the fastest rate, with a CAGR of 9.56%, driven by the expansion of global trade in processed proteins and stricter regulatory oversight on undeclared allergens. Dairy products require extensive testing due to the high prevalence of lactose intolerance and the widespread use of milk-based ingredients in various food categories. The beverage industry is also experiencing increased testing requirements as protein additives and botanical extracts, some of which may contain allergens, are increasingly incorporated into products.
Baby food and infant formula undergo particularly stringent testing, surpassing standard food safety requirements. Regulatory authorities mandate higher analytical sensitivity and more frequent testing to ensure the safety of infants. Alternative protein sources present additional challenges, as plant-based, insect-derived, and fermentation-produced proteins may cross-react with traditional allergens or introduce novel allergenic proteins for which testing protocols are not yet established. This diverse application landscape is driving demand for adaptable analytical platforms that enable rapid method development and validation for emerging food categories, without necessitating entirely new systems.
Geography Analysis
Europe and North America Food Allergen Testing Market
In 2025, Europe leads the allergen testing market with a 34.47% share, driven by robust regulatory frameworks and a well-established testing infrastructure across government laboratories and private service providers. Continuous updates from the European Food Safety Authority on allergen assessment, coupled with stringent cross-contact prevention standards set by the Dutch Food and Consumer Product Safety Authority, highlight the region's strict regulatory environment. These factors sustain consistent demand for allergen testing in the region. North America operates under established FDA and USDA frameworks, with market growth primarily fueled by technological innovations rather than regulatory changes. The region benefits from advanced testing infrastructure and protocols, focusing on integrating emerging allergen detection technologies to enhance efficiency and optimization. This approach emphasizes technological progress over fundamental regulatory reform.
APAC, MEA and South America Food Allergen Testing Market
The Asia-Pacific region is the fastest-growing allergen testing market, with a projected CAGR of 8.98% through 2031. Growth is supported by evolving food safety regulations in China and India as they align with international standards to enhance food export capabilities. Additionally, the rising prevalence of food allergies in Japan drives demand, while South Korea and Australia serve as key testing hubs for multinational food companies operating in the region. South America, along with the Middle East and Africa, presents emerging growth opportunities due to developing regulatory systems and export-driven compliance requirements. However, market growth in these regions is limited by insufficient local analytical capacity and reliance on international testing services.
Global Food Allergen Testing Market
The global allergen testing market demonstrates a clear correlation between regulatory maturity and testing adoption. Regions with stronger regulatory frameworks invest in analytical capabilities to ensure food safety and enhance competitiveness in global trade. Meanwhile, emerging markets are progressively building their testing infrastructure to align with international standards, fostering long-term growth potential. Despite challenges in developing regions, increasing awareness of international food safety standards is driving gradual improvements in testing infrastructure, supporting the overall expansion of the allergen testing market.

Regulatory Landscape
Regulation continues to tighten around allergen labeling, verification, and traceability, making undeclared allergens a recurring compliance trigger for packaged foods and foodservice. In the United States, FDA oversight covers the nine major allergens (including sesame under the FASTER Act), and enforcement has been reinforced through updated allergen-labeling guidance (Edition 5) and greater scrutiny of manufacturing controls such as cleaning validation and environmental monitoring.
Internationally, precautionary allergen labeling (PAL) is moving toward more consistent, risk-based use. In July 2026, the Codex Alimentarius Commission adopted new guidance on when "may contain" statements are warranted (as an annex to the General Standard for the Labelling of Pre-packaged Foods, CXS 1-1985), which provides a stronger anchor for cross-border alignment and increases pressure on manufacturers and labs to back PAL decisions with validated, quantitative evidence rather than qualitative screening alone.
Value Chain Analysis
The value chain runs from (1) reagent, consumable, and instrument suppliers (immunoassay kits, PCR reagents and instruments, and LC-MS/MS workflows), to (2) food manufacturers and co-packers implementing allergen management programs, (3) contract testing laboratories and in-house quality labs operating under ISO/IEC 17025, and (4) regulators and certification or audit bodies that shape sampling, documentation, and method validation expectations. Testing demand is driven by routine raw-material screening, in-process verification (swabs, rinse water, environmental samples), and finished-product release testing, with confirmatory paths that can move from rapid immunoassays to PCR and mass spectrometry as matrix complexity and audit expectations rise.
Key bottlenecks cluster around labeling accuracy and change control, where formulation changes, supplier substitutions, and shared equipment elevate cross-contact risk and increase the cost of revalidation across allergen-matrix combinations. In the United States, the USDA FSIS Allergen Verification Sampling Program for ready-to-eat products, covering screening and confirming 14 allergens plus gluten, increases downstream verification pressure and reinforces the need for validated, fit-for-purpose methods in accredited labs. The FDA FSMA Section 204 traceability enforcement timeline (January 2026) also expands the role of digital records that link test results to lots, suppliers, and corrective actions, tightening feedback loops between plants, labs, and compliance teams.
Competitive Landscape
The food allergen testing market is moderately fragmented, with a few key players maintaining a strong presence. Prominent companies such as Eurofins Scientific, SGS, and Intertek lead the market through extensive global laboratory networks and diverse service offerings. Their competitive advantage is further strengthened by advancements in AI-driven analytics and rapid testing platforms. Competition in the market increasingly centers on regulatory compliance, with companies achieving ISO 17025 accreditation and validating methods to meet international standards.
Emerging markets present significant growth opportunities, as local testing capabilities often fail to meet regulatory requirements, driving demand for international laboratory services and technology partnerships. Traditional laboratory-based testing is facing growing competition from innovative technologies such as nanobiosensors and smartphone-enabled analytical tools, which offer point-of-use testing solutions. The adoption of these technologies challenges conventional centralized testing models, encouraging companies to develop alternatives that bypass standard laboratory infrastructure.
Market dynamics are also shaped by the importance of comprehensive service offerings and technological differentiation, as companies strive to gain market share from regional providers. Smaller niche players focus on specialized areas, such as alternative protein testing and the detection of emerging allergens, addressing specific needs that larger firms may not prioritize. These smaller companies benefit from their agility, enabling them to respond quickly to new demands. Regulatory validation requirements play a critical role in shaping the competitive landscape, creating barriers to entry for new technologies while solidifying the position of established companies with proven methodologies and extensive documentation. Overall, the regulatory framework continues to influence market structure and competitive dynamics across the industry.
Food Allergen Testing Industry Leaders
-
SGS S.A.
-
Intertek Group PLC
-
Eurofins Scientific SE
-
Bureau Veritas S.A.
-
Microbac Laboratories
- *Disclaimer: Major Players sorted in no particular order
Food Allergen Testing Market Companies Covered in this Report
- Eurofins Scientific SE
- SGS SA
- Intertek Group PLC
- Bureau Veritas SA
- Microbac Laboratories Inc.
- Thermo Fisher Scientific
- Neogen Corporation
- Mérieux NutriSciences
- Agilent Technologies
- Romer Labs
- ALS Limited
- FOSS
- Charm Sciences
- Bio-Rad Laboratories
- 3M Company
- Quest Diagnostics
- EMSL Analytical
- Danaher Corporation
- bioMérieux
- Hygiena
- PerkinElmer
- R-Biopharm AG
- Shimadzu Corporation

Market Opportunities and Future Outlook
Opportunities are building around quantitative, multi-allergen measurement that can stand up to audits and scrutiny across regions, as standards and guidance increasingly emphasize method performance, validation, and risk-based decision-making. BS EN 17855:2024 establishes minimum performance requirements for quantitative measurement across a broad set of allergens, strengthening the business case for laboratories and instrument vendors that can deliver repeatable quantitation in complex matrices (including processed foods where protein modification affects immunoassays). Many providers are moving toward multi-method strategies that combine screening (rapid immunoassay) with confirmatory tools (PCR and LC-MS/MS).
Service-network expansion and platform capability upgrades also remain key routes to scaling capacity and improving turnaround times, particularly where local analytical infrastructure cannot absorb demand. Consolidation and investment signals include Mérieux NutriSciences completing the acquisition of Bureau Veritas food laboratory testing activities (2025) and SGS acquiring Murray-Brown Laboratories (March 2026), both of which expand testing footprints and broaden allergen-related food safety work. On the technology side, instrument and workflow investments support higher-throughput, lower-LOQ testing and faster method development, including Thermo Fisher Scientific announcing a USD 2 billion U.S. manufacturing and R&D investment in April 2025 for analytical instruments relevant to allergen detection workflows, and Bio-Rad Laboratories announcing in February 2025 a plan to acquire Stilla Technologies to add multiplex digital PCR capabilities for DNA-based confirmation when protein targets are challenging.
Recent Industry Developments in Food Allergen Testing Market
- March 2026: SGS acquired Murray-Brown Laboratories, a Denver-based food testing lab, expanding its North American capacity in microbial and analytical chemistry testing relevant to food safety programs. The deal broadens local laboratory access for manufacturers that need faster turnaround and accredited documentation to support allergen control and verification.
- September 2025: Mérieux NutriSciences completed the acquisition of Bureau Veritas' global food laboratory testing business, adding laboratories across the Americas, Africa, and Asia-Pacific. Integration strengthens multinational testing coverage and increases competitive pressure on other global networks to match geographic reach and service breadth.
- September 2024: USDA FSIS implemented a new allergen verification sampling program for ready-to-eat products, supported by the CLG-ALG1 method for screening and confirming 14 allergens plus gluten. The program raises the bar for label-claim verification and pushes processors to tighten in-plant controls and rely more on validated laboratory workflows to reduce misbranding and recall exposure.


Food Allergen Testing Market Report Scope and Research Methodology
Market Definition and Coverage
This market covers revenues earned from testing food and beverage products for allergen presence, supporting compliance, labeling, and routine quality checks. We include both common lab-based methods and faster detection approaches used across major regions.
Scope exclusions: We exclude allergen-free food product sales, consumer diagnostics, and broader food microbiology tests that are not aimed at allergen detection.
Segments Covered in This Report
-
By Technology
- Immunoassay-Based
- Polymerase Chain Reaction-Based
- Mass-Spectrometry-Based
- Spectroscopy and Imaging
- Others
-
By Application
- Bakery and Confectionery
- Dairy Products
- Seafood and Meat Products
- Beverages
- Baby Food and Infant Formula
- Others
-
By Geography
-
North America
- United States
- Canada
- Mexico
- Rest of North America
-
Europe
- Germany
- United Kingdom
- France
- Italy
- Spain
- Rest of Europe
-
Asia-Pacific
- China
- Japan
- India
- South Korea
- Australia
- Rest of Asia-Pacific
-
South America
- Brazil
- Argentina
- Rest of South America
-
Middle East and Africa
- Saudi Arabia
- United Arab Emirates
- South Africa
- Rest of Middle East and Africa
-
North America
Data Sources, Market Sizing, and Validation
Desk Research
Desk research was used to build the starting market structure and to set practical boundaries around what counts as food allergen testing revenue. We reviewed public food safety and labeling requirements, recall and enforcement signals, and accredited lab quality guidance to estimate where testing is most likely to be required and which laboratory methods are widely accepted.
Sources included guidance and data from the US FDA, the USDA, and the European Commission, along with Codex Alimentarius materials and ISO references around lab competence (for example, ISO 17025). We also reviewed peer reviewed publications on ELISA, PCR, and mass spectrometry performance in food matrices. To ground the demand and supply picture, we checked company filings, investor presentations, association pages, and reputable press for capacity expansion, new testing offerings, and pricing cues, then complemented this with paid subscriptions for company financial intelligence, patent landscapes, and shipment-level import and export context where relevant. These desk sources are not exhaustive, and additional public references were used for data capture, validation, and clarification.
Primary Interviews and Surveys
Primary interviews focused on validating what testing volumes look like inside routine quality programs, and on how pricing varies by detection method, turnaround time, and sample complexity. We spoke with commercial laboratories, in-house QA teams at food manufacturers, kit and instrument stakeholders, and accreditation and compliance specialists across APAC, EMEA, and the Americas. This helped close gaps that desk sources do not specify clearly, and it aligned assumptions to real buying behavior.
Distribution of primary research fieldwork respondents
| Company type | Respondent position | Region |
|---|---|---|
| Top tier: 38% | CXOs: 12% | APAC: 48% |
| Mid tier: 41% | Functional/Unit leaders: 36% | EMEA: 30% |
| Smaller Players: 21% | Managers: 52% | Americas: 22% |
Market-Sizing & Forecasting
Sizing begins with a top-down demand pool built around packaged food and beverage output and trade flows, then adjusted using allergen labeling intensity patterns. We tied testing intensity to labeling rules, recall exposure, and export compliance needs. After directionally setting volumes, we ran selective bottom-up checks, such as sampled lab throughput by method and an ASP x test volume build, so totals could be corrected when early results diverged from what practitioners reported.
Key inputs used in the model include the mix of testing technologies in use (ELISA versus PCR versus mass spectrometry), the share of higher risk categories such as infant formula and ready-to-eat foods, average retest frequency for in-process verification, and the growth in accredited lab capacity and outsourcing. We also used typical method-level price differences by turnaround expectations. Where interviews indicated missing coverage for smaller labs or seasonal peaks, we applied conservative utilization ranges and then stress-tested totals against recall and regulatory activity signals.
For forecasting, we ran scenario analysis to reflect how enforcement intensity, export standards, and method adoption can shift differently by region. We then smoothed year-to-year swings using a simple trend fit on validated drivers. Assumptions on method mix changes and ASP progression were reviewed with primary respondents before finalizing the forward curve.
Data Validation & Update Cycle
Outputs were triangulated across independent signals, and the model was checked for odd jumps by technology, application, and region before sign-off. When a large variance showed up, we re-tested the drivers, and triggered follow-up outreach to confirm whether it reflected a true market change or a modeling artifact.
A second analyst review was completed to verify arithmetic integrity, scope consistency, and that each key assumption could be traced back to a source or an interview note. The report is refreshed annually, with interim updates added when material events occur, such as major labeling changes, large recall waves, or notable capacity expansions. Before delivery, a final pass is completed so clients receive the most current view.
Mordor Intelligence's Food Allergen Testing Market Sizing Compared With Other Published Estimates
Published figures for food allergen testing vary because the market boundary can be defined differently, and because firms do not always treat method mix and pricing consistently. The table makes the spread easier to interpret and points to the most common drivers behind differences.
The table indicates that much of the gap stems from what gets counted as market revenue and how the base year is aligned, because in Mordor Intelligence's model the value tracks testing services and related revenues tied directly to allergen detection workflows, instead of including adjacent food safety categories that can broaden the totals.
Benchmark comparison
| Source | Market Size | Gaps in Research Methodology |
|---|---|---|
| Mordor Intelligence | USD 1.18 B (2025) | |
| Industry Publisher A | USD 0.97 B (2025) | Uses a different starting base and appears to apply a narrower revenue lens that can undercount higher value methods and premium turnaround pricing, which shifts the 2025 total downward. |
| Industry Publisher B | USD 0.83 B (2024) | Reports a prior-year value and may blend historical averaging with a broader source split, which can miss the step-up from changing enforcement and method adoption when mapped into a 2025-equivalent view. |
Taken together, the comparison suggests the biggest drivers are scope edges, the year used for the stated value, and how method-level prices are treated. By keeping the steps tied to observable testing intensity and practical price bands, the estimate stays repeatable and easier to reconcile when new regulation or recall patterns change the demand signal.


Key Questions Answered in the Report
How large will the food allergen testing market be by 2031?
It is projected to reach USD 1.89 billion by 2031, growing at a 6.96% CAGR from 2026 to 2031.
Which technology is expanding fastest in allergen detection?
PCR methods are advancing at a 7.38% CAGR because retailers and auditors now require DNA-level confirmation.
Why is Asia-Pacific the fastest-growing region?
Accelerating processed-food exports and adoption of EU-style labeling rules are driving an 8.98% regional CAGR.
What drives the high testing intensity in infant formula?
EU rules mandate allergen screening on every production batch, pushing manufacturers toward rapid PCR assays for sub-ppm limits.
Page last updated on:


 Your data is secure and never sold or shared.


