Water Taxi Market Size and Share
Market Overview
| Study Period | 2019 - 2030 |
|---|---|
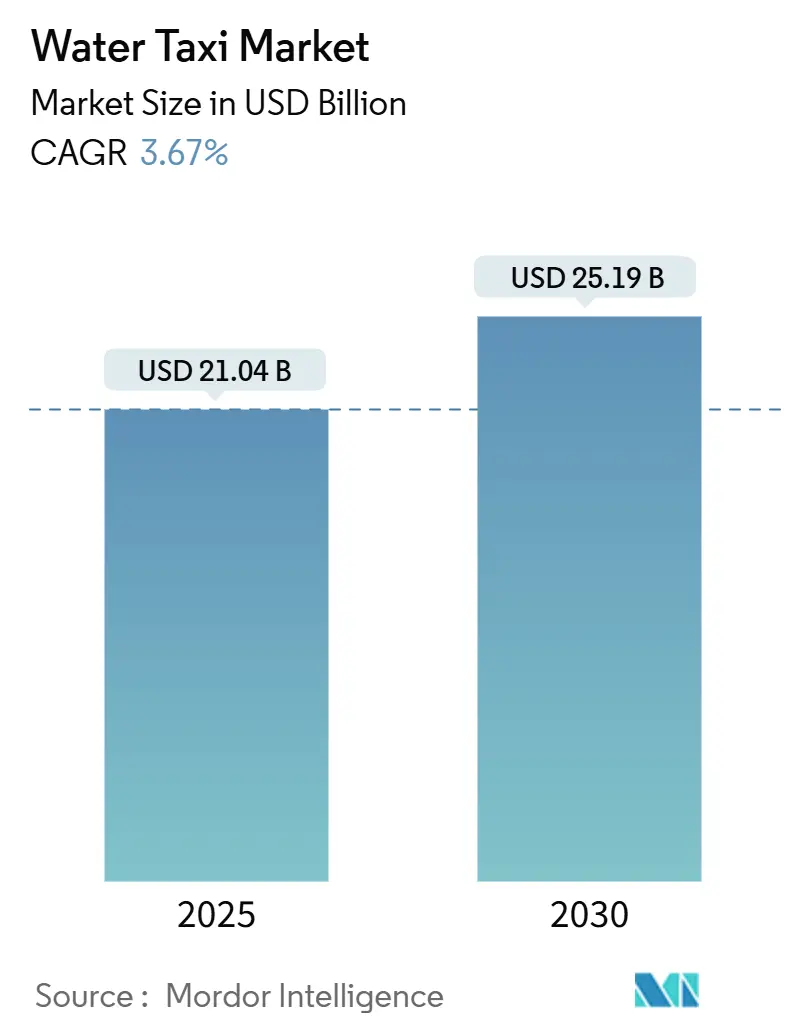
| Market Size (2025) | USD 21.04 Billion |
| Market Size (2030) | USD 25.19 Billion |
| Growth Rate (2025 - 2030) | 3.67% CAGR |
| Fastest Growing Market | Asia Pacific |
| Largest Market | North America |
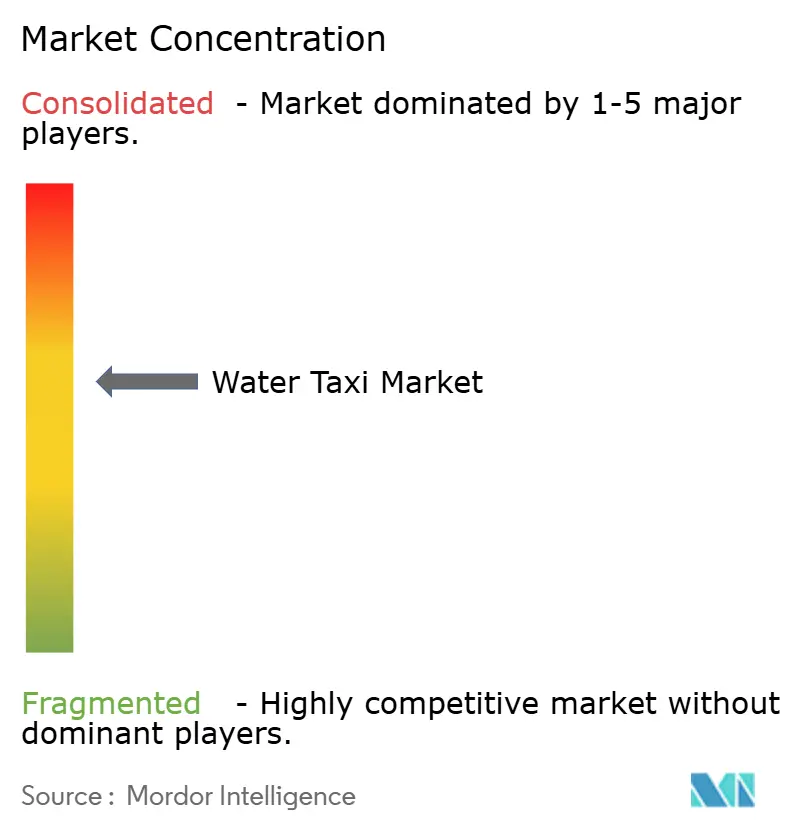
| Market Concentration | Medium |
Major Players *Disclaimer: Major Players sorted in no particular order Image © Mordor Intelligence. Reuse requires attribution under CC BY 4.0. | |
Water Taxi Market Analysis by Mordor Intelligence
The Water Taxi Market size is estimated at USD 21.04 billion in 2025, and is expected to reach USD 25.19 billion by 2030, at a CAGR of 3.67% during the forecast period (2025-2030). The expansion is supported by municipal policies that redirect commuters from gridlocked roadways to inland and coastal waterways, phased emission‐control regulations, and tourism authorities repositioning waterborne transport as a premium visitor experience. Operators embed dynamic routing into mobile applications, enabling real-time demand aggregation that lifts average load factors even during shoulder seasons. Early adopters in North America and Western Europe show that electric and hybrid propulsion can reduce direct operating expenses by up to one-fourth, accelerating fleet electrification plans. Capital requirements remain high, yet public–private partnerships lower barriers by sharing terminal construction costs and offering preferential docking rights to qualified bidders.
Key Report Takeaways
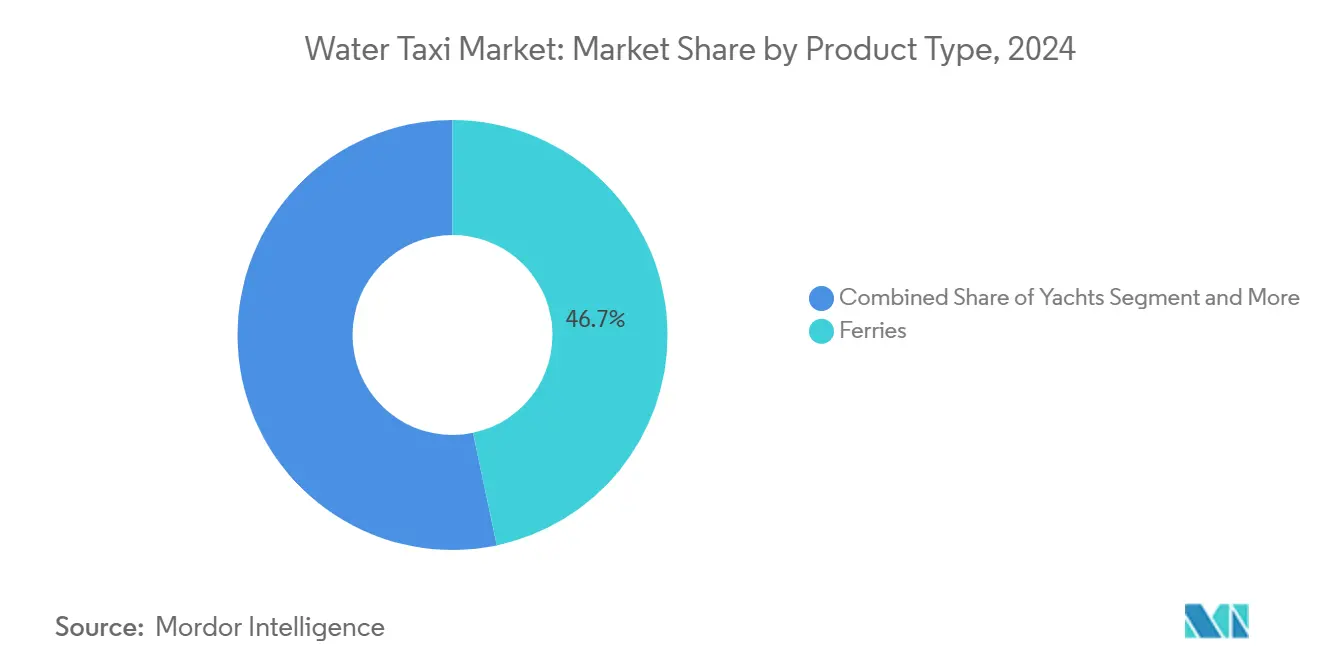
- By product type, ferries led the water taxi market with 46.67% share in 2024, while yachts are forecast to post the fastest 3.69% CAGR during the forecast period (2025-2030).
- By propulsion, diesel vessels accounted for 56.72% of the water taxi market size in 2024, whereas electric systems are projected to expand at a 3.68% CAGR during the forecast period (2025-2030).
- By length, craft above 10 m held 63.48% of the water taxi market size in 2024, yet vessels up to 10 m are expected to grow at a 3.73% CAGR during the forecast period (2025-2030).
- By boat size, the 30-50 ft class captured 46.81% of the water taxi market share in 2024, and boats below 30 ft are expected to grow at a 3.77% CAGR during the forecast period (2025-2030).
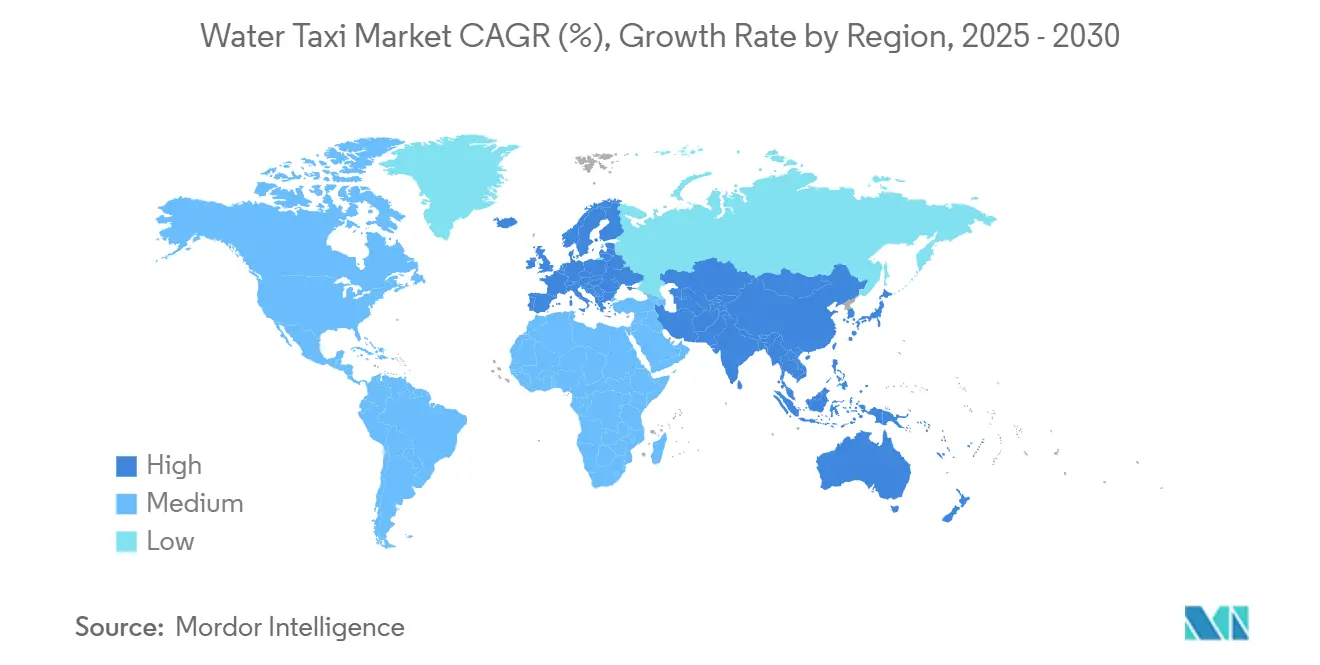
- By geography, North America commanded 38.94% of the water taxi market by region in 2024, while the Asia-Pacific region is expected to grow at a 3.76% CAGR during the forecast period (2025-2030).
Global Water Taxi Market Trends and Insights
Drivers Impact Analysis*
| Driver | (~) % Impact on CAGR Forecast | Geographic Relevance | Impact Timeline |
|---|---|---|---|
| Eco-friendly urban mobility | +0.8% | Global; early adoption in North America and EU | Medium term (2-4 years) |
| Coastal and marine tourism | +0.6% | Global; Asia Pacific and Mediterranean focus | Short term (≤ 2 years) |
| Government maritime commuter infrastructure | +0.5% | North America, EU, select Asia Pacific | Long term (≥ 4 years) |
| Ride-hailing platform integration | +0.4% | Urban coastal markets worldwide | Medium term (2-4 years) |
| Hydrofoiling electric-vessel technology | +0.3% | EU and North America | Long term (≥ 4 years) |
| Waterfront real-estate development | +0.2% | Global urban coasts | Long term (≥ 4 years) |
| Source: Mordor Intelligence | |||
Growing Demand for Eco-Friendly Urban Mobility
Cities that enforce zero-emission corridors force operators to transition from diesel to battery propulsion, reserving premium routes for compliant fleets[1]“Emission‐Control Areas for Inner-City Waterways,” Stockholm City Planning Office, stockholm.se . Electric water taxis cut energy use nearly in half relative to gasoline outboards, a gap that widens as carbon pricing spreads across Europe and North America. Lower vibration and noise profiles unlock berthing rights in residential zones once closed to conventional craft. Municipal transit agencies now bundle water taxi tickets with subway and bus passes via contactless cards, boosting inter-modal ridership. As more ports electrify, early movers secure grid-priority charging slots, translating into schedule reliability advantages.
Rising Coastal & Marine Tourism
Leisure travel rebounded in 2024 and continues into 2025 with a tilt toward outdoor, small-group experiences. Destination marketing organizations highlight panoramic harbor rides as an alternative to crowded bus tours, smoothing traffic on heritage streets[2]“Sustainable Tourism Recovery Initiatives,” European Commission, europa.eu . Cruise operators’ pre-book local water taxis to disperse passengers quickly during port calls, injecting weekday demand that once lagged. Tropical islands deploy branded water shuttles to extend the eco-resort's stay radius, generating incremental spending at remote dining venues. Peak-season fleet upsizing pairs with data-guided rightsizing during off-peak months to keep average utilization above three-fifths.
Government Investments in Maritime Commuter Infrastructure
Federal and state grants increasingly list waterborne transit under eligible clean-transport projects[3]“Water Taxi Program Investments 2025,” Washington State Department of Transportation, wsdot.wa.gov . Shared-use piers, ADA-compliant gangways, and shore-power pedestals draw private operators that previously balked at capital exposure. Terminal co-location with rail hubs compresses first-mile transfer times to under 10 minutes in several United States metros. Public agencies also offer route-planning data through open APIs, enabling operators to synchronize schedules with buses and trains. Long-term, policy roadmaps call for hybrid-electric fleet percentages to exceed half by 2030 in several jurisdictions.
Ride-Hailing Platforms Integrating On-Demand Water-Taxi Booking
Mobility-as-a-service apps normalize purchasing a dock-to-door seat alongside a traditional car ride[4]“Expanding Mobility on the Water,” Uber Technologies, uber.com . Live GPS feeds reassure infrequent riders, and in-app payment eliminates on-board queues. Dynamic pricing helps operators monetize peak periods, while predictive analytics smooths fleet deployment across multiple docks. For commuters, bundled monthly passes automatically allocate seats to the fastest available modality, raising overall water taxi market penetration in cities with constrained bridge capacity.
Restraints Impact Analysis*
| Restraint | (~) % Impact on CAGR Forecast | Geographic Relevance | Impact Timeline |
|---|---|---|---|
| High capital and operating costs | -0.9% | Global; most acute in emerging markets | Short term (≤ 2 years) |
| Stringent safety and certification regulations | -0.4% | Global; varying by jurisdiction | Medium term (2-4 years) |
| Limited shoreline charging infrastructure | -0.3% | Early electric adoption markets | Medium term (2-4 years) |
| Seasonal demand fluctuations | -0.2% | North America, Northern EU, temperate Asia Pacific | Short term (≤ 2 years) |
| Source: Mordor Intelligence | |||
High Capital & Operating Costs of Vessels & Terminals
An electric water taxi priced higher can cost over twice its diesel peer, mainly because of battery packs and composite hulls. Insurance premiums also rise with asset value, compounding cash-flow pressure. Onshore, floating terminals outfitted with rapid chargers carry six-figure price tags that many family-owned operators cannot absorb. Financing structures increasingly rely on vendor leasing or municipal revenue bonds to mitigate upfront outlays. Crew wages remain fixed regardless of passenger load, driving consolidation among operators seeking economies of scale.
Stringent Safety & Certification Regulations
Annual hull surveys, life-saving appliance checks, and crew re-qualification hours add downtime and direct cost. Certification pathways vary widely; an operator crossing state lines might navigate three regulatory regimes daily. Design mandates for redundancy cut passenger capacity by as much as one-tenth to accommodate extra flotation compartments. Smaller firms often outsource compliance management, increasing overhead.
*Our forecasts treat driver/restraint impacts as directional, not additive. The impact forecasts reflect baseline growth, mix effects, and variable interactions.
Segment Analysis
By Product Type: Ferries Retain Dominance as Niche Yachts Accelerate
Ferries contributed a 46.67% share to the water taxi market in 2024, underscoring their centrality to daily commuting corridors where reliability outweighs bespoke service. Full-height boarding ramps, enclosed cabins, and ADA access increase capital costs, but secure municipal subsidies and predictable commuter flows justify the investment. Yachts, conversely, are on course for the swiftest 3.69% CAGR during the forecast period (2025-2030), propelled by luxury tourism groups that sell curated harbor cruises at premium fares. Hybrid sightseeing–commuter craft blur lines by offering café amenities during rush hour service, boosting onboard spend.
Fleet renewal in the ferry segment skews toward 300-passenger catamarans with hybrid propulsion to meet emission directives. Meanwhile, yacht operators experiment with hydrofoil-equipped hulls that deliver 25-knot cruise speeds at fractional energy burn. Regulatory distinctions favor ferries on staple routes due to proven safety records, yet tax concessions for small-tonnage vessels entice investors into the boutique yacht charter space.


By Propulsion Type: Electric Gains Ground on Entrenched Diesel
Diesel maintained a 56.72% share of the water taxi market in 2024, owing to its extensive refueling network and long-range capability. Even so, electric propulsion is accelerating at a 3.68% CAGR during the forecast period (2025-2030), buoyed by falling battery prices and stricter harbor‐emission caps. Range-extender hybrids bridge the gap; operators switch to silent electric mode within 3 nm of downtown piers to comply with noise bylaws, then engage diesel gensets on peripheral legs.
Battery chemistries shift toward lithium iron phosphate for safety and cycle-life gains. Service records from early adopters show maintenance intervals stretching to 18 months versus 12 months for diesel, creating hidden savings that offset initial capital. Manufacturers bundle telematics for remote diagnostics, minimizing unplanned downtime. Carbon credit earnings further tilt the total-cost-of-ownership equation toward electrical power.
By Length: Agile Sub-10 m Craft Outpace Larger Rivals
Craft exceeding 10 m accounts for a 63.48% share of the water taxi market in 2024, due to their higher passenger counts and seaworthiness on exposed crossings. Nonetheless, sub-10 m boats are expected to grow with a 3.73% CAGR during the forecast period (2025-2030), as dense urban canals and river loops favor shallow-draft hulls capable of quick pivots. Operators capitalize on reduced crewing rules for smaller vessels, lowering hourly labor expenses.
Advancements in lightweight composite materials and compact electric drivetrains permit 20-passenger capacities within 9 m envelopes without sacrificing stability. Municipal planners add micro-pontoons every 500 m along revitalized quays, tailoring infrastructure to small-craft footprints. Large vessels continue to dominate long-haul contracts but will cede intracity segments to nimble startups.

By Boat Size: Below-30 ft Segment Sets the Pace
The 30-50 ft bracket accounts for a 46.81% share of the water taxi market in 2024, ideally sized for 100-passenger commuter duty and tour-boat charters. Yet vessels under 30 ft are expected to grow with a 3.77% CAGR during the forecast period (2025-2030) as entrepreneurs deploy 6 to 12-seat shuttles that respond to app-driven callouts. Regulatory carve-outs exempting sub-30 ft boats from specific pilotage rules trim compliance costs.
Prototype 28-foot fully electric pontoons launched in 2024 run eight-hour cycles between charges, validating economics for short-haul loops. Meanwhile, mid-size craft integrates battery-swap trays, cutting turnaround to 10 minutes and enabling clock-face scheduling. Above-50-foot units increasingly pivot toward excursion cruises and private events rather than daily ferry service.
Geography Analysis
North America captured 38.94% share of the water taxi market in 2024, anchored by legacy ferry routes in Puget Sound, Boston Harbor, and the San Francisco Bay. Federal clean-transport grants subsidize vessel electrification, including multi-port rapid-charging corridors along the U.S. West Coast. Canadian cities follow suit, with Vancouver trialing autonomous electric shuttles for False Creek commuters. Tourism flows rebound, pushing ticket volumes above 2019 by mid-2025 in New York and Miami.
Asia-Pacific is projected to have the fastest 3.76% CAGR during the forecast period (2025-2030) due to accelerated urbanization in coastal China, Vietnam, and Indonesia. Governments bundle water taxi infrastructure into broader blue-economy strategies, exemplified by Indonesia’s National Capital Relocation plan that earmarks riverine connectors. Low-cost labor and favorable free-trade zones draw foreign builders to set up regional assembly lines, trimming delivery lead times. Tropical climate confers year-round ridership, shoring up operator cash flows.
Europe’s growth stays moderate but stable as historic cities such as Amsterdam extend zero-emission zones that effectively reserve canal rights for electric fleets. Investment in hydrogen refueling pilot sites across Italy and Norway signals diversification beyond batteries. Southern Europe leverages Mediterranean cruise traffic, deploying seasonal shuttles that ferry guests from anchored liners directly to old-town promenades. At the same time, Nordics invest heavily in ice-capable hulls to sustain winter service.

Competitive Landscape
Incumbent boatbuilders concentrate on modular platforms that accept diesel, hybrid, or full-electric drivetrains, hedging against propulsion uncertainty. Brunswick’s Whaly line ships with pre-wired conduits to support battery retrofits, accelerating time-to-market for electrified variants. Meanwhile, Candela Technology and Navier double down on hydrofoil R&D to leapfrog incumbent efficiency metrics.
Strategic alliances proliferate. Torqeedo licenses BMW i3 battery modules, securing automotive economies of scale, while ferry operator Kitsap Transit signs a multi-year service contract with BAE Systems for hybrid powertrains. Capital-rich tech entrants pursue autonomy; Sea-Machines Robotics pilots remote-command modules that cut crew counts on fixed routes by one-third.
New entrants capitalize on software differentiation. Ride-hailing majors integrate open API booking, funneling latent demand toward partner fleets and skimming platform fees. Mid-tier operators respond by forming purchasing consortia to negotiate lower battery prices, tightening cost competitiveness. Regulatory compliance remains a moat: yards with in-house naval architects expedite safety certification, whereas start-ups rely on third-party consultants, extending timelines.
Water Taxi Industry Leaders
Beneteau Group
Brunswick Corporation
Azimut-Benetti Group
Ferretti Group
Sunseeker International
- *Disclaimer: Major Players sorted in no particular order

Recent Industry Developments
- May 2025: Volvo Penta unveiled a new fully electric marine propulsion range, leveraging the established Volvo Penta IPS platform.
- December 2024: Vision Marine Technologies announced a production partnership with Massimo Marine to build fully integrated 30-ft electric pontoon platforms for commercial and recreational markets, leveraging Massimo’s Texas facilities and dealer network.
- August 2024: Volvo Penta confirmed a late-2025 launch of a fully integrated diesel-electric hybrid package for the heavy-duty D13 IPS range, featuring a 160-kW motor, optimized batteries, and CCS2 fast-charge compatibility up to 250 kW.


Global Water Taxi Market Report Scope
| Yachts |
| Cruise |
| Ferries |
| Sail Boats |
| Electric |
| Diesel |
| Hybrid |
| Up to 10 m |
| Above 10 m |
| Below 30 ft |
| 30–50 ft |
| Above 50 ft |
| North America | United States |
| Canada | |
| Rest of North America | |
| South America | Brazil |
| Argentina | |
| Rest of South America | |
| Europe | United Kingdom |
| Germany | |
| Spain | |
| Italy | |
| France | |
| Russia | |
| Rest of Europe | |
| Asia-Pacific | India |
| China | |
| Japan | |
| South Korea | |
| Rest of Asia-Pacific | |
| Middle East and Africa | United Arab Emirates |
| Saudi Arabia | |
| Turkey | |
| Egypt | |
| South Africa | |
| Rest of Middle East and Africa |
| By Product Type | Yachts | |
| Cruise | ||
| Ferries | ||
| Sail Boats | ||
| By Propulsion Type | Electric | |
| Diesel | ||
| Hybrid | ||
| By Length | Up to 10 m | |
| Above 10 m | ||
| By Boat Size | Below 30 ft | |
| 30–50 ft | ||
| Above 50 ft | ||
| By Region | North America | United States |
| Canada | ||
| Rest of North America | ||
| South America | Brazil | |
| Argentina | ||
| Rest of South America | ||
| Europe | United Kingdom | |
| Germany | ||
| Spain | ||
| Italy | ||
| France | ||
| Russia | ||
| Rest of Europe | ||
| Asia-Pacific | India | |
| China | ||
| Japan | ||
| South Korea | ||
| Rest of Asia-Pacific | ||
| Middle East and Africa | United Arab Emirates | |
| Saudi Arabia | ||
| Turkey | ||
| Egypt | ||
| South Africa | ||
| Rest of Middle East and Africa | ||


Key Questions Answered in the Report
How large is the water taxi market in 2025?
The water taxi market was USD 21.04 billion in 2025 and is on track to reach USD 25.19 billion by 2030.
Which region currently leads in passenger numbers?
North America holds 38.94% of global demand thanks to mature ferry networks and supportive funding.
What is driving the shift toward electric propulsion?
Zero-emission regulations, lower maintenance costs, and rising carbon prices collectively push operators toward battery-electric fleets.
Which vessel category is expanding the fastest?
Boats under 30 ft record a 3.77% CAGR as app-based operators deploy agile craft for on-demand urban service.
How are ride-hailing platforms influencing adoption?
Integrated booking and payment reduce friction for first-time riders, lifting utilization rates and accelerating revenue growth for partnered fleets.
Page last updated on:


