Liquid Waste Management Market Size and Share
Market Overview
| Study Period | 2021 - 2031 |
|---|---|
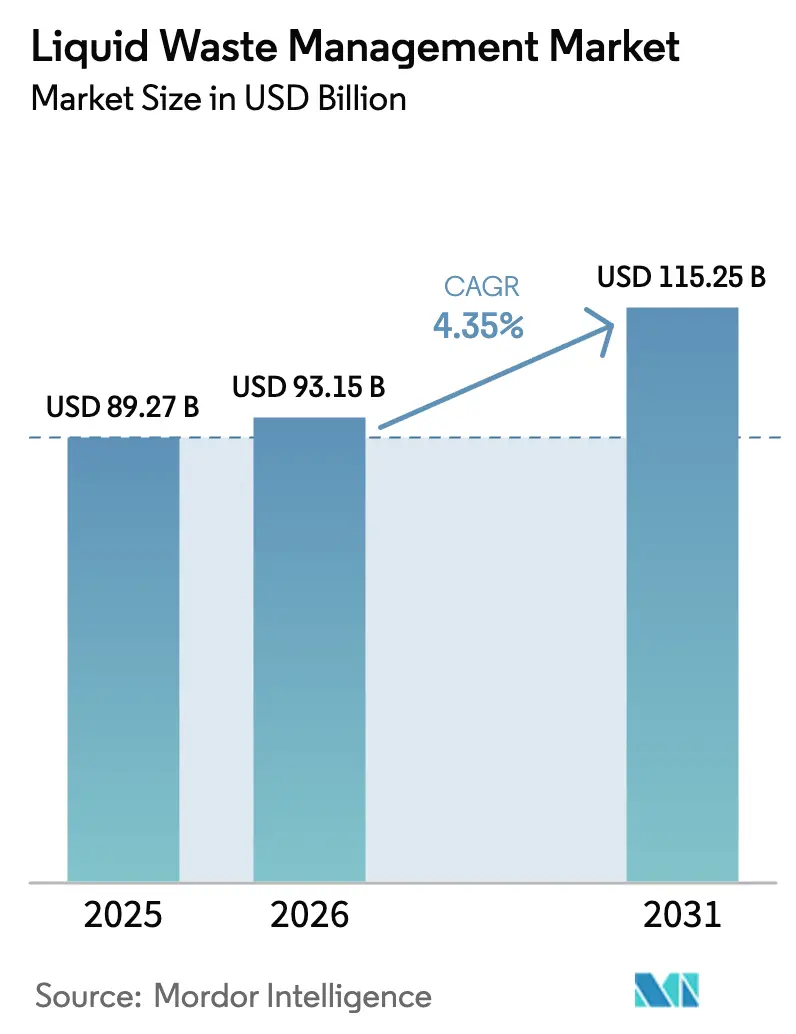
| Market Size (2026) | USD 93.15 Billion |
| Market Size (2031) | USD 115.25 Billion |
| Growth Rate (2026 - 2031) | 4.35% CAGR |
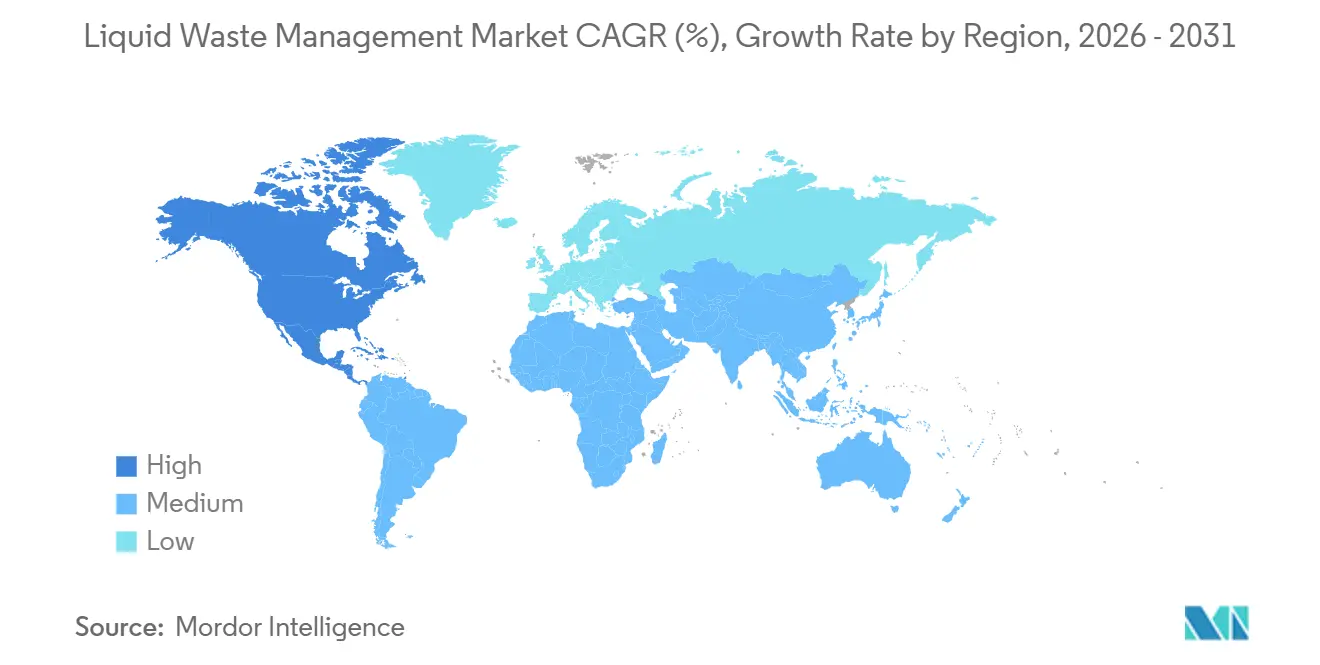
| Fastest Growing Market | North America |
| Largest Market | North America |
| Market Concentration | Low |
Major Players *Disclaimer: Major Players sorted in no particular order Image © Mordor Intelligence. Reuse requires attribution under CC BY 4.0. | |
Liquid Waste Management Market Analysis by Mordor Intelligence
The Liquid Waste Management Market size is expected to grow from USD 89.27 billion in 2025 to USD 93.15 billion in 2026 and is forecast to reach USD 115.25 billion by 2031 at 4.35% CAGR over 2026-2031. Stricter discharge limits, rising industrial complexity, and expanding zero-liquid-discharge mandates underpin this steady trajectory, while capital programs for municipal upgrades inject multiyear visibility. Operators are accelerating biological retrofits because ozone polishing or membrane trains alone cannot meet tightening nutrient caps cost-effectively. Service providers with vertically integrated transportation and treatment assets continue to capture margin, yet supply shortages for hazardous-waste incineration spark pricing power for regional specialists. Implementation of PFAS rules in the United States and Europe is carving out high-value niches for ion-exchange, granular-activated-carbon, and supercritical-water-oxidation vendors.
Key Report Takeaways
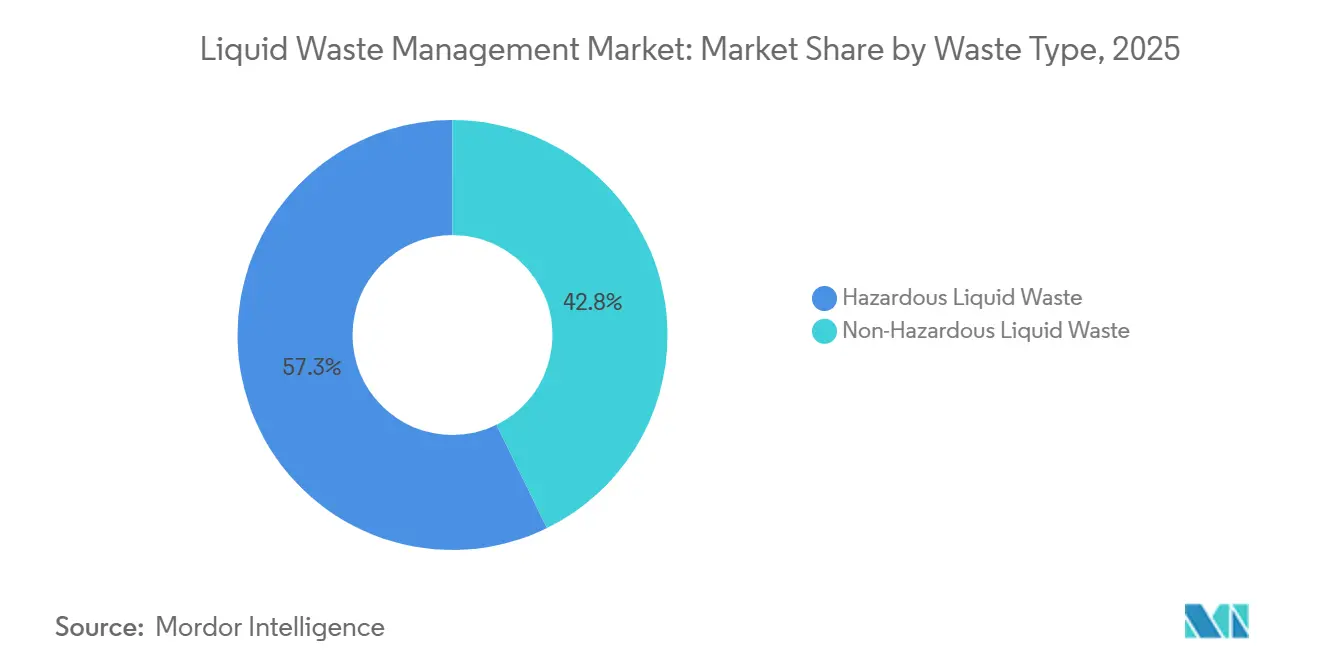
- By waste type, hazardous liquid waste held 57.25% of the liquid waste management market share in 2025, and the same segment is projected to record a 5.29% CAGR through 2031.
- By source, residential flows accounted for 43.44% of the liquid waste management market size in 2025, while industrial effluent is advancing at a 5.18% CAGR to 2031.
- By service, transportation and hauling controlled 52.51% of revenue in 2025, whereas disposal and recycling are set to expand at a 5.27% CAGR through 2031.
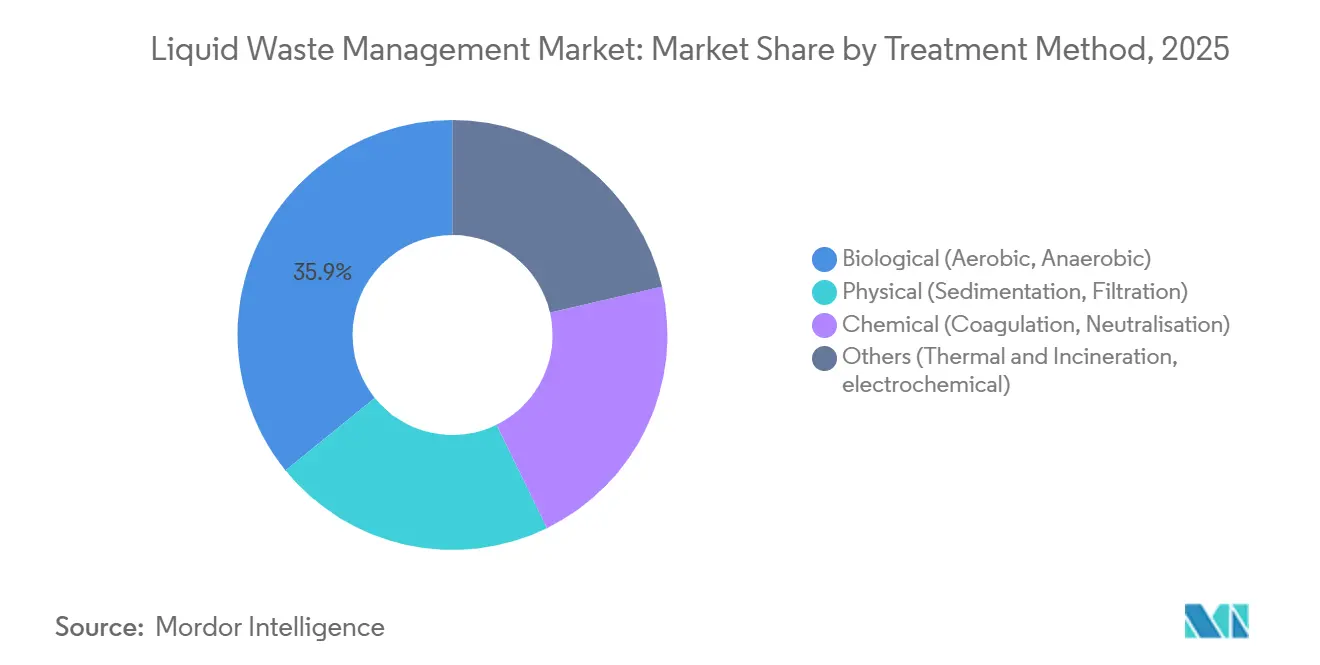
- By treatment method, biological systems captured 35.85% of installed capacity in 2025 and are growing at a 5.38% CAGR.
- By end-user industry, metal refining led with 33.77% demand in 2025; petrochemical and refinery applications are forecast to grow fastest at 5.82% through 2031.
- By Geography, North America held 43.64% of the liquid waste management market share in 2025, and is anticipated to record the fastest CAGR of 4.76% through 2031.
Note: Market size and forecast figures in this report are generated using Mordor Intelligence’s proprietary estimation framework, updated with the latest available data and insights as of January 2026.
Global Liquid Waste Management Market Trends and Insights
Driver Impact Analysis*
| Drivers | (~) % Impact on CAGR Forecast | Geographic Relevance | Impact Timeline |
|---|---|---|---|
| Regulation-driven discharge limits tightening across OECD and BRICS economies | +1.2% | Global, with peak enforcement in North America, EU, and China | Medium term (2-4 years) |
| Re-industrialisation waves in semiconductors, battery and biomanufacturing hubs | +0.9% | North America, EU, and East Asia (South Korea, Taiwan, Japan) | Long term (≥4 years) |
| Growing healthcare and pharmaceutical wastewater volumes | +0.7% | Global, concentrated in India, China, and United States | Medium term (2-4 years) |
| Government funding for sewage treatment plants and effluent treatment plants | +0.8% | Asia-Pacific (India, Southeast Asia), Middle East, and South America | Long term (≥4 years) |
| PFAS "forever-chemicals" removal mandates creating new revenue pools | +0.6% | North America and EU, with emerging adoption in Australia and Japan | Short term (≤2 years) |
| Source: Mordor Intelligence | |||


Regulation-Driven Discharge Limits Tightening Across OECD and BRICS Economies
Effluent rules published since 2024 are forcing both municipal and industrial operators to retrofit primary and secondary stages, driving immediate demand for activated-carbon, ozonation, and membrane upgrades. The European Union lowered total organic carbon discharge limits for chemical facilities from 50 mg/L to 20 mg/L, compelling polishing steps that lift operating expenditure by 10%[1]European Integrated Pollution Prevention and Control Bureau, “Best Available Techniques Reference Document for the Chemicals Sector,” eippcb.jrc.ec.europa.eu. India’s textile code simultaneously cut biochemical-oxygen-demand caps to 30 mg/L and introduced color limits, accelerating membrane-bioreactor adoption among small mills[2]Central Pollution Control Board, “Revised Effluent Standards for Textile Industry,” cpcb.nic.in. Brazil restricted nitrogen and phosphorus releases from agro-industrial plants, pushing anaerobic digestion retrofits. Compliance windows span 18–36 months, concentrating project pipelines and raising near-term capital intensity for engineering firms.
Re-Industrialization Waves in Semiconductors, Battery, and Biomanufacturing Hubs
Subsidy programs in the United States, the European Union, and East Asia have sparked more than 20 semiconductor fabs and a dozen gigafactories since 2024. Each fab sends 1.5–2.0 times its ultrapure-water intake back as high-fluoride concentrate, obliging on-site pH neutralization and complex ion exchange. Taiwan Semiconductor Manufacturing Company’s Arizona plant alone treats 10 million gpd of hydrofluoric-acid rinse water using ion exchange and chemical precipitation before municipal discharge. Europe’s Battery Alliance projects 550 GWh of cell capacity by 2030, overwhelming existing solvent-incineration assets and triggering greenfield thermal-oxidizer builds. Emerging biomanufacturing clusters in Singapore and Ireland process wastewater with chemical oxygen demand above 50,000 mg/L, creating premium service opportunities for multi-stage anaerobic systems.
Growing Healthcare and Pharmaceutical Wastewater Volumes
Hospital and pharmaceutical effluent carries active compounds that resist standard biological breakdown, forcing advanced oxidation or activated-carbon polishing. India’s generics cluster released 500 million L/day of process water in 2024, with antibiotic residues exceeding safe limits by four orders of magnitude. The World Health Organization now calls for 99% removal of priority antimicrobials prior to discharge, effectively mandating high-dose ozone or UV processes. China obliged zero-liquid discharge for beta-lactam lines, spurring evaporator and crystallizer sales worth USD 2–5 million per 100 m³/day module. U.S. hospital guidance in 2024 added peracetic-acid or UV steps, inflating unit treatment cost by USD 0.10–0.15/m³.
Government Funding for Sewage Treatment Plants and Effluent Treatment Plants
Multibillion-dollar public programs in India, Indonesia, Saudi Arabia, and Egypt underwrite thousands of new municipal and industrial treatment modules. India budgeted INR 350 billion for 5,000 MLD of capacity along the Ganges by 2026. Indonesia’s USD 3.8 billion program will add 150 plants across Java and Sumatra by 2028. Saudi Arabia targets 3 million m³/day of incremental reuse capacity, reducing desalination strain. Egypt secured EUR 500 million to build 12 industrial effluent plants in the Suez Canal zone.
Restraint Impact Analysis*
| Restraints | (~) % Impact on CAGR Forecast | Geographic Relevance | Impact Timeline |
|---|---|---|---|
| High CAPEX and energy intensity of advanced oxidation and membrane trains | -0.5% | Global, acute in regions with high electricity costs (Europe, Japan) | Medium term (2-4 years) |
| Volatile pricing of commodity coagulants and specialty chemicals | -0.3% | Global, with supply-chain stress in North America and Asia-Pacific | Short term (≤2 years) |
| Incineration and deep-well injection permitting bottlenecks (US/EU) | -0.2% | United States and EU, limited impact in Asia-Pacific and Middle East | Long term (≥4 years) |
| Source: Mordor Intelligence | |||
High CAPEX and Energy Intensity of Advanced Oxidation and Membrane Trains
Membrane-bioreactor plants cost USD 8–12 million for 10,000 m³/day versus USD 3–5 million for conventional activated sludge, and power demand doubles to about 1 kWh/m³. European industrial power prices jumped to EUR 0.18/kWh in 2024, adding EUR 200,000–300,000 in annual costs for mid-size reverse-osmosis systems. Advanced oxidation using peroxide and UV consumes 3–5 kWh/m³ and USD 0.50–1.00/kg peroxide, keeping levelized costs 40–60% above biological methods.
Volatile Pricing of Commodity Coagulants and Specialty Chemicals
Aluminum sulfate prices in the United States climbed from USD 180/ton to USD 260/ton during 2024 on energy-driven alumina inflation. Polyacrylamide polymer in Asia-Pacific rose 22% after monomer outages, and ferric chloride jumped 18% amid European steel curtailments. Fixed-price service contracts could not absorb such spikes, trimming operator margins by 150–200 bps.
*Our forecasts treat driver/restraint impacts as directional, not additive. The impact forecasts reflect baseline growth, mix effects, and variable interactions.
Segment Analysis
By Waste Type: Hazardous Streams Drive Specialized Infrastructure
Hazardous liquid waste represented 57.25% of the 2025 volume, and its 5.29% CAGR ensures it remains the centerpiece of the liquid waste management market. Installations at semiconductor fabs and biopharma plants discharge acids, metals, and solvents that require neutralization, stabilization, or deep-well injection, while misclassification risks fines up to USD 70,000/day under RCRA. Non-hazardous streams—municipal sewage and low-strength industrial effluent—expand more slowly because OECD networks are mature, but nutrient-removal rules drive incremental upgrades.
Less regulated disposal options give non-hazardous generators latitude to balance cost and compliance; however, nutrient caps have lifted operating costs by USD 0.20–0.40/m³. In contrast, the liquid waste management industry earns premium margins in hazardous services, where U.S. incineration utilization already exceeds 85% and disposal fees surpass USD 500/ton. These economics are spurring private equity to fund new capacity, albeit against complex permitting headwinds.

By Source: Industrial Effluent Complexity Outpaces Residential Growth
Residential wastewater retained a 43.44% share of the liquid waste management market size in 2025 through entrenched municipal systems, but industrial flows will outpace at 5.18% CAGR as reshoring policies push biochemical-oxygen-demand loads far above municipal design envelopes. Municipalities now enforce pretreatment rigorously, compelling factories to add equalization, pH adjustment, or oil-water separation before sewer discharge.
Industrial clusters in India, China, and the United States source turnkey common-effluent facilities to spread capital cost and expertise, fueling recurring contracts for private operators. Commercial premises—offices, retail, hospitality—track urbanization but experiment with on-site greywater recycling, which adds USD 15–25/ft² in construction cost yet reduces sewer volumes and offsets potable intake fees.
By Service: Disposal and Recycling Gain as Zero-Liquid Discharge Spreads
Transportation and hauling yielded 52.51% of 2025 revenue because specialized tanker fleets remain indispensable, but disposal and recycling will record a 5.27% CAGR as zero-liquid-discharge policies in water-scarce basins spur crystallizer and brine-concentrator investments. U.S. DOT placarding and manifesting rules add USD 50–100 per load, favoring large haulers like Clean Harbors that scored 92% truck utilization in 2024.
Deep-well injection fees range from USD 20–80 per barrel, yet seismic concerns and carbon-capture well competition limit new permits, pushing clients toward solvent recovery and high-temperature oxidation. Circular models that resell recovered acetone or toluene at 60–70% of the virgin price underline the long-run shift from haul-and-dispose to treat-and-reuse.
By Treatment Method: Biological Systems Balance Cost and Performance
Biological approaches commanded 35.85% of installed capacity in 2025, expanding at a 5.38% CAGR as operators favor 30–50% lower operating costs compared with thermal or membrane routes. Aerobic activated-sludge achieves 85–95% BOD removal at 0.4–0.6 kWh/m³, whereas anaerobic digestion offsets energy demand by generating biogas.
Chemical and physical pretreatment remain integral for oils, greases, or heavy metals, yet they create sludge requiring dewatering at USD 50–150/ton. Thermal and electrochemical processes serve niche high-toxicity streams; for example, boron-doped-diamond oxidation destroys refractory organics at 5–15 kWh/m³, a premium viable only for high-value pharmaceutical intermediates.

By End-User Industry: Petrochemical Complexity Drives Premium Services
Metal refining dominated 2025 demand at 33.77% owing to cyanide and chromium loads, but petrochemical and refinery flows will post the fastest 5.82% CAGR as polyethylene and renewable-diesel projects proliferate. Petrochemical wastewater contains BTEX compounds that require multi-stage separation and polishing. Food and beverage, textile, pulp, and other sectors each contribute 5–10% but vary widely in contaminant spectra, pushing technology providers to maintain diversified process portfolios.
High-salinity blowdown from power and desalination plants now seeks zero-liquid-discharge solutions costing USD 10–20/m³, while sugar and dairy plants increasingly deploy anaerobic digesters to monetize biogas. This mix demands flexible service models, reinforcing the competitive advantage of integrated operators that offer physical-chemical-biological hybrids under single contracts.
Geography Analysis
North America generated 43.64% of 2025 revenue and is projected to grow at a 4.76% CAGR through 2031, anchored by Clean Water Act penalties of USD 37,500/day, 240,000 annual water-main breaks, and 20 billion barrels/year of shale-produced water requiring treatment or injection. The 2024 Clean Water State Revolving Fund leveraged USD 7 billion in low-interest loans, prioritizing nutrient removal and energy neutrality. Canada’s CAD 5 billion water program emphasizes underserved rural and Indigenous systems, while Mexico targets 75% municipal treatment coverage by 2030 via 500 new plants.
Asia-Pacific trails in share yet benefits from aggressive industrialization and government mandates for centralized effluent plants. China treated 97.5% of urban wastewater in 2024 but fined violators CNY 3.8 billion, spurring service outsourcing to meet variable industrial loads. India budgeted INR 450 billion for urban sewage through 2026, while Japan and South Korea lowered nutrient limits and funded advanced oxidation retrofits. Industrial parks in Vietnam and Indonesia issue clustered discharge permits, creating turnkey opportunities for international EPCs.
Europe, Middle East and Africa, and South America exhibit divergent drivers. The EU’s revised Urban Wastewater Treatment Directive now covers towns above 1,000 PE and mandates energy-neutral operation, incentivizing biogas cogeneration. Germany allocated EUR 1.2 billion for micropollutant removal, and the UK launched a GBP 500 million nutrient-reduction drive. Gulf Cooperation Council members prioritize reuse; Saudi Arabia targets 70% wastewater recycling by 2030, commissioning ultrafiltration-UV trains, while Dubai added 120 MIGD of membrane-bioreactor capacity for landscaping reuse. Brazil’s sanitation plan mandates 90% sewage collection and 75% treatment by 2033, worth BRL 700 billion in projects, whereas Argentina secured USD 2 billion to add 50 anaerobic-digester plants.

Competitive Landscape
The liquid waste management market remains moderately fragmented. Integrated players exploit vertical control, for instance, 62% of Veolia’s North American hazardous waste was handled in company-owned facilities in 2024, raising gross margin by 400 bps. Transportation-centric firms fight commoditization by optimizing route density; Clean Harbors lifted vacuum-truck utilization to 92% via customer clustering.
Technology differentiation is sharpening. Supercritical-water oxidation, commercialized by 374Water, won a USD 12 million Orange County contract in 2024, destroying PFAS without combustion emissions. Electrochemical oxidation and plasma arc also bypass air permits, attracting niche biomedical and semiconductor clients. Barriers to entry stay high: a U.S. RCRA Part B permit costs up to USD 2 million and 36 months, sheltering incumbents. Patent filings on antifouling membranes and low-energy aeration reached 127 in 2024, with DuPont and Toray leading.
Smaller specialists such as Tradebe, EnviroServe, and Hulsey compete in medical waste, e-waste, and oil-field brine, respectively, leveraging local permits and mobile assets. Private equity targets underserved hazardous niches, betting that permitting gridlock and rising compliance costs will lift disposal spreads.
Liquid Waste Management Industry Leaders
Veolia
CLEAN HARBORS, INC.
WM Intellectual Property Holding LLC
REMONDIS SE & Co. KG
GFL Environmental Inc.
- *Disclaimer: Major Players sorted in no particular order

Recent Industry Developments
- January 2025: Veolia committed EUR 300 million to add 150,000 ton/year of hazardous-waste incineration in France and Germany, with start-up slated for 2027.
- November 2024: Clean Harbors acquired Safety-Kleen’s Canadian industrial services arm for CAD 450 million, adding 18 centers and 200 vacuum trucks.
- September 2024: Republic Services signed a 20-year, USD 180 million DB-O contract with Phoenix for a 30 MGD membrane-bioreactor and UV facility scheduled for 2027.


Global Liquid Waste Management Market Report Scope
Liquid waste management is the procedure and practice to prevent the discharge of pollutants, toxic chemicals, and other hazardous liquid byproducts to water bodies or drainage systems. Liquid waste management is highly important as liquid waste adversely affects humans and animals by contaminating water, soil, or the air. Therefore, proper handling is highly essential to reduce the spread of diseases, the risk of ruining crops, etc.
The liquid waste management market is segmented by waste type, source, service, treatment method, end-user industry, and geography. By waste type, the market is segmented into hazardous liquid waste and non-hazardous liquid waste. By source, the market is segmented into residential, commercial, and industrial. By service, the market is segmented into collection, transportation/hauling, and disposal/recycling. By treatment method, the market is segmented into physical (sedimentation, filtration), chemical (coagulation, neutralisation), biological (aerobic, anaerobic), and others (thermal and incineration, electrochemical). By end-user industry, the market is segmented into food and beverage, leather, textile, paper and pulp, power generation, chemical industry, sugar industry, petrochemical and refinery, metal refining including iron and steel, other end-user industry (automotive, slaughter house, pharma). The report also covers the market size and forecasts for the market in 18 countries across the globe. For each segment, the market sizing and forecasts have been done on the basis of value (USD).
| Hazardous Liquid Waste |
| Non-Hazardous Liquid Waste |
| Residential |
| Commercial |
| Industrial |
| Collection |
| Transportation / Hauling |
| Disposal/ Recyling |
| Physical (Sedimentation, Filtration) |
| Chemical (Coagulation, Neutralisation) |
| Biological (Aerobic, Anaerobic) |
| Others (Thermal and Incineration, electrochemical) |
| Food and Beverage |
| Leather |
| Textile |
| Paper and Pulp |
| Power Generation |
| Chemical Industry |
| Sugar Industry |
| Petrochemical and Refinery |
| Metal Refining including Iron and Steel |
| Other End-user Industry (automotive, Slaughter house, pharma) |
| Asia-Pacific | China |
| India | |
| Japan | |
| South Korea | |
| Rest of Asia-Pacific | |
| North America | United States |
| Canada | |
| Mexico | |
| Europe | Germany |
| United Kingdom | |
| France | |
| Italy | |
| NORDIC Countries | |
| Rest of Europe | |
| South America | Brazil |
| Argentina | |
| Rest of South America | |
| Middle East and Africa | Saudi Arabia |
| United Arab Emirates | |
| Turkey | |
| South Africa | |
| Egypt | |
| Rest of Middle East and Africa |
| By Waste Type | Hazardous Liquid Waste | |
| Non-Hazardous Liquid Waste | ||
| By Source | Residential | |
| Commercial | ||
| Industrial | ||
| By Service | Collection | |
| Transportation / Hauling | ||
| Disposal/ Recyling | ||
| By Treatment Method | Physical (Sedimentation, Filtration) | |
| Chemical (Coagulation, Neutralisation) | ||
| Biological (Aerobic, Anaerobic) | ||
| Others (Thermal and Incineration, electrochemical) | ||
| By End-User Industry | Food and Beverage | |
| Leather | ||
| Textile | ||
| Paper and Pulp | ||
| Power Generation | ||
| Chemical Industry | ||
| Sugar Industry | ||
| Petrochemical and Refinery | ||
| Metal Refining including Iron and Steel | ||
| Other End-user Industry (automotive, Slaughter house, pharma) | ||
| By Geography | Asia-Pacific | China |
| India | ||
| Japan | ||
| South Korea | ||
| Rest of Asia-Pacific | ||
| North America | United States | |
| Canada | ||
| Mexico | ||
| Europe | Germany | |
| United Kingdom | ||
| France | ||
| Italy | ||
| NORDIC Countries | ||
| Rest of Europe | ||
| South America | Brazil | |
| Argentina | ||
| Rest of South America | ||
| Middle East and Africa | Saudi Arabia | |
| United Arab Emirates | ||
| Turkey | ||
| South Africa | ||
| Egypt | ||
| Rest of Middle East and Africa | ||


Key Questions Answered in the Report
How large is the liquid waste management market in 2026?
The market is estimated at USD 93.15 billion in 2026 and is projected to grow at a 4.35% CAGR to USD 115.25 billion by 2031.
Which waste type dominates global volumes?
Hazardous streams held 57.25% of the 2025 volume and will continue leading growth at a 5.29% CAGR through 2031.
What is driving investment in advanced PFAS removal systems?
The U.S. EPA’s 4 ppt PFAS limit, effective 2024, and parallel EU rules require granular-activated-carbon or ion-exchange upgrades, creating USD 20–30 billion of capital demand by 2030.
Which region accounts for the largest revenue share?
North America generated 43.64% of global revenue in 2025, supported by strict Clean Water Act enforcement and shale-produced water volumes.
Page last updated on:


