
Technology, Media and Telecom
5th MayPricing Strategy for Semiconductor Components
3 Min Read
The WAN Optimization Market Report is Segmented by Component (Hardware Appliances, Software/Virtual, and Services), Solution Type (Traditional WAN Optimizers, SD-WAN Integrated, and SASE-Embedded Optimization), Deployment Model (On-Premises, Cloud/Virtual, and Hybrid), Enterprise Size (SMEs and Large Enterprises), End-User Industry (BFSI, Healthcare and Life Sciences, Retail and ECommerce, and More), and Geography.
Market Overview
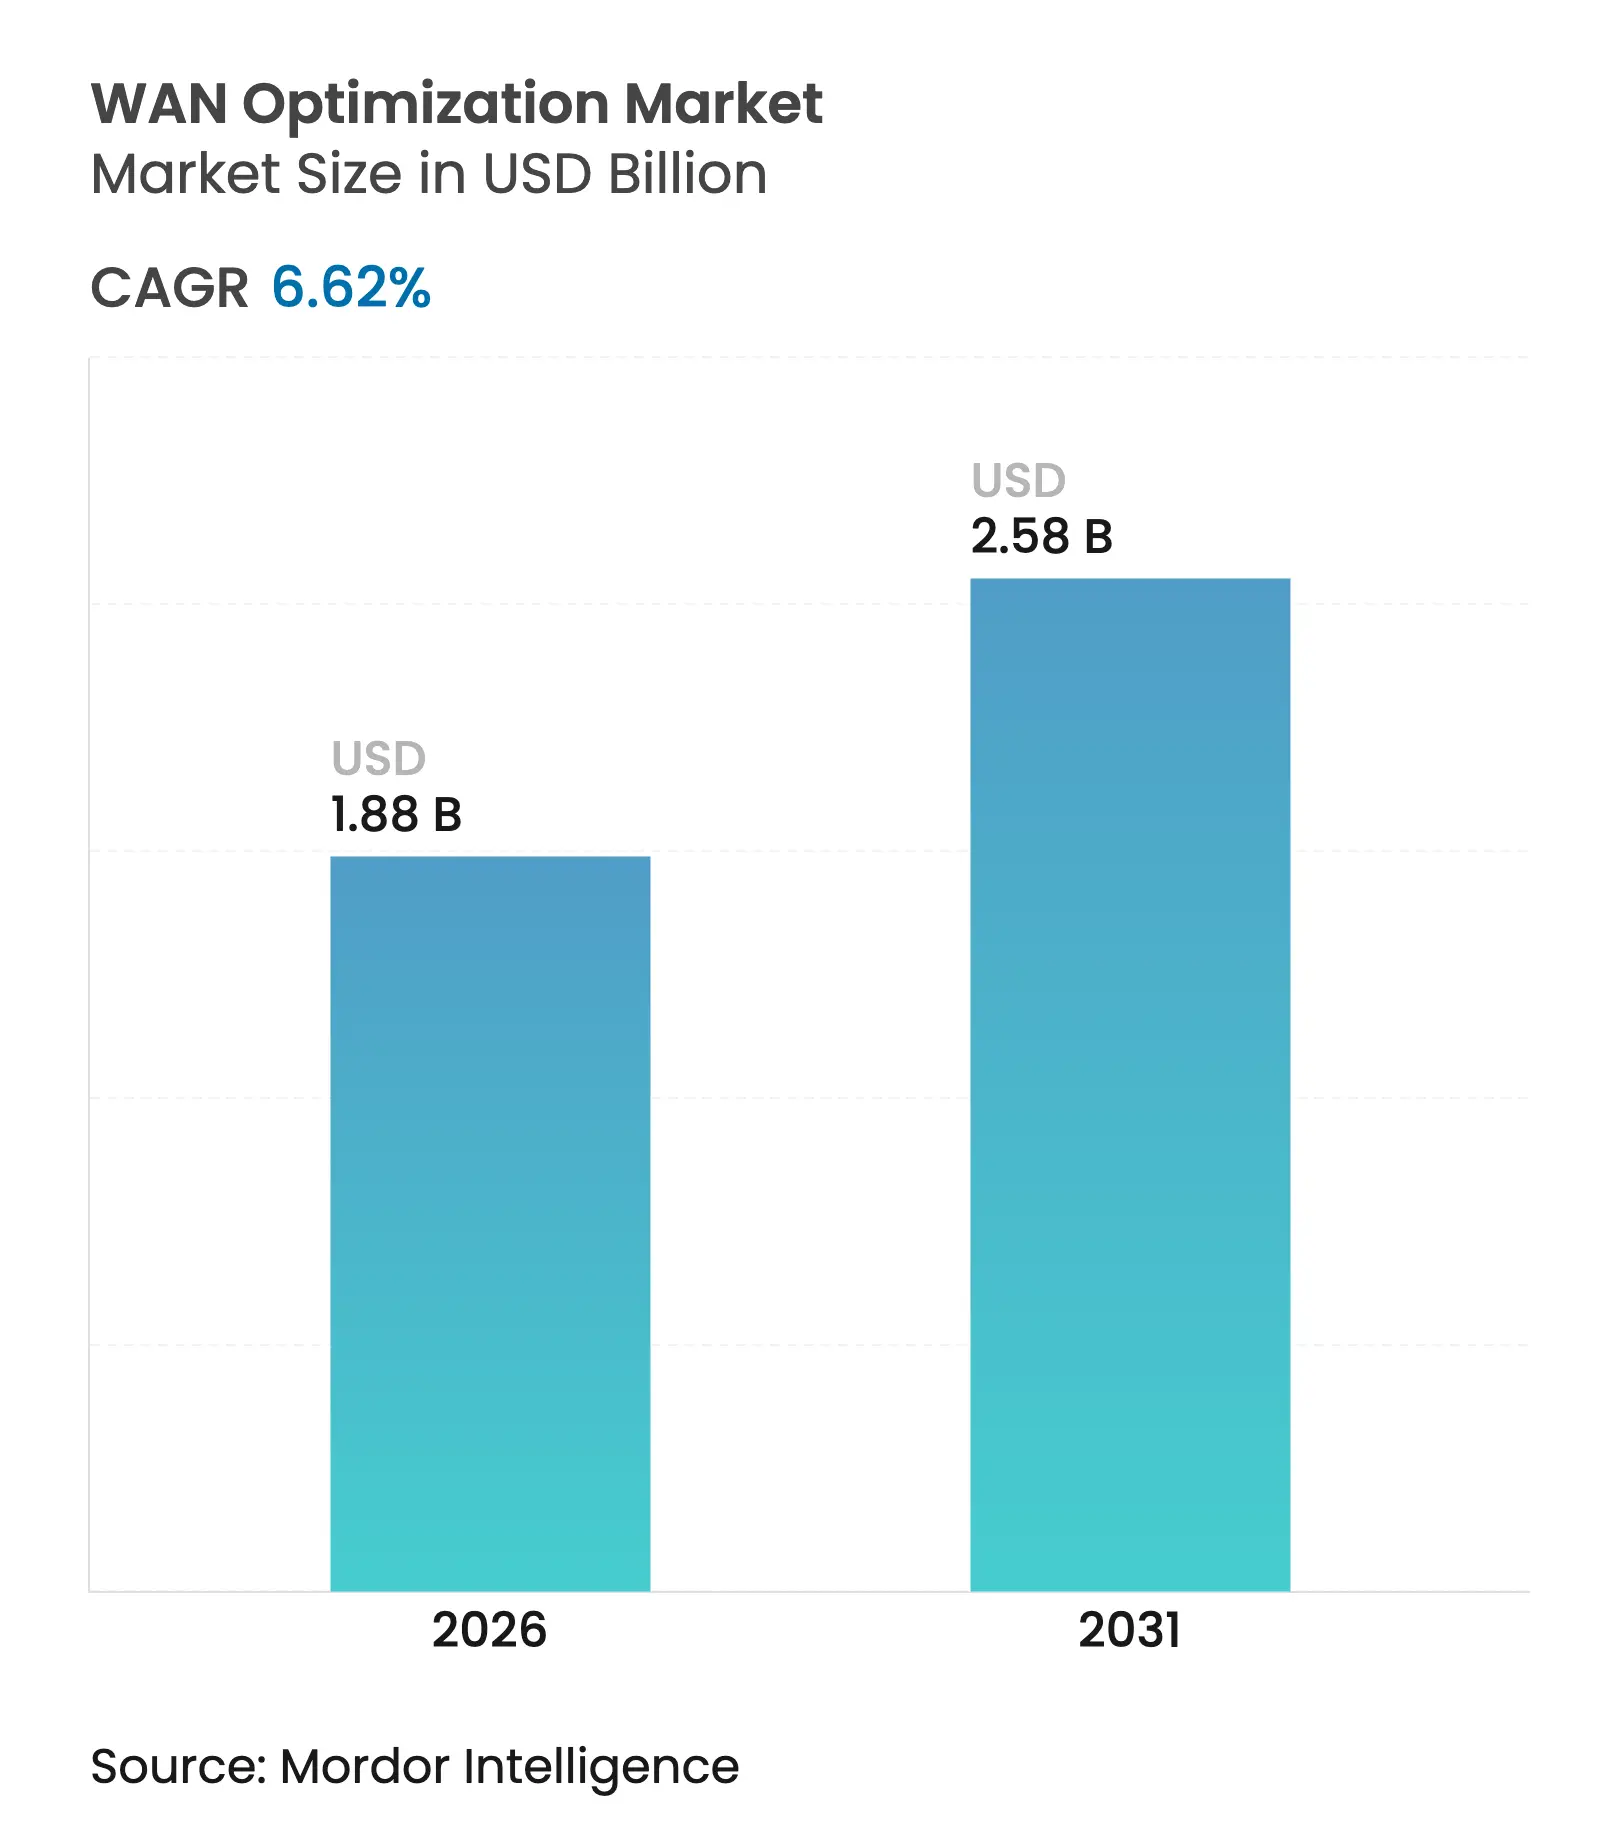
| Study Period | 2020 - 2031 |
|---|---|
| Market Size (2026) | USD 1.88 Billion |
| Market Size (2031) | USD 2.58 Billion |
| Growth Rate (2026 - 2031) | 6.62 % CAGR |
| Fastest Growing Market | Asia Pacific |
| Largest Market | North America |
| Market Concentration | Medium |
Major Players *Disclaimer: Major Players sorted in no particular order. Image © Mordor Intelligence. Reuse requires attribution under CC BY 4.0. |
Continued adoption of generative-AI workloads is reshaping enterprise traffic patterns, creating upload-heavy, latency-sensitive flows that legacy architectures cannot accommodate. Semiconductor supply-chain normalization in early 2025 supports renewed hardware roll-outs, while lingering geopolitical tension still influences component pricing. Enterprises favor dedicated appliances for deterministic performance, yet service-based optimization grows fastest as organizations outsource complex tuning task. Convergence with SD-WAN and SASE platforms signals the market’s shift toward unified networking-security frameworks, particularly for workloads that span edge, cloud, and satellite domains.
Key Report Takeaways
Note: Market size and forecast figures in this report are generated using Mordor Intelligence's proprietary estimation framework, updated with the latest available data and insights as of 2026.
Drivers Impact Analysis
| Driver | ( ~ ) % Impact on CAGR Forecast | Geographic Relevance | Impact Timeline | |||
|---|---|---|---|---|---|---|
Surge in cloud-centric application traffic Surge in cloud-centric application traffic | 1.80% | Global (APAC, North America) | Medium term (2-4 years) | ( ~ ) % Impact on CAGR Forecast:1.80% | Geographic Relevance:Global (APAC, North America) | Impact Timeline:Medium term (2-4 years) |
Generative-AI workloads are exploding edge bandwidth Generative-AI workloads are exploding edge bandwidth | 2.10% | North America, EU, China, Japan | Medium term (2-4 years) | |||
Industry 4.0 edge compute backhaul requirements Industry 4.0 edge compute backhaul requirements | 0.90% | Manufacturing regions: Germany, China, Japan, the US | Long term (≥ 4 years) | |||
LEO-satellite links needing optimization overlays LEO-satellite links needing optimization overlays | 0.50% | Remote regions globally, the Arctic, maritime | Long term (≥ 4 years) | |||
| Source: Mordor Intelligence | ||||||
Surge in Cloud-Centric Application Traffic Drives Optimization Demand
Accelerated migration to multi-cloud environments forces enterprises to manage unpredictable east-west traffic and direct-to-cloud routes. Cisco booked USD 350 million in AI infrastructure orders during Q2 2025, underscoring urgent demand for dynamically optimized connectivity. Hitachi and NTT Communications synchronized data across 600 km with sub-20 ms latency, illustrating how real-time replication relies on high-performance WAN overlays[1]Hitachi Ltd., “600 km Real-Time Data Sync Achieved via APN,” hitachi.com. Edge-cloud convergence amplifies the need for traffic steering that legacy hub-and-spoke designs cannot deliver. As organizations modernize disaster-recovery and analytics pipelines, optimization overlays become indispensable for cost-efficient bandwidth utilization. Consequently, the WAN optimization market continues to benefit from cloud traffic growth.
Generative-AI Workloads Exploding Edge Bandwidth Requirements
Large language models produce bursty, upload-heavy flows averaging 7,593 bytes per prompt, which strain static QoS schemes. Samsung’s patent for AI-aware traffic handling in 5G/6G networks confirms that conventional scheduling algorithms are insufficient. Broadcom’s VeloRAIN applies AI-driven detection to re-prioritize traffic in real time, ensuring generative-AI packets receive appropriate bandwidth without degrading legacy application performance. Meta’s low-latency path-failover patents show broader industry investment in AI-optimized routing. These innovations push the WAN optimization market toward adaptive, intelligence-first architectures.
Industry 4.0 Edge Compute Back-Haul Requirements Intensify
Eaton gained 10-15% OEE improvements by pairing PTC Factory Insights with optimized industrial WANs, cutting unplanned maintenance by 12%. Private-5G plants now deliver 480 Mbps with 10-14 ms latency, yet still require WAN acceleration for analytics backhaul. Foxconn’s rollout of 2,500 VDI instances across six factories underscores scale demands on link-optimization stacks. Lanner’s rugged SD-WAN gateways aggregate 4G/5G, satellite, and MPLS to maintain uptime on factory floors. Consequently, manufacturing digitalization keeps fueling the WAN optimization market.
LEO-Satellite Links Requiring Optimization Overlays
Skylo’s SatPlus eSIM blends cellular and satellite paths, letting policies redirect traffic based on latency or cost. Druid Software and Skylo extend Non-Terrestrial Network (NTN) services to Industry 4.0 sites, providing redundancy for critical telemetry. Hybrid satellite-terrestrial architectures need compression, caching, and forward-error correction to offset link delay, reinforcing demand for WAN optimization market offerings. Meta’s 50,000 km Project Waterworth cable adds further diversity for global traffic engineering. As enterprises blend LEO links with undersea paths, optimization overlays ensure a consistent user experience.
Restraints Impact Analysis
| Restraint | ( ~ ) % Impact on CAGR Forecast | Geographic Relevance | Impact Timeline | |||
|---|---|---|---|---|---|---|
High CAPEX & lifecycle maintenance cost High CAPEX & lifecycle maintenance cost | -1.40% | Global, especially SMEs | Short term (≤ 2 years) | ( ~ ) % Impact on CAGR Forecast:-1.40% | Geographic Relevance:Global, especially SMEs | Impact Timeline:Short term (≤ 2 years) |
Convergence into SASE diluting the stand-alone demand Convergence into SASE diluting the stand-alone demand | -1.10% | Global enterprises | Medium term (2-4 years) | |||
| Source: Mordor Intelligence | ||||||
High CAPEX and Lifecycle Maintenance Costs Constrain Adoption
Component shortages linked to AI server demand raised hardware prices, elevating the total cost of ownership for dedicated appliances. Broadcom’s post-acquisition pricing shifts for VMware reportedly exceeded 400% in some bundles, forcing buyers to reassess on-premises spend. Subscription licenses mitigate upfront cost but can raise multi-year OPEX, challenging SME budgets. Hardware redesigns to meet EU standby-power caps (< 0.5 W) add further cost pressure[3]Nemko AS, “EU Regulation 2023/826 Standby Power Limits,” nemko.com. Collectively, these factors moderate near-term growth in the WAN optimization market.
Convergence into SASE Diluting Stand-Alone Demand
Aryaka’s “Unified SASE as a Service” bundles CASB and optimization, reflecting buyer preference for single-vendor stacks. GigaOm scores SASE adoption at 4.6/5, signaling mainstream shift to converged architectures. Cloud-native SASE lets hyperscalers embed acceleration at POPs, reducing the need for customer-premises devices. As optimization becomes a checklist feature inside larger security contracts, stand-alone vendors face margin pressure. The WAN optimization market, therefore, tilts toward integrated delivery models even as total addressable demand grows.
By Component: Services Accelerate Despite Hardware Dominance
Hardware appliances maintained 50.60% revenue in 2025, reflecting enterprises’ desire for deterministic throughput and packet inspection at wire-speed, with 10 Gbps benchmarks recorded on VMware edge devices. Hardware’s share translates to 50.60% of the WAN optimization market size for that year. At the same time, service-based offerings are posting a 16.10% CAGR through 2031 as organizations outsource configuration and policy tuning to specialist providers. Energy-efficient designs, such as Cisco’s Catalyst switches carrying ENERGY STAR labeling, help hardware retain relevance by lowering operational costs.
Managed and professional services capitalize on rising algorithmic complexity that demands constant policy adaptation. Vendors bundle monitoring, AI-assisted anomaly detection, and lifecycle support, reducing enterprises’ skills burden. Consequently, services reinforce recurring revenue streams and diversify the WAN optimization market beyond product sales.
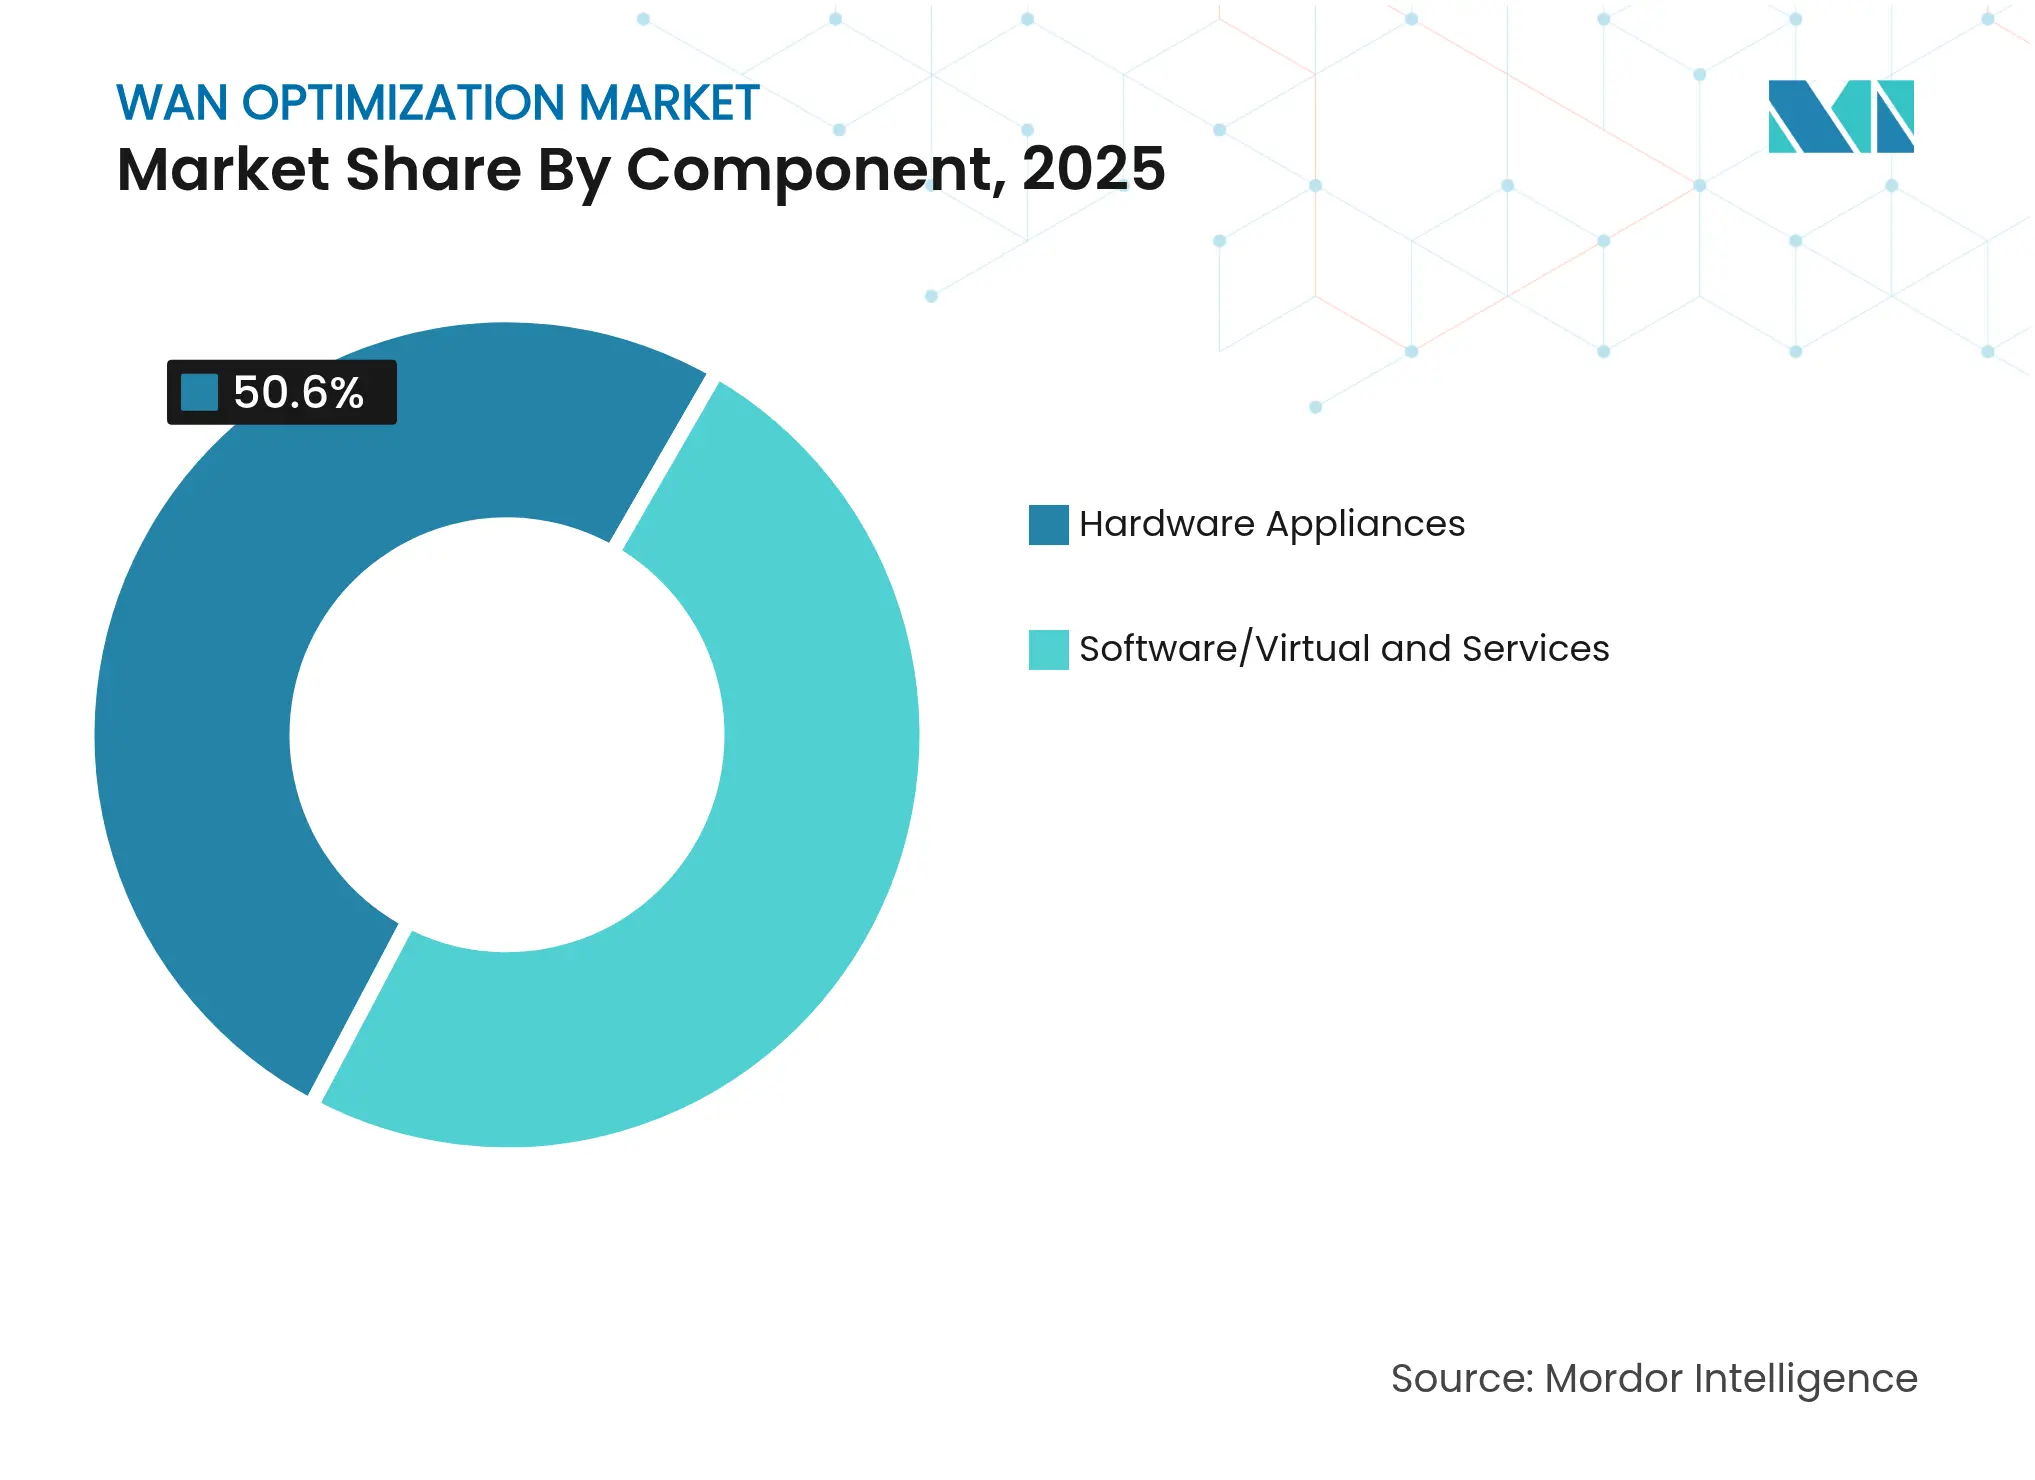
Note: Segment shares of all individual segments available upon report purchase
By Solution Type: SASE Integration Accelerates Market Evolution
SD-WAN–integrated products captured 62.10% revenue in 2025, thanks to widespread refresh cycles that replaced MPLS and router stacks with software-defined fabrics. SASE-embedded optimization, although smaller today, is advancing at a 23.20% CAGR, riding enterprise appetite for unified threat prevention and performance management. Broadcom’s VeloRAIN shows how AI-native detection links optimization with zero-trust segmentation, broadening addressable use cases.
Demand acceleration reflects the prediction that 85% of enterprise workloads will operate in the cloud by 2025, compelling firms to centralize control over identity, security, and traffic engineering in one policy engine. As a result, the WAN optimization market is converging toward platform-based consumption models that fold acceleration into holistic service edge frameworks.
By Deployment Model: Cloud Transformation Drives Hybrid Adoption
On-premises deployments still account for 56.90% of revenue because regulated industries require full control over packet paths and data residency. That slice equates to 56.90% of the WAN optimization market size in 2025. Cloud and virtual form factors, however, record a 20.90% CAGR as enterprises pursue elastic scaling, pay-as-you-use pricing, and zero-touch upgrades. Hybrid topologies combine the two, preserving local processing for sensitive flows while redirecting generic traffic through cloud POPs.
A10 Networks’ 9% revenue rise in Q1 2025 reflects the uptake of appliance-agnostic software that can run on bare metal, virtual machines, or public-cloud instances. Extreme Networks’ Platform One brings AI-assisted troubleshooting across any deployment, illustrating how tools span physical and virtual estates to unify policy management. These launches validate hybrid as the dominant model for the WAN optimization market.

Recognized by Experts. Trusted by Leaders.
A trusted intelligence partner to global decision-makers across 90+ countries.


By Enterprise Size: SME Adoption Accelerates Through Cloud Models
Large enterprises held 64.20% revenue in 2025, leveraging multitenant controllers to orchestrate thousands of sites. SMEs, though smaller in spend, are on a 18.30% CAGR trajectory as cloud-native delivery removes traditional up-front appliance cost. Airtel Business cut a major bank’s network expenditure by 40% after shifting to managed SD-WAN, showcasing ROI that resonates with mid-market buyers.
SMEs frequently choose subscription bundles that merge connectivity, security, and optimization in one portal, minimizing in-house expertise requirements. This democratization broadens the WAN optimization industry’s customer base and stabilizes long-term growth.
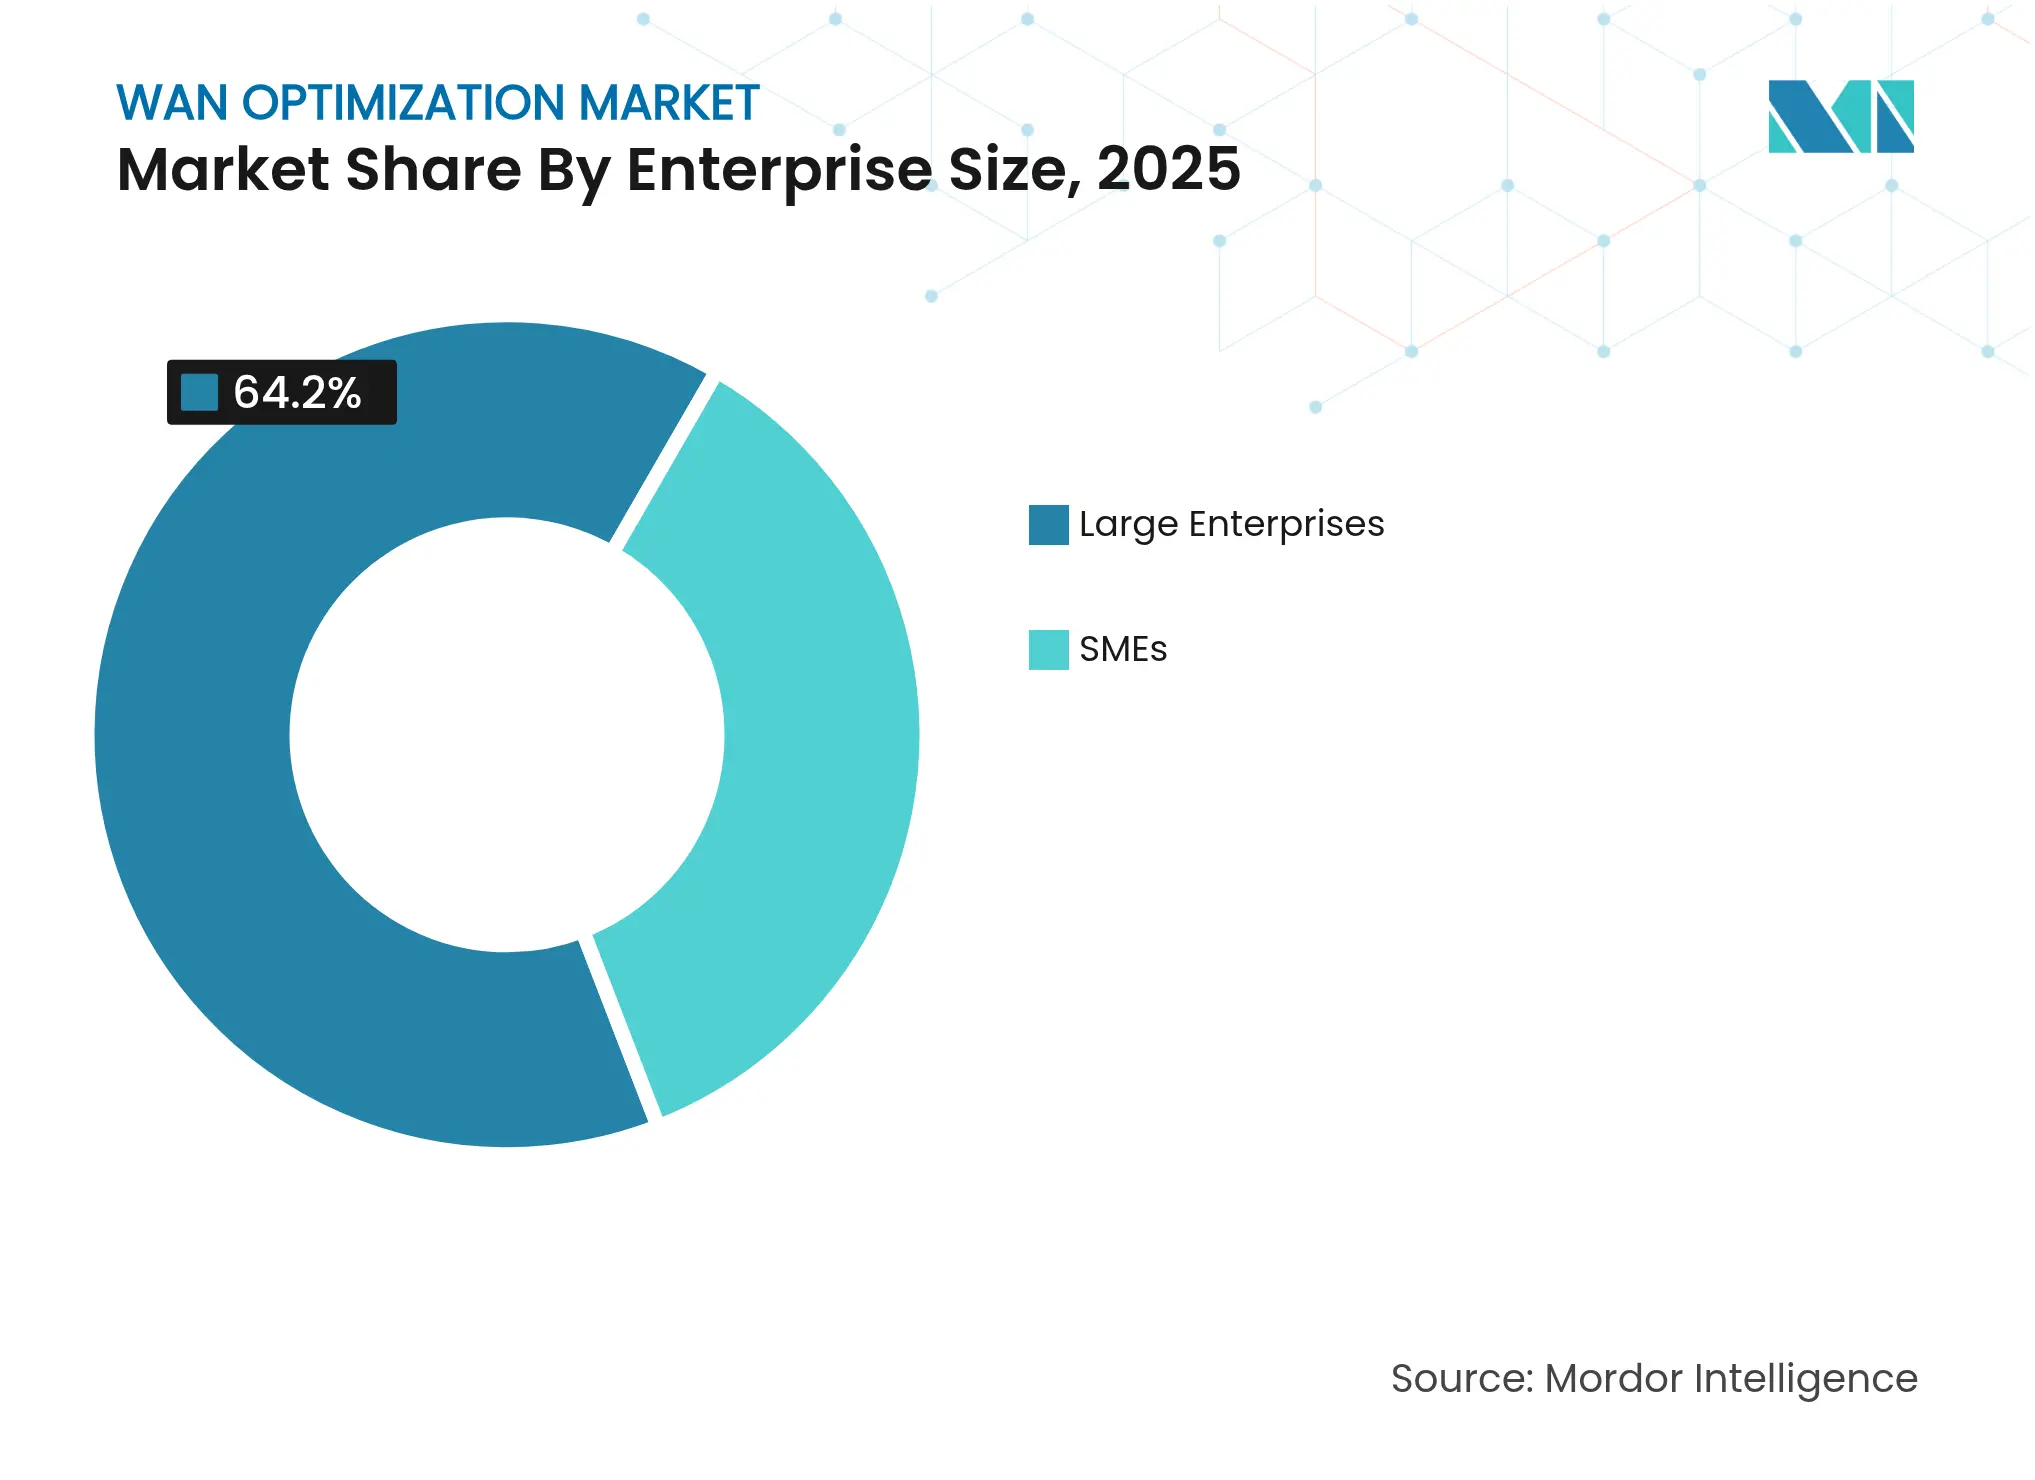
Note: Segment shares of all individual segments available upon report purchase
By End-User Industry: Healthcare Leads Growth Amid BFSI Dominance
BFSI kept a 23.60% revenue share in 2025 thanks to low-latency trading and stringent compliance that mandates deterministic packet delivery. Healthcare, however, posts the fastest 17.00% CAGR through 2031 as telemedicine and IoT diagnostics multiply bandwidth demand. Hospital systems such as Novant Health rely on fabric-based core networks to support more than 1 Gbps links for EMR and imaging workloads.
Regulatory push for data sovereignty and cybersecurity further compels hospitals to deploy optimization plus encryption in tandem. Manufacturing, IT-telecom, and energy also extend adoption as Industry 4.0 and remote asset monitoring scale. Together, these verticals diversify end-market exposure for the WAN optimization market.
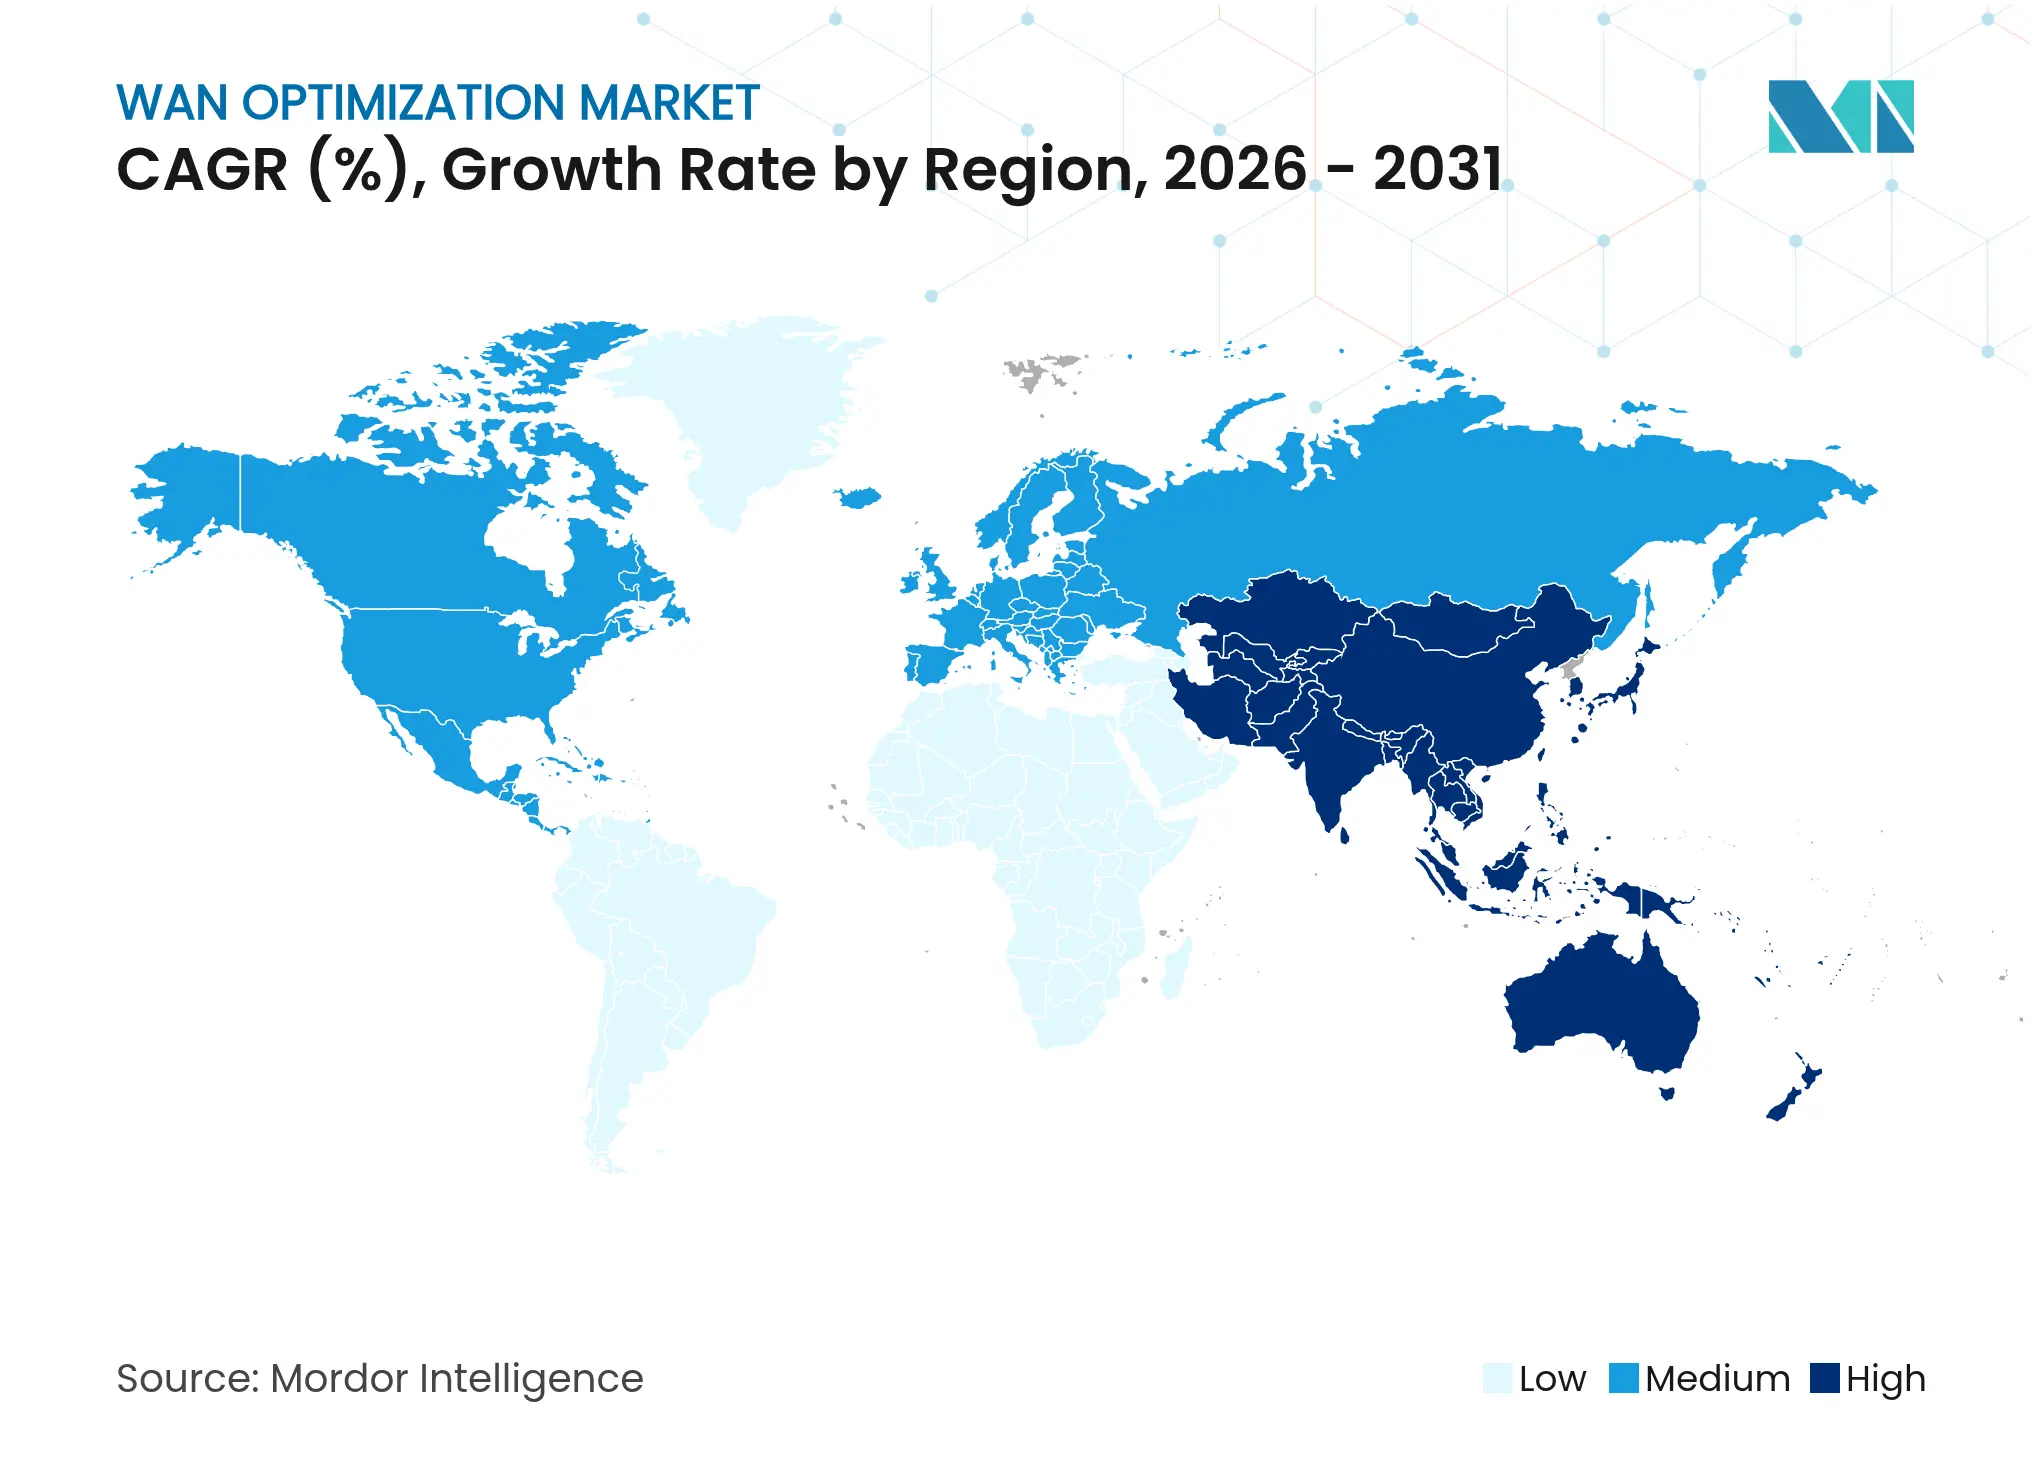
North America captured 32.40% of the WAN optimization market share in 2025, underpinned by robust enterprise IT budgets and secure-connectivity mandates. Federal sustainable-procurement rules spur demand for low-power hardware, while AI innovation grants intensify network upgrades. Cisco’s USD 13.99 billion Q2 2025 revenue underscores continuing infrastructure investment, much of it earmarked for AI-ready Ethernet fabrics. Regional buyers emphasize zero-trust and observability, steering vendors toward SASE convergence.
Asia Pacific is the fastest-growing geography at 6.78% CAGR. Japan alone expects telecommunications equipment spend to reach 4.362 trillion yen (USD 29.1 billion) by 2026, reflecting aggressive 5G/6G and data center builds. Sovereign-cloud mandates across India, Indonesia, and Australia necessitate localized acceleration nodes to comply with data-residency laws. Vendors like Huawei and Palo Alto Networks expand local POPs, improving service latency and fueling regional WAN optimization market momentum.
Europe maintains a substantial slice of the WAN optimization market size due to strict energy directives. EU Regulation 2023/826 caps standby power at 0.5 W, compelling vendors to incorporate advanced power management. The proposed Digital Networks Act seeks to harden connectivity resilience, indirectly encouraging greater traffic-optimization investment. Meanwhile, subsea-cable security initiatives increase demand for encryption and optimization overlays to secure transboundary flows. Emerging regions such as Latin America and Africa register modest growth as infrastructure funding accelerates, opening long-run potential for cloud-managed optimization services.
Market Concentration
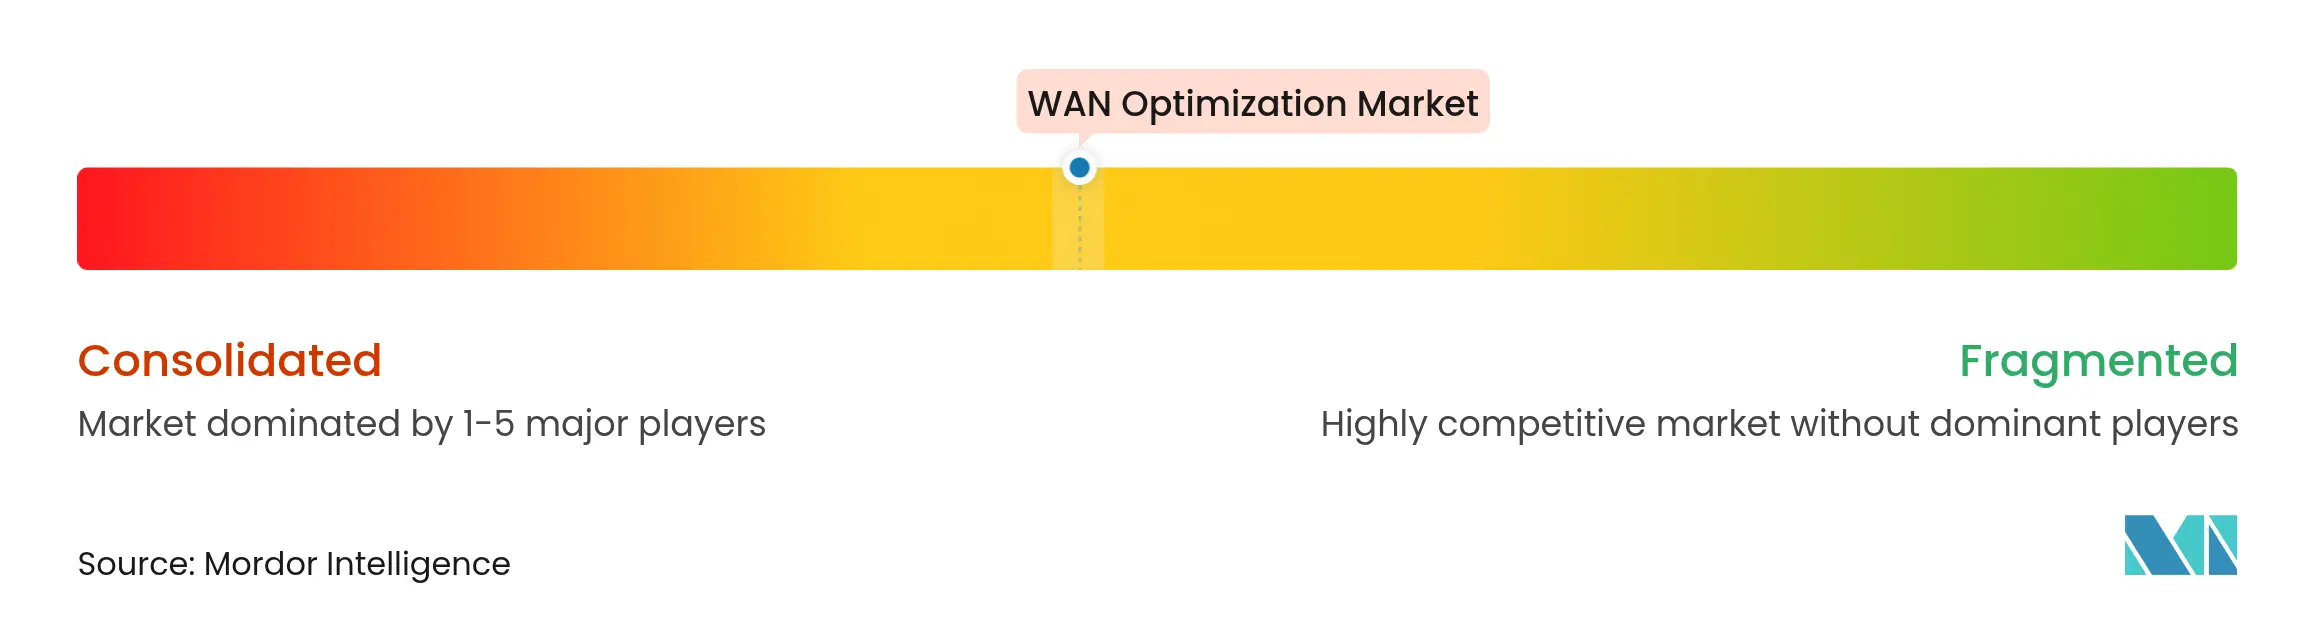
The WAN optimization market shows moderate concentration with traditional networking majors, niche accelerators, and SASE specialists vying for share. Cisco’s USD 28 billion Splunk acquisition folds observability with networking, granting deeper packet-to-app analytics and raising entry barriers for smaller rivals. HPE’s pending USD 14 billion Juniper purchase, still under regulatory review, could compress the standalone vendor pool and bundle optimization inside AI-cloud offerings.
Strategic activity centers on AI-aware traffic handling, energy efficiency, and vertical integration. Cisco’s joint work with NVIDIA on Spectrum-X ASICs targets Ethernet-based AI fabrics, while Broadcom’s VeloRAIN introduces static-to-adaptive rule conversion at the edge. White-space innovation persists in satellite-link optimization and healthcare-specific policies. Nonetheless, vendors lacking security or AI toolsets face acquisition or niche retreat as buyers prefer consolidated stacks. Channel alliances with global ISPs, cloud providers, and systems integrators serve as critical scale multipliers in the competitive race.

*Disclaimer: Major Players sorted in no particular order
1. INTRODUCTION
2. RESEARCH METHODOLOGY
3. EXECUTIVE SUMMARY
4. MARKET LANDSCAPE
5. MARKET SIZE AND GROWTH FORECASTS (VALUE)
6. COMPETITIVE LANDSCAPE
7. MARKET OPPORTUNITIES AND FUTURE OUTLOOK
Market Definitions and Key Coverage
Segmentation Overview
Detailed Research Methodology and Data Validation
Primary Research
Desk Research
Market-Sizing & Forecasting
Data Validation & Update Cycle
Why Mordor's WAN Optimization Baseline Commands Reliability
Benchmark comparison
| Market Size | Anonymized source | Primary gap driver | ||
|---|---|---|---|---|
USD 1.76 B (2025) | Mordor Intelligence | Anonymized source:Mordor Intelligence | Primary gap driver: | |
USD 1.40 B (2025) | Global Consultancy A | Excludes cloud-delivered acceleration modules and uses static ASPs | ||
USD 3.94 B (2025) | Regional Consultancy B | Applies shipment uplift without stripping multi-year support bundles | ||
USD 4.68 B (2025) | Industry Journal C | Counts broader network-optimization services and relies on older FX rates |
Pricing Strategy for Semiconductor Components
3 Min Read
Accelerating Additive Manufacturing Adoption in India
3 Min Read
When decisions matter, industry leaders turn to our analysts. Let’s talk.