Volatile Organic Compound Gas Sensor Market Size and Share
Market Overview
| Study Period | 2020 - 2031 |
|---|---|
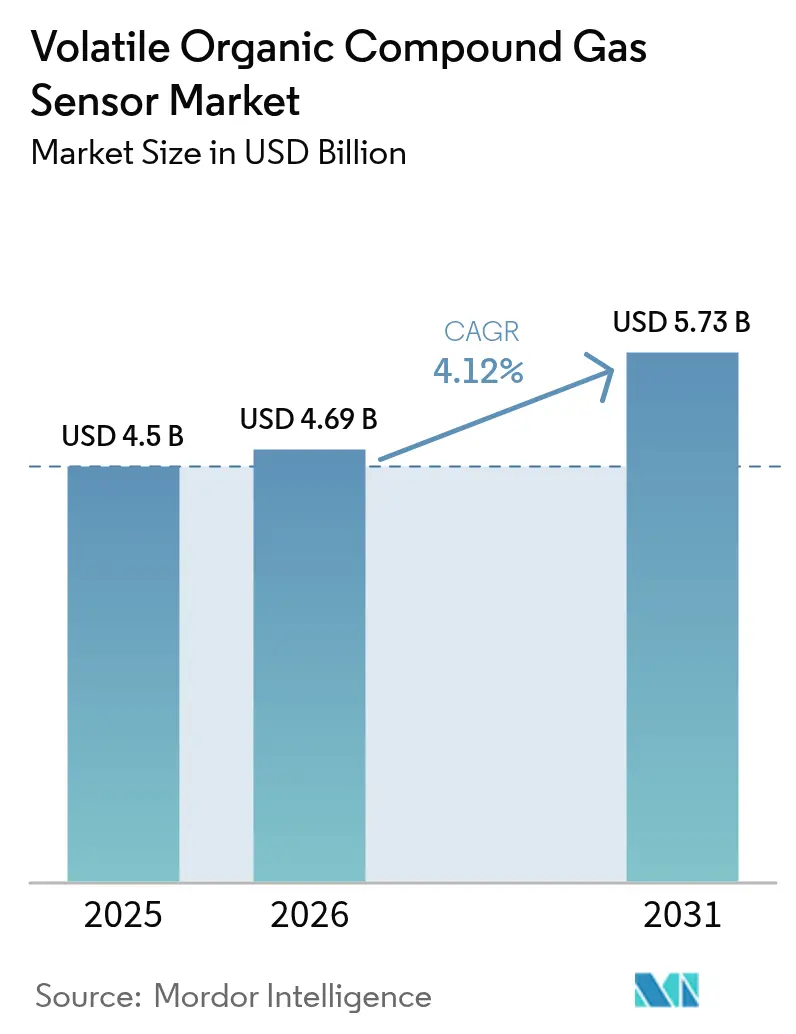
| Market Size (2026) | USD 4.69 Billion |
| Market Size (2031) | USD 5.73 Billion |
| Growth Rate (2026 - 2031) | 4.12% CAGR |
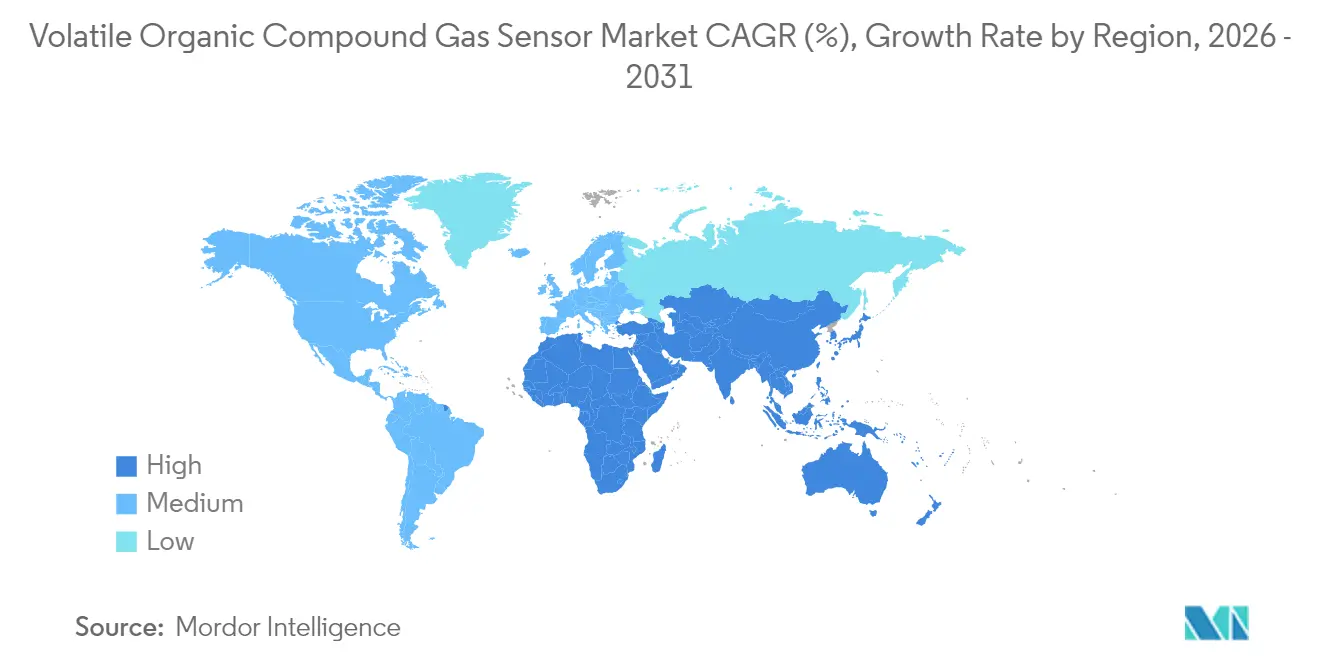
| Fastest Growing Market | Middle East and Africa |
| Largest Market | Asia Pacific |
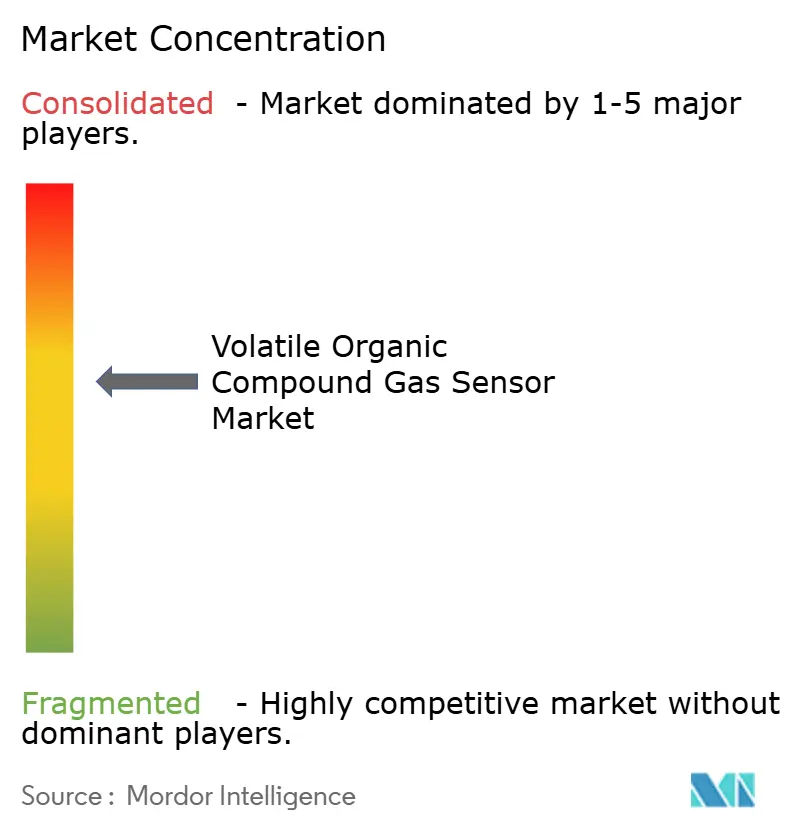
| Market Concentration | Medium |
Major Players *Disclaimer: Major Players sorted in no particular order Image © Mordor Intelligence. Reuse requires attribution under CC BY 4.0. | |
Volatile Organic Compound Gas Sensor Market Analysis by Mordor Intelligence
The VOC sensors market size is expected to grow from USD 4.5 billion in 2025 to USD 4.69 billion in 2026 and is forecast to reach USD 5.73 billion by 2031 at 4.12% CAGR over 2026-2031. Demand strengthens as indoor-air-quality codes narrow permissible volatile-organic-compound exposure limits, prompting commercial buildings to install continuous monitors. Smart-home hub vendors bundle VOC detection to distinguish premium offerings, while automotive and battery manufacturers rely on rapid-response sensors to detect solvent leakage on electric-vehicle production lines. Low-power micro-electromechanical-system photoionization detectors allow badge-style wearables for industrial staff, and green-building certifications award points for real-time air-quality reporting. These converging trends anchor growth across the VOC sensors market worldwide.
Key Report Takeaways
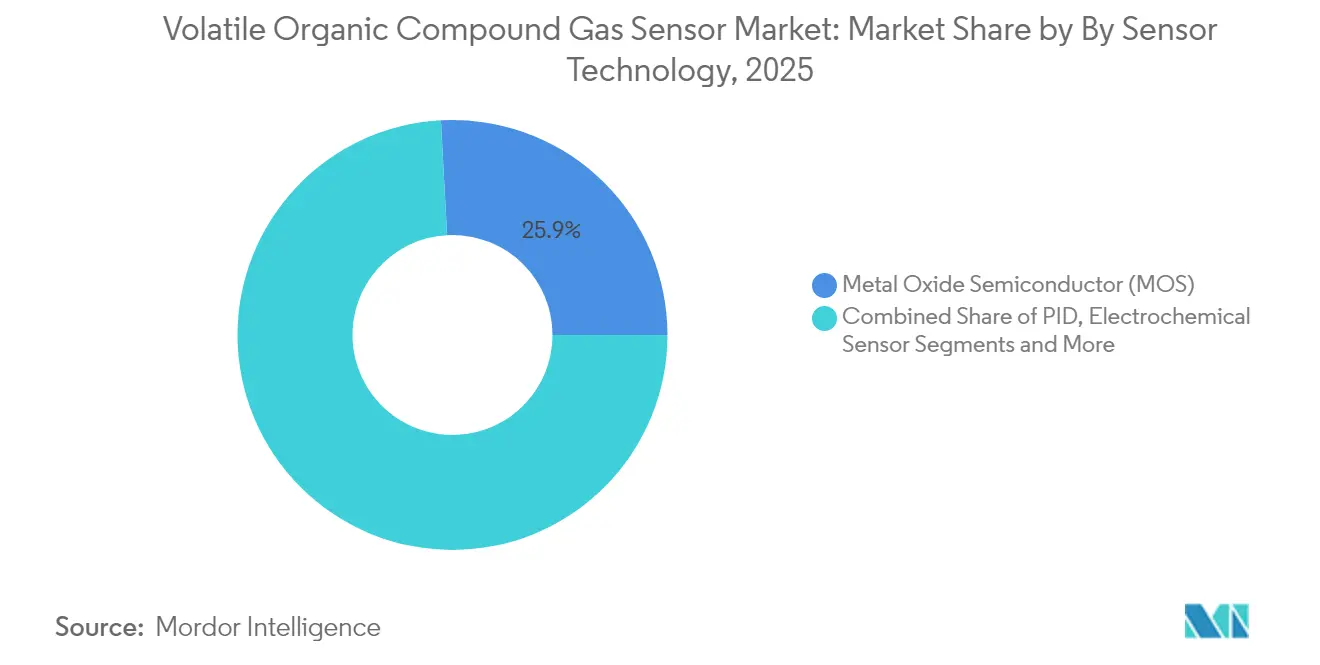
- By sensor technology, metal-oxide-semiconductor devices held a 25.86% revenue share of the VOC sensors market in 2025, whereas photoionization detectors are forecast to grow at a 7.85% CAGR from 2026-2031.
- By device form factor, fixed wall-mounted monitors accounted for 41.12% of VOC sensors market share in 2025; wearable badges are poised to advance at a 9.12% CAGR through 2031.
- By connectivity, wired interfaces such as BACnet and Modbus represented 55.75% of the VOC sensors market size in 2025, while low-power wide-area wireless links are expanding at a 8.70% CAGR to 2031.
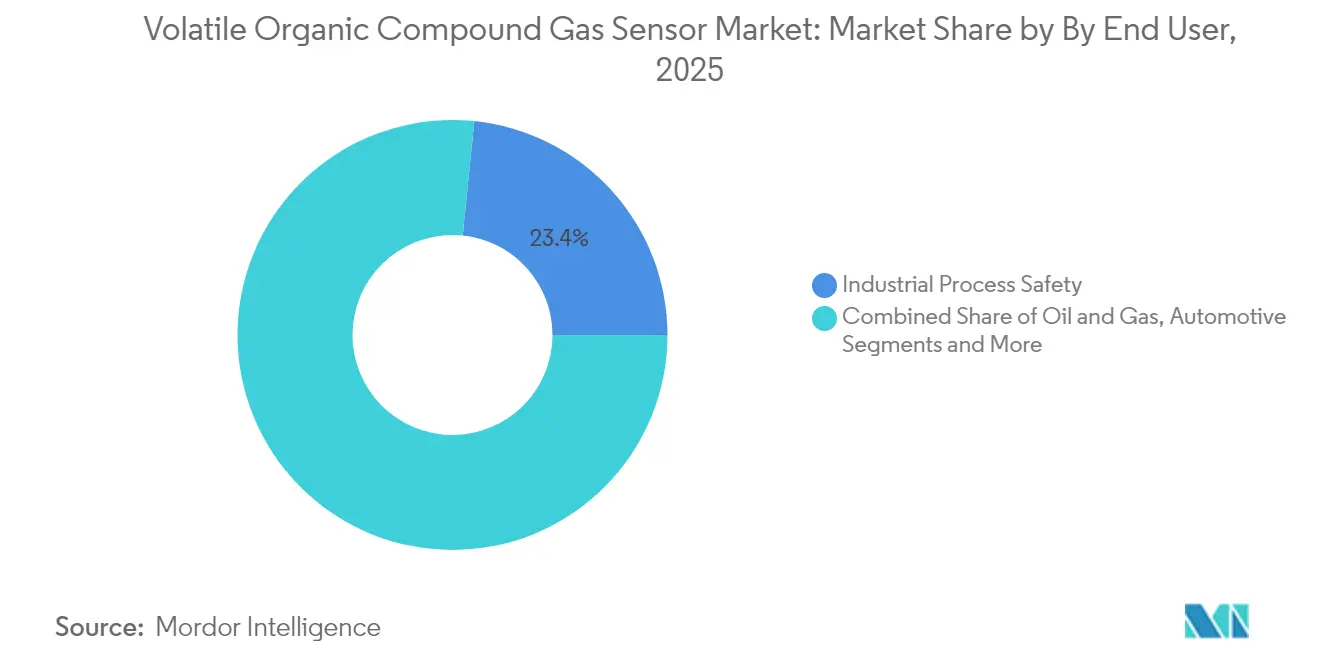
- By end-use industry, industrial process safety comprised 23.38% of the VOC sensors market in 2025; consumer electronics and smart homes are the fastest-growing vertical at an 8.25% CAGR through 2031.
- By geography, Asia-Pacific contributed 31.55% of 2025 revenue; the Middle East and Africa is the fastest-growing region at a projected 8.85% CAGR to 2031.
Note: Market size and forecast figures in this report are generated using Mordor Intelligence’s proprietary estimation framework, updated with the latest available data and insights as of 2026.
Global Volatile Organic Compound Gas Sensor Market Trends and Insights
Drivers Impact Analysis*
| DRIVER | (~) % IMPACT ON CAGR FORECAST | GEOGRAPHIC RELEVANCE | IMPACT TIMELINE |
|---|---|---|---|
| Tightening Indoor Air-Quality Standards across North America & Europe | +1.8 | North America & Europe, with spillover to Asia Pacific | Medium term (~ 3-4 yrs) |
| Integration of VOC Sensors into Smart-Home IoT Platforms | +1.2 | Global, with early adoption in North America & Europe | Medium term (~ 3-4 yrs) |
| Demand from EV Battery Manufacturing Lines in Asia for Solvent-Leak Detection | +0.9 | Asia Pacific, primarily China, South Korea & Japan | Short term (≤ 2 yrs) |
| Adoption of Low-Power MEMS-PID Sensors Enabling Wearable VOC Badges | +1.5 | Global, with strongest uptake in industrial economies | Medium term (~ 3-4 yrs) |
| Green-Building Certification Schemes Mandating Continuous VOC Monitoring | +1.1 | North America & Europe, with emerging impact in Asia Pacific | Long term (≥ 5 yrs) |
| Source: Mordor Intelligence | |||
Stricter Indoor-Air-Quality Standards across North America & Europe
Building owners must demonstrate continuous compliance with tightened exposure limits for formaldehyde, benzene and other VOCs. Bulk procurement of fixed wall-mounted detectors and BACnet gateways supports rapid retrofits in hospitals, schools and transit hubs. Demand concentrates on projects governed by ASHRAE-62.1 and EN-16798 guidelines, anchoring short-term momentum for the VOC sensors market.
Integration of VOC Sensors into Smart-Home IoT Platforms
Voice-assistant hubs and connected thermostats position VOC sensing as a wellness feature. MOS chips drawing less than 20 mW integrate over I²C or BLE, while Matter 1.2 interoperability enables vendor-agnostic pairing. High shipment volumes widen the addressable base and lower unit prices, sustaining medium-term growth for the VOC sensors market.[1]Connectivity Standards Alliance, “Matter 1.2 Specification,” csa-iot.org
Demand from EV Battery Manufacturing Lines in Asia
Gigafactories that coat electrodes with N-methyl-2-pyrrolidone require line-side VOC readings below 5 ppm. Photoionization detector arrays respond within two seconds and integrate with programmable-logic-controller safety loops, underpinning volume expansion across the VOC sensors market in Asia.
Adoption of Low-Power MEMS-PID Sensors Enabling Wearable Badges
MEMS miniaturisation of ultraviolet lamps has slashed power budgets by 70%, enabling coin-cell badges that log personal exposure for eight-hour shifts. Chemical plants now issue the badges to contractors in confined-space entry zones, widening the long-term addressable base for the VOC sensors market.
Restraints Impact Analysis*
| RESTRAINTS | (~) % IMPACT ON CAGR FORECAST | GEOGRAPHIC RELEVANCE | IMPACT TIMELINE |
|---|---|---|---|
| Calibration Drift of PID Sensors in High-Humidity Climates | ~-0.8 | Southeast Asia, Middle East, tropical regions globally | Short term (≤ 2 yrs) |
| Lack of Harmonised Interoperability Protocols among Sensor Brands | ~-1.2 | Global, with highest impact in commercial building sector | Medium term (~ 3-4 yrs) |
| Price Sensitivity in Mass-Market Smart-Home Segment | ~-0.7 | Global consumer markets, particularly price-sensitive regions | Medium term (~ 3-4 yrs) |
| Supply-Chain Volatility for Semiconductor Sensor Materials | ~-0.5 | Global, with concentrated impact on Asian manufacturing | Short term (≤ 2 yrs) |
| Source: Mordor Intelligence | |||
Calibration Drift of PID Sensors in High-Humidity Climates
PID output can drop 15% in environments above 85% relative humidity as water molecules quench photoionisation. Users incur added costs for compensation algorithms and frequent recalibration, tempering near-term uptake in food-processing plants and pulp mills across Southeast Asia and parts of South America.[2]Singapore National Environment Agency, “Guidelines on Indoor Air Quality,” nea.gov.sg
Lack of Harmonised Interoperability Protocols among Sensor Brands
Although Zigbee, Thread and LoRaWAN exist, payload encoding for VOC indices is not uniform. Integrators must write custom middleware, slowing multi-vendor deployments and moderating the medium-term rollout of large-scale networks within the VOC sensors market.
*Our forecasts treat driver/restraint impacts as directional, not additive. The impact forecasts reflect baseline growth, mix effects, and variable interactions.
Segment Analysis
By Sensor Technology: MOS Leads While PID Accelerates
MOS devices generated 25.86% of revenue in 2025, holding the largest VOC sensors market share because they balance price and performance. Photoionization detectors will post a 7.85% CAGR through 2031, outpacing the overall VOC sensors market. Premium industrial users require sub-3-second response times and wide chemical coverage, driving the VOC sensors market size for PID modules upward. Future MOS roadmaps incorporate multi-pixel arrays for species selectivity, while PID vendors explore graphene windows to reach sub-ppm sensitivity.
Across the MOS segment, falling wafer costs and temperature-modulation algorithms safeguard incumbent share even as niche applications shift to PID or quartz-crystal microbalance designs. Entrants must navigate intellectual-property clusters covering heater-drive patterns, which raise barriers in the VOC sensors market.


By Device Form Factor: Dominance of Fixed Monitors, Momentum for Wearables
Wall-mounted panels captured 41.12% of 2025 revenue and remain core to building-automation retrofits that rely on PoE cabling. Wearable badges post the highest 9.12% CAGR, reflecting regulatory emphasis on personal exposure data in digital logbooks. The VOC sensors market size tied to badges climbs steadily as MEMS-PID designs prove eight-hour battery life.
Portable handheld detectors retain relevance for first responders but cede volume to continuous fixed monitors that support compliance documentation. Multi-parameter IAQ cubes face competition from smart-thermostat OEMs that integrate individual sensors directly onto motherboard daughtercards, yet they still contribute meaningfully to the VOC sensors market.
By Connectivity: Wired Dominates, Low-Power Wide-Area Growing
Deterministic wired links such as BACnet-MS/TP, Modbus-RTU and Ethernet/IP held 55.75% of 2025 revenue. Facility managers reuse existing twisted-pair backbones, ensuring the VOC sensors market share for wired connections remains solid. Low-power wide-area radios—LoRaWAN, NB-IoT and LTE-M—are projected to advance at a 8.70% CAGR. Gateways backhaul encrypted payloads from battery-powered nodes, expanding the VOC sensors market size committed to LPWA architectures.
Wi-Fi and Zigbee are prevalent in smart homes but face congestion in 2.4 GHz bands. Bluetooth Low Energy remains a commissioning tool rather than a telemetry backbone within the VOC sensors market.
By End-use Industry: Process Safety Commands, Smart-Home Surges
Process safety dominated spending with 23.38% of 2025 revenue. Explosion-proof enclosures and SIL-2 certifications elevate unit prices and sustain the VOC sensors market. Consumer electronics and smart-home devices record the fastest 8.25% CAGR, reflecting frequent refresh cycles in connected air purifiers, thermostats and voice assistants.
Healthcare and pharmaceutical plants specify sub-ppm detection thresholds, particularly in aseptic filling suites. Food and beverage producers adopt MOS sensors to monitor ethylene levels, yet price sensitivity limits penetration compared with tightly regulated industries, moderating the VOC sensors market in those facilities.
By Distribution Channel: Direct Sales Prevail, E-commerce Expands
Direct sales dominate explosion-proof and SIL-certified equipment because customers demand turnkey calibration, site-acceptance testing and long-term service contracts. Distributors and value-added resellers support building-automation integrators, whereas e-commerce gains traction for consumer replacement cartridges, reinforcing aftermarket revenue throughout the VOC sensors market.
Geography Analysis
Asia-Pacific contributed 31.55% of 2025 turnover, supported by gigafactory and cathode-active-material capacity expansions in China, Japan and South Korea. PID sensors pair with edge-analytics boxes to meet rapid compliance audits that require real-time dashboards delivered to provincial environmental bureaus. Investments in battery and semiconductor supply chains position Asia-Pacific as the foremost region within the VOC sensors market.
North America benefits from a building-retrofit cycle funded by federal tax credits that subsidize high-efficiency HVAC systems integrating VOC monitoring. Enterprise campuses use LoRaWAN IAQ nodes to track workplace wellness, and Canada’s green-building council awards LEED points for continuous reporting, reinforcing the VOC sensors market.
Europe’s Ecodesign directive pushes manufacturers to disclose VOC performance in use. Fixed monitors maintain acetone vapors below 10 ppm in German automotive paint shops. The Middle East and Africa post the quickest 8.85% CAGR as smart-city pilots in Saudi Arabia and the United Arab Emirates embed IAQ dashboards into municipal command centers, and South African mines trial wearable badges for underground crews, enlarging the regional VOC sensors market.
South America experiences steadier growth. Brazil aligns national exposure limits with ACGIH tables, driving procurement by petrochemical complexes near São Paulo. Mexico’s maquiladora corridor adds low-cost MOS sensors to comply with USMCA environmental clauses, supporting the VOC sensors market across the region.

Competitive Landscape
The VOC sensors market is moderately consolidated. Sensirion, Bosch Sensortec and Renesas supply more than one-third of MOS die volumes to consumer-electronics manufacturers. Ion Science and Riken Keiki dominate stationary PID equipment for industrial safety, leveraging proprietary ultraviolet lamp designs. ABB integrates optical-fiber VOC modules into its distributed control system portfolio, positioning itself for large oil-and-gas projects.
Strategic moves illuminate competitive positioning. In 2024 Sensirion released the SGP42, which employs on-device neural-network inference to distinguish paint fumes from cooking odors. Bosch Sensortec licensed a carbon-nanotube coating that improves sub-ppm selectivity in high-humidity settings. Siemens added MQTT payload templates to its QAM-2030 IAQ sensor, facilitating cloud integration with MindSphere.
Partnerships shape go-to-market channels. Alphasense bundles LoRa end-nodes with Chinese gateway maker Milesight, while Aeroqual and Kaiterra cross-license calibration curves to accelerate development of multiparameter panels. NevadaNano leverages a US Defense Logistics Agency contract to validate its Molecular Property Spectrometer for hazardous-location approvals, widening its reach within the VOC sensors market.
Cost pressure persists in consumer channels. Amphenol Advanced Sensors outsourced MOS die fabrication to a 200 mm CMOS foundry in Taiwan, cutting cost of goods by 18% during 2025. Figaro Engineering counters with five-year warranty terms and field-replaceable filter caps, sustaining competitiveness in the VOC sensors market.
Volatile Organic Compound Gas Sensor Industry Leaders
Sensirion AG
Bosch Sensortec GmbH
Figaro Engineering Inc.
Amphenol Advanced Sensors (incl. Telaire)
Alphasense Ltd.
- *Disclaimer: Major Players sorted in no particular order

Recent Industry Developments
- May 2025: Sensirion launched the SEN6x sensor platform, an all-in-one environmental monitoring solution capable of measuring up to nine parameters including VOCs, particulate matter, temperature, and humidity, targeting smart building applications.
- April 2025: Industrial Scientific introduced the Vector™ AM7 Area Monitor, featuring customizable sensor configurations that can simultaneously monitor up to seven gases, including VOCs, with 22 sensor options and flexible communication capabilities.
- May 2025: Shenzhen ProSense Technology launched the PS-VOC-100 Air Quality Module specifically designed for smart home applications, featuring high sensitivity VOC detection and seamless integration with IoT systems.
- January 2025: Sensitron unveiled advanced PID sensor technology for VOC gas detection, featuring improved humidity resistance and extended calibration stability for industrial applications.


Global Volatile Organic Compound Gas Sensor Market Report Scope
The gas sensor is a variant of a chemical sensor that can measure the concentration of a constituent gas in its vicinity. These sensors adopt different techniques for quantifying the exact amount of gas in a medium. The volatile organic compound gas sensor helps in the detection of organic chemicals with a high vapor pressure at ordinary room temperature. The scope of the global volatile organic compound (VOC) gas sensor market includes insights into the solutions offered by major players providing hardware (either detector or sensor) and detailed geographical analysis.
| Photoionization Detector (PID) |
| Metal Oxide Semiconductor (MOS) |
| Electrochemical Sensor |
| Optical Fiber Sensor |
| Quartz Crystal Microbalance (QCM) |
| Others |
| Fixed/Wall-Mounted Monitors |
| Handheld/Portable Detectors |
| Wearable Badges |
| Integrated Multi-Parameter IAQ Monitors |
| Embedded Sensor Modules |
| Wired (BACnet, Modbus, Ethernet, CAN) | |
| Wireless | Wi-Fi |
| Bluetooth/BLE | |
| Zigbee/Thread | |
| LoRaWAN/NB-IoT/LTE-M |
| Industrial Process Safety |
| Oil and Gas and Petrochemical |
| Automotive and Transportation |
| Consumer Electronics and Smart Homes |
| Commercial Buildings and Offices |
| Healthcare and Pharmaceuticals |
| Food and Beverage Production |
| Academic and RandD Laboratories |
| Others |
| Less than 1 ppm |
| 1 - 10 ppm |
| 10 - 100 ppm |
| Greater than 100 ppm |
| Direct Sales |
| Distributor / VAR Channel |
| E-commerce |
| North America | United States |
| Canada | |
| Mexico | |
| Europe | United Kingdom |
| Germany | |
| France | |
| Italy | |
| Rest of Europe | |
| Asia-Pacific | China |
| Japan | |
| India | |
| South Korea | |
| Rest of Asia-Pacific | |
| Middle East | Israel |
| Saudi Arabia | |
| United Arab Emirates | |
| Turkey | |
| Rest of Middle East | |
| Africa | South Africa |
| Egypt | |
| Rest of Africa | |
| South America | Brazil |
| Argentina | |
| Rest of South America |
| By Sensor Technology | Photoionization Detector (PID) | |
| Metal Oxide Semiconductor (MOS) | ||
| Electrochemical Sensor | ||
| Optical Fiber Sensor | ||
| Quartz Crystal Microbalance (QCM) | ||
| Others | ||
| By Device Form Factor | Fixed/Wall-Mounted Monitors | |
| Handheld/Portable Detectors | ||
| Wearable Badges | ||
| Integrated Multi-Parameter IAQ Monitors | ||
| Embedded Sensor Modules | ||
| By Connectivity | Wired (BACnet, Modbus, Ethernet, CAN) | |
| Wireless | Wi-Fi | |
| Bluetooth/BLE | ||
| Zigbee/Thread | ||
| LoRaWAN/NB-IoT/LTE-M | ||
| By End-use Industry | Industrial Process Safety | |
| Oil and Gas and Petrochemical | ||
| Automotive and Transportation | ||
| Consumer Electronics and Smart Homes | ||
| Commercial Buildings and Offices | ||
| Healthcare and Pharmaceuticals | ||
| Food and Beverage Production | ||
| Academic and RandD Laboratories | ||
| Others | ||
| By Detection Range | Less than 1 ppm | |
| 1 - 10 ppm | ||
| 10 - 100 ppm | ||
| Greater than 100 ppm | ||
| By Distribution Channel | Direct Sales | |
| Distributor / VAR Channel | ||
| E-commerce | ||
| By Geography | North America | United States |
| Canada | ||
| Mexico | ||
| Europe | United Kingdom | |
| Germany | ||
| France | ||
| Italy | ||
| Rest of Europe | ||
| Asia-Pacific | China | |
| Japan | ||
| India | ||
| South Korea | ||
| Rest of Asia-Pacific | ||
| Middle East | Israel | |
| Saudi Arabia | ||
| United Arab Emirates | ||
| Turkey | ||
| Rest of Middle East | ||
| Africa | South Africa | |
| Egypt | ||
| Rest of Africa | ||
| South America | Brazil | |
| Argentina | ||
| Rest of South America | ||


Key Questions Answered in the Report
What is the current size of the VOC sensors market?
The VOC sensors market is valued at USD 4.69 billion in 2026.
How fast will the VOC sensors market grow through 2031?
It is forecast to expand at a 4.12% CAGR, reaching USD 5.73 billion by 2031.
Which sensor technology is gaining the most momentum?
Photoionization detectors are projected to grow at a 7.85% CAGR between 2026 and 2031.
Why are VOC sensors important for EV battery production?
They detect solvent leaks such as N-methyl-2-pyrrolidone in real time, protecting workers and satisfying regulatory audits on electrode-coating lines.
Which region will see the fastest market expansion?
The Middle East and Africa is expected to post the highest 8.85% CAGR due to smart-city and industrial-safety projects.
Are wearable VOC badges a niche or a growth area?
Wearable badges record the highest 9.12% CAGR through 2031, driven by low-power MEMS-PID technology and stricter personal-exposure regulations.
Page last updated on:


