
Oxygen Gas Sensors Market Size and Share
Market Overview
| Study Period | 2020 - 2031 |
|---|---|
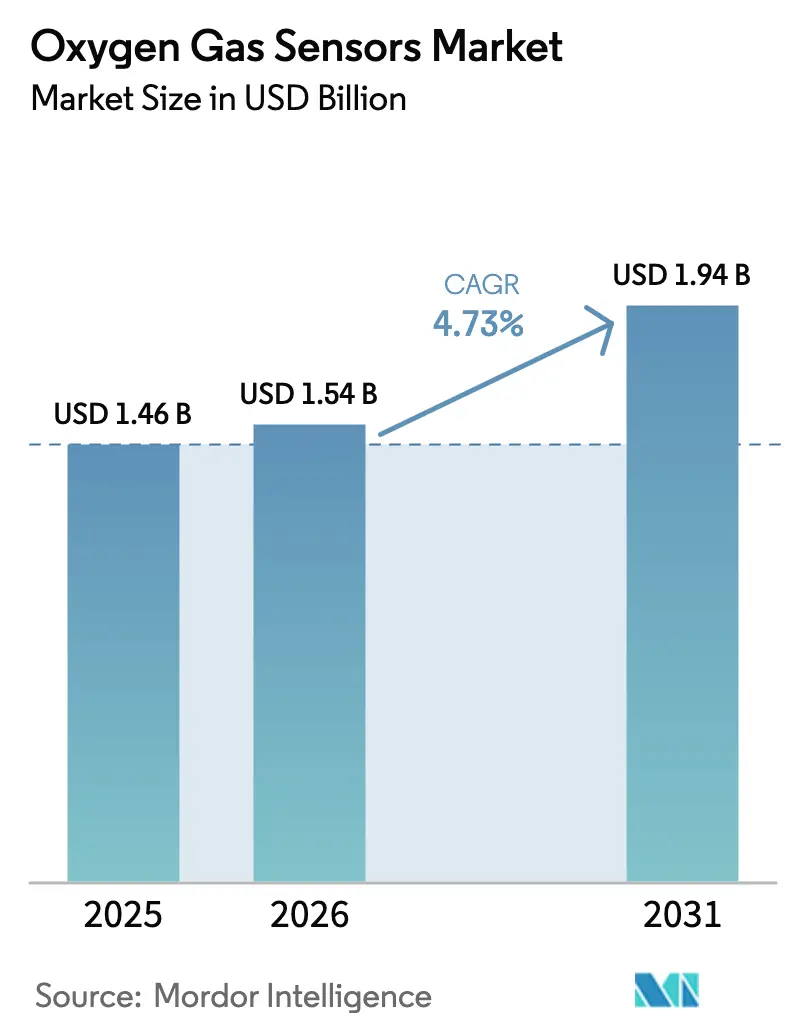
| Market Size (2026) | USD 1.54 Billion |
| Market Size (2031) | USD 1.94 Billion |
| Growth Rate (2026 - 2031) | 4.73 % |
| Fastest Growing Market | Middle East |
| Largest Market | Asia Pacific |
| Market Concentration | Medium |
Major Players *Disclaimer: Major Players sorted in no particular order Image © Mordor Intelligence. Reuse requires attribution under CC BY 4.0. | |
Oxygen Gas Sensors Market Analysis by Mordor Intelligence
The oxygen gas sensors market size is expected to grow from USD 1.46 billion in 2025 to USD 1.54 billion in 2026 and is forecast to reach USD 1.94 billion by 2031 at 4.73% CAGR over 2026-2031. This growth reflects a steady replacement cycle in mature regions and a rapid uptake in emerging economies that are introducing stricter safety rules and more emission-control equipment. The rising adoption of semiconductor cleanrooms, medical life-sciences devices, and smart buildings broadens the application base, while advances in optical and zirconia technologies shorten response times and extend operating ranges. Regulatory standards, such as Euro 7 and the U.S. EPA Tier 4, are driving demand for the automotive sector, and industrial users are transitioning from analog to wireless connectivity to reduce installation costs. Price volatility in platinum-group metals poses a cost headwind, yet diversified sourcing strategies and digital calibration tools partially offset margin pressure.
Key Report Takeaways
- By type, amperometric sensors led with 42.36% revenue share in 2025, while optical sensors are set to expand at a 5.93% CAGR through 2031.
- By technology, infrared sensors commanded 37.19% of the oxygen gas sensors market share in 2025, whereas zirconia solid-state sensors will grow at a 5.97% CAGR to 2031.
- By end user, the automotive sector captured 28.39% of 2025 revenue, and smart buildings are expected to register a 6.31% CAGR through 2031.
- By measurement range, 1-25% sensors accounted for 44.27% of 2025 sales, and 0-1% sensors are expected to expand at a 5.49% CAGR through 2031.
- By output signal, analog interfaces accounted for 51.38% of 2025 revenue, and wireless protocols are forecast to rise at a 5.54% CAGR through 2031.
- In 2025, fixed units represented 63.17% of demand, while portable devices are expected to increase at a 5.27% CAGR through 2031.
- By geography, the Asia-Pacific region led with 33.49% revenue in 2025, and the Middle East is poised to post a 5.89% CAGR through 2031.
Note: Market size and forecast figures in this report are generated using Mordor Intelligence’s proprietary estimation framework, updated with the latest available data and insights as of January 2026.
Market Trends and Insights
Drivers Impact Analysis of Oxygen Gas Sensors Market*
| Driver | (~) % Impact on CAGR Forecast | Geographic Relevance | Impact Timeline |
|---|---|---|---|
| Government regulations for workplace safety | +1.2% | Global, with strongest enforcement in North America and Europe | Medium term (2-4 years) |
| Growing demand for automotive emission control systems | +1.0% | Global, led by Europe (Euro 7), North America (EPA Tier 4), and Asia-Pacific (China VI) | Short term (≤ 2 years) |
| Expanding use in medical and life-sciences devices | +0.8% | North America and Europe core, spillover to Asia-Pacific urban centers | Medium term (2-4 years) |
| Investments in smart buildings and HVAC monitoring | +0.7% | North America and Europe, early adoption in Asia-Pacific tier-1 cities | Long term (≥ 4 years) |
| Rapid adoption in micro-electronics cleanrooms | +0.6% | Asia-Pacific (Taiwan, South Korea, China, Japan), North America (Arizona, Texas) | Short term (≤ 2 years) |
| Integration with wireless IoT platforms | +0.5% | Global, with industrial IoT hubs in Germany, United States, China | Medium term (2-4 years) |
| Source: Mordor Intelligence | |||
Government Regulations for Workplace Safety
Mandatory oxygen monitoring in confined spaces, as mandated by OSHA, NFPA 72, and ATEX, prompts industrial operators to replace legacy detectors at shorter intervals. Penalties that range from USD 7,000 to USD 70,000 per violation make non-compliance costly, so facility managers favor digital sensors with remote diagnostics.[1]Occupational Safety and Health Administration, “Confined Spaces – Overview,” OSHA.GOV European chemical plants are adopting IECEx-certified devices that command price premiums while promising lower downtime. With enforcement audits typically following two-year cycles, the rule-driven pull translates into a persistent wave of equipment refreshes, thereby widening the installed base of connected detectors. Vendors that bundle calibration services capture recurring revenue. As more jurisdictions align with international codes, the oxygen gas sensors market gains a durable compliance-led floor.
Growing Demand for Automotive Emission Control Systems
Tightening rules, such as Euro 7, EPA Tier 4, and China VI, have driven the adoption of zirconia lambda sensors in every new light vehicle and many non-road engines.[2]European Commission, “Euro 7 Standards for Cars, Vans, Lorries and Buses,” EC.EUROPA.EU Automakers now integrate upstream and downstream sensors to meet on-board diagnostics thresholds, doubling unit content per vehicle. The global car park of 1.4 billion light vehicles sustains a large aftermarket, where change-out typically occurs every 80,000-160,000 kilometers. Because sensor accuracy directly influences catalytic-converter efficiency, quality standards remain high, benefiting established tier-one suppliers with ceramic expertise. Near-term demand spikes during each model-year transition, then normalizes into replacement cycles, keeping volumes predictable for large-scale producers.
Expanding Use in Medical and Life-Sciences Devices
Ventilators, anesthesia workstations, and remote patient monitors embed multiple oxygen cells to meet ISO 80601 and IEC 60601 accuracy requirements. The U.S. FDA cleared 27 oxygen-related devices in 2024 alone, underscoring sustained pipeline activity. Hospitals favor galvanic or paramagnetic designs that maintain calibration stability for 12-18 months. Rising demand for neonatal and home-care units widens the addressable base beyond acute-care settings. Reimbursement models that link payments to patient-safety metrics add economic weight, encouraging health-system upgrades. Suppliers who bundle disposable sampling sets and cloud-based analytics deepen switching costs.
Investments in Smart Buildings and HVAC Monitoring
Indoor air quality mandates in ASHRAE 241-2023 and LEED v4.1 embed oxygen monitoring within demand-controlled ventilation strategies. Smart buildings utilize oxygen readings as a proxy for occupancy and metabolic load, reducing HVAC energy consumption by up to 30%. Germany earmarked EUR 500 million (USD 565 million) for energy-efficient retrofits in 2024, with a 15% carve-out for advanced controls that include oxygen sensors. Long commercial-building lifecycles translate into multi-decade revenue, especially for cloud-connected platforms that monetize data. Early adoption in the United States and Europe has set templates now being copied by high-rise developers in the Asia-Pacific region, pushing the oxygen gas sensors market toward integrated smart-building ecosystems.
Restraints Impact Analysis of Oxygen Gas Sensors Market*
| Restraint | (~) % Impact on CAGR Forecast | Geographic Relevance | Impact Timeline |
|---|---|---|---|
| Lack of awareness in small and medium enterprises | -0.4% | Global, most acute in South America, Africa, and Southeast Asia | Medium term (2-4 years) |
| Price volatility of catalytic materials | -0.3% | Global, affecting catalytic-bead and amperometric sensor suppliers | Short term (≤ 2 years) |
| Catalyst poisoning leading to sensor drift | -0.3% | Chemical, petrochemical, and wastewater sectors globally | Medium term (2-4 years) |
| Calibration challenges in high-humidity environments | -0.2% | Tropical and coastal regions, Southeast Asia, Gulf Cooperation Council states | Long term (≥ 4 years) |
| Source: Mordor Intelligence | |||
Catalyst Poisoning Leading to Sensor Drift
Sulfur compounds and siloxanes reduce the sensitivity of catalytic-bead and amperometric sensors by fouling active sites, necessitating recalibration as frequently as every 90 days.[3]Instrument Society of America, “Calibration Best Practices for Industrial Gas Sensors,” ISA.ORG In petrochemical refineries, sulfur dioxide levels above 10 ppm halve sensor life within six months, thereby inflating maintenance budgets. Biogas plants encounter siloxane build-up, prompting replacement rather than service. Although manufacturers are testing poison-resistant coatings, field validation typically spans two years or more, delaying widespread adoption. Until then, the total cost of ownership remains a deterrent for facilities handling sour gases.
Calibration Challenges in High-Humidity Environments
Electrochemical sensors rely on aqueous electrolytes; therefore, humidity swings above 80% can shift output by 2-5%, breaching IEC 60079 accuracy limits. Plants in coastal Asia and the Gulf Cooperation Council report calibration intervals of 90-120 days, instead of the standard six months in the lab. Zirconia devices are humidity-immune, but they cost 30-40% more, which limits their use in budget-sensitive sectors. Vendors are experimenting with hydrophobic membranes and temperature-compensated circuits; however, evidence of 12-month stability in tropical sites remains scant. Prolonged field trials will determine long-term uptake.
*Our forecasts treat driver/restraint impacts as directional, not additive. The impact forecasts reflect baseline growth, mix effects, and variable interactions.
Oxygen Gas Sensors Market Segment Analysis
By Type:
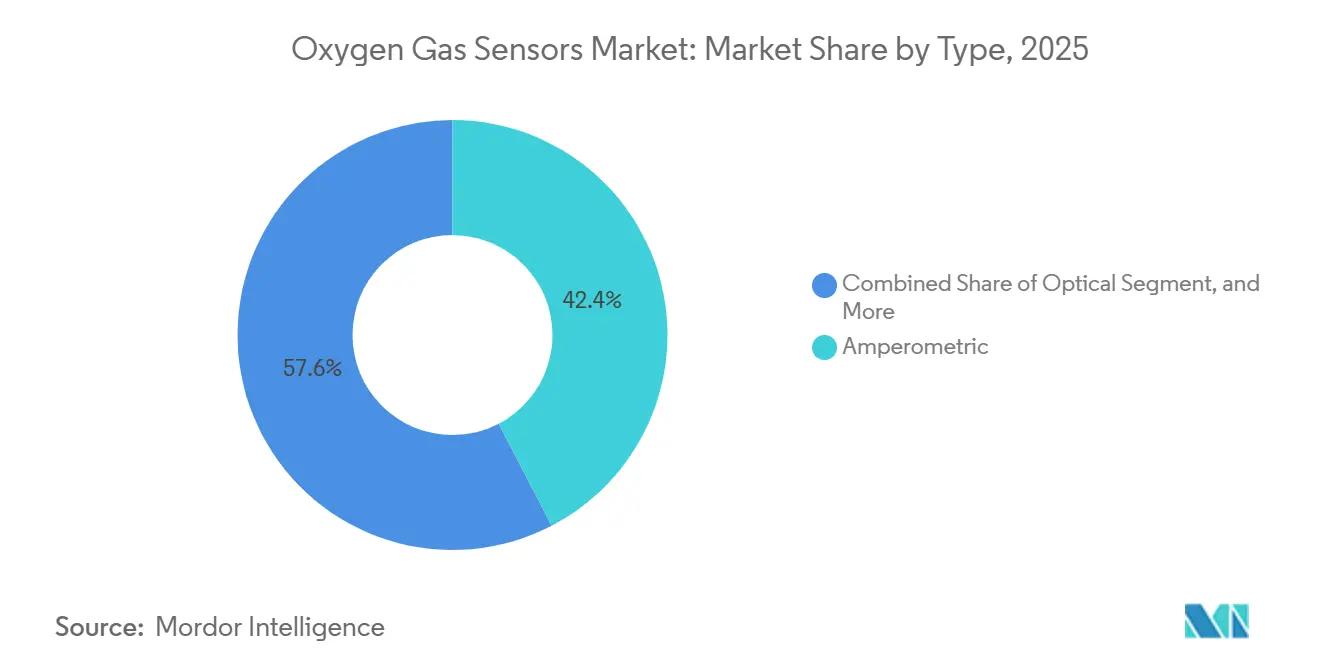
Optical Sensors Gain Traction in Safety-Critical ApplicationsIn 2025, amperometric designs accounted for 42.36% of the oxygen gas sensor market revenue, dominating portable detectors and ventilators due to their combination of low power draw and ±2% accuracy across the 0-25% oxygen range. Optical sensors are set to outpace category growth, projected to expand at a rate of 5.93% through 2031. This growth rate surpasses the category growth by 120 basis points, highlighting the increasing demand and adoption of optical sensors across various applications.
Operators in refineries and power plants value the sub-2-second response time of tunable diode laser units, which reduce fuel consumption by 3-5% in burner control loops. Optical devices cost USD 8,000-15,000, yet their five-year maintenance-free runtime lowers lifecycle expense. As certification bodies clear more optical models for SIL2 processes, adoption spreads to LNG trains, glass furnaces, and chemical reactors. Portable optical offerings also emerge for hazardous response teams. The higher accuracy and durability of optical designs tilt market perception, positioning them to pull share from amperometric cells whenever response speed or sensor poisoning risk is paramount.



By Technology:
Zirconia Solid-State Sensors Expand Beyond AutomotiveInfrared technology led the market with 37.19% revenue share in 2025, serving non-consumptive custody-transfer applications. Catalytic and electrochemical cells dominate portable safety devices and medical gear where compactness is crucial. Zirconia solid-state sensors, with their immunity to humidity and ability to withstand temperatures up to 1,600 °C, are poised to register a 5.97% CAGR through 2031. These sensors are increasingly being adopted across various industries due to their durability and reliability in extreme environmental conditions, making them a preferred choice for applications requiring high precision and stability.
Automotive lambda sensors now exceed 200 million units annually, anchoring the market, and wideband variants, such as the Bosch LSU 4.9, enable lean-burn strategies that improve fuel economy by 8-12%, while meeting Euro 7 limits. Industrial uptake accelerates in glass, aluminum, and steel furnaces that rely on precise oxygen trimming to curb energy use. The oxygen gas sensor market size for zirconia devices is on track to narrow the gap with infrared solutions as more process industries favor durable, calibration-stable measurements.
By End User:
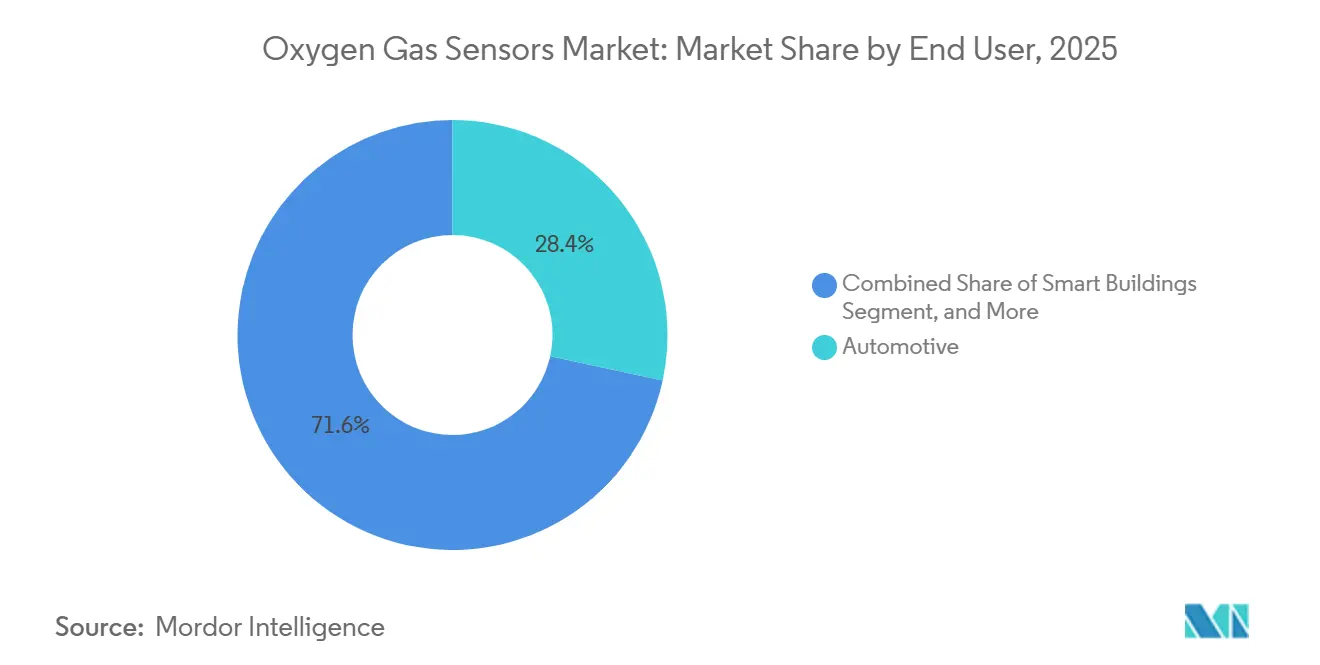
Smart Buildings Emerge as Growth LeaderAutomotive accounted for 28.39% of 2025 revenue, driven by twin-sensor exhaust configurations and a large installed base that secures replacement income. Chemical and petrochemical plants utilize sensors for explosion prevention in inerting systems, which maintain tanks at an oxygen level of less than 10%. Hospitals, biotech labs, and hyperbaric suites demand ±2% accuracy to hit reimbursement-linked safety metrics.
Industrial manufacturing, water treatment, and food packaging each sustain their niche demand. Smart-building applications, however, are expected to grow at a rate of 6.31% through 2031, the fastest among all verticals. Energy-efficiency credits and wellness certifications spur facility managers to install networked oxygen nodes that integrate into building-management systems. Vendors offering cloud dashboards and predictive maintenance analytics occupy a sweet spot, and the oxygen gas sensors market size tied to commercial real estate is expected to accelerate as global floor space rises.
By Measurement Range:
ppm-Level Sensors Serve Semiconductor CleanroomsSensors rated for 1-25% oxygen accounted for 44.27% of 2025 sales, as this range aligns with human occupancy and most combustion processes. High-concentration models above 25% serve oxygen concentrators and aerospace needs. Devices in the 0-1% range are set to lead the pack, with a projected growth rate of 5.49% through 2031. This growth highlights the increasing demand and adoption of these devices, driven by advancements in technology and their expanding applications across various industries.
Semiconductor fabs require sub-10-ppm oxygen levels in nitrogen-purged zones, as specified in SEMI S2-0718, prompting fabs to deploy arrays of trace-oxygen analyzers with detection limits of 0.1 ppm. Similar purity requirements exist in pyrophoric chemical storage. Given the steep cost of wafer scrap, fabs are willing to pay USD 10,000 or more per analyzer, supporting premium pricing. The oxygen gas sensors market share for ppm-level devices will thus edge higher, although volumes remain niche compared with mainstream mid-range sensors.
By Output Signal:
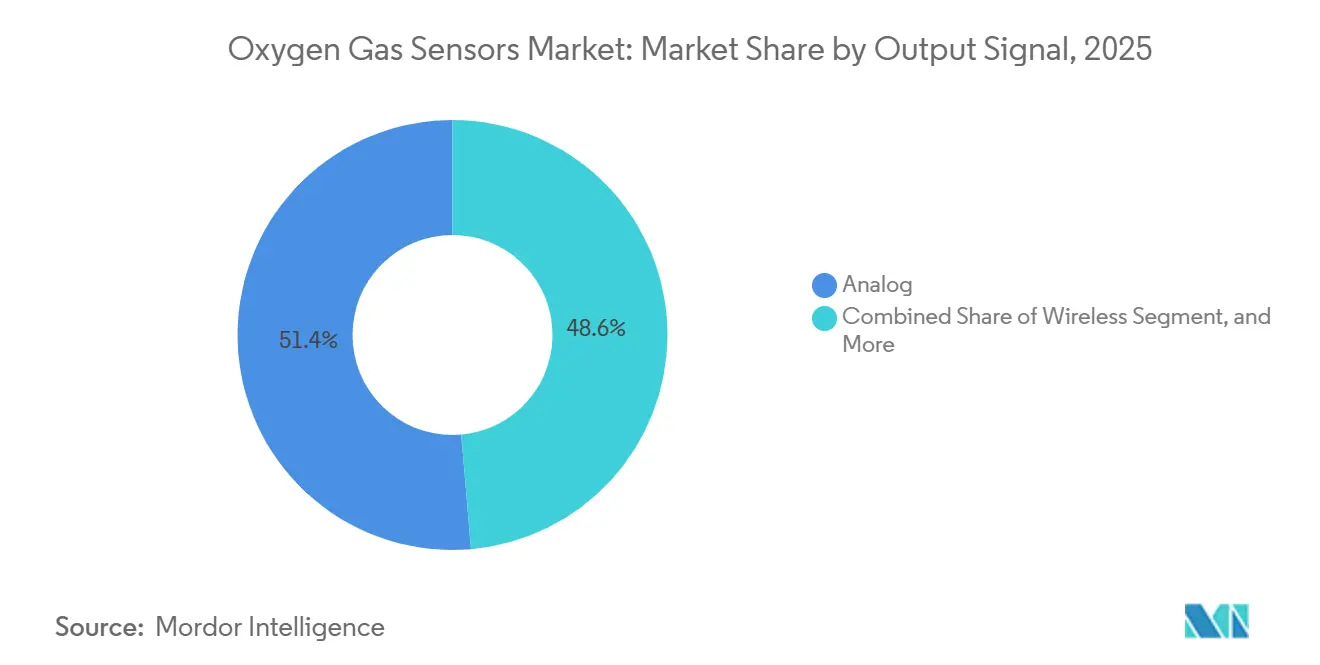
Wireless Protocols Enable Portable MonitoringAnalog 4-20 mA loops retained 51.38% revenue in 2025, thanks to vast legacy DCS architectures. Digital serial buses dominate embedded medical and automotive modules that exploit microcontroller integration. LoRaWAN's kilometer-scale coverage and decade-long battery life are key factors driving the projected 5.54% growth rate in wireless output. This growth is expected to persist through 2031, as these features enable efficient and long-range connectivity, making LoRaWAN a preferred choice for various applications in the wireless market.
Portable detectors that stream Bluetooth data to smartphones provide safety managers with real-time visibility into worker exposure. Cloud platforms, such as ABB Ability, utilize machine learning to predict drift, resulting in a 15-25% reduction in service visits. However, wireless sensors carry a 20-30% hardware premium; any installation that requires more than 50 meters of cabling tilts the economics toward cable-free deployment.
By Installation:
Portable Units Gain Share in Field InspectionFixed arrays comprised 63.17% of 2025 volumes, driven by OSHA rules that demand round-the-clock monitoring in confined spaces. Plants rely on sub-5-second response and 12-month calibration stability to feed control loops. Contractors, emergency responders, and industrial hygienists are increasingly relying on portable units for spot checks across expansive sites, driving a projected 5.27% CAGR for these devices.
Battery improvements now yield 24-36 hour run time, sufficient for full shifts. Wireless data logging eases compliance documentation, and ruggedized housings withstand harsh field conditions. As large facilities maintain their installed bases, a rising fleet of mobile detectors emerges, facilitating more adaptable and efficient inspections in the oxygen gas sensors market. This balance between stationary systems and portable devices highlights the market's ability to cater to diverse operational needs, ensuring both comprehensive monitoring and flexibility.
Geography Analysis
APAC Oxygen Gas Sensors Market
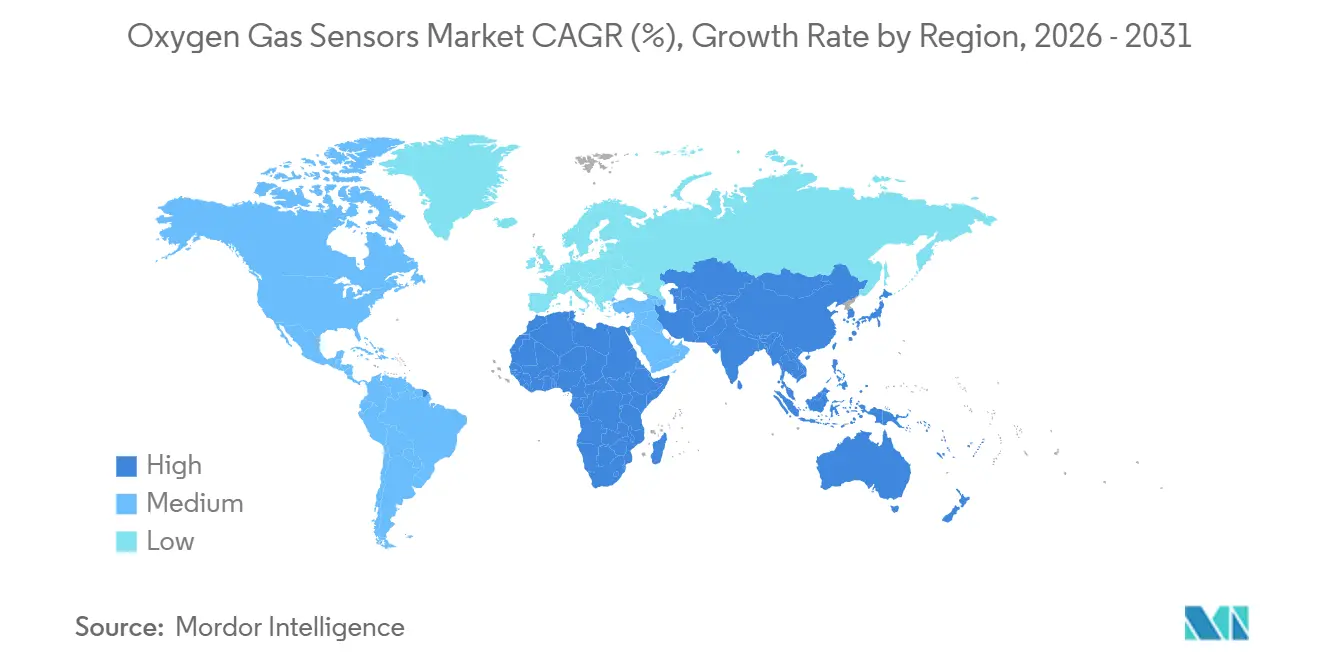
The Asia-Pacific region led the oxygen gas sensors market, accounting for 33.49% of the market revenue in 2025. Semiconductor investment in Taiwan, South Korea, and China drives demand for trace-oxygen analyzers, while India’s auto output of 5.5 million units boosts lambda-sensor shipments. Petrochemical expansions in China added 8 million metric tons of ethylene capacity between 2023-2025, with each new cracker installing dozens of oxygen nodes. Japan’s strict confined-space rules sustain replacement sales, and Australian mines continue to procure portable units for underground ventilation checks.
MEA Oxygen Gas Sensors Market
The Middle East is projected to grow at a rate of 5.89% through 2031. Petrochemical megaprojects under Saudi Vision 2030 and ADNOC’s carbon-capture initiatives specify continuous oxygen monitoring for combustion and sulfur recovery units. Qatar’s LNG capacity build-out and Israel’s expanding medical-device exports further widen the regional demand base. South Africa’s mining code mandates oxygen sensing in deep shafts, and Egypt’s Suez Canal Economic Zone anchors new petrochemical builds.
The Americas and Europe Oxygen Gas Sensors Market
North America and Europe jointly accounted for 45% of market revenue in 2025. U.S. power plants must maintain analyzer accuracy within ±0.5% under EPA rules, creating a stable replacement cadence. Germany’s TRGS 510 and the U.K. HSE’s enforcement notices bolster sales of both fixed and wireless detectors. France’s nuclear fleet utilizes oxygen sensors in hydrogen monitoring, while Brazil’s flex-fuel fleet in South America creates niche demand as it pivots toward hybrid vehicles.

Regulatory Landscape
Oxygen gas sensors sold into industrial safety and hazardous-area monitoring are shaped by workplace-safety codes and product performance standards. In Europe, DIN EN 50104:2024-02 sets performance requirements and test methods for electrical equipment measuring oxygen concentration up to 25% (v/v) in gas mixtures, which supports comparability across fixed and portable devices used in occupational settings.
For explosive atmospheres, EN IEC 60079-29-0:2026 (published January 16, 2026) specifies general requirements and test methods for gas detection equipment, including oxygen, and it feeds into certification paths and documentation for deployments in petrochemical, mining, and other hazardous installations. In North America, code alignment and standards development for gas and vapour detectors and sensors is linked to electrical and fire-alarm codes (for example, NFPA 70 and NFPA 72), while medical and life-sciences applications are influenced by U.S. FDA requirements around current good manufacturing practice (CGMP), certification, postmarketing safety reporting, and labeling updates for medical gases (June 2024).
Value Chain Analysis
The value chain starts with raw materials and components, and oxygen-sensing architectures create different input dependencies. Zirconia-based elements depend on high-temperature ceramics and processing know-how, while amperometric and catalytic designs face greater exposure to platinum-group-metal and catalyst-related cost swings highlighted in the report context. Electronics, packaging, and calibration gases feed into module assembly, with additional requirements for hazardous-area builds (for example, IECEx/ATEX aligned designs) and medical-grade traceability when sensors are embedded in regulated devices.
Upstream component manufacturing leads into sensor element fabrication, module integration (signal conditioning, analog 4-20 mA, digital, and wireless stacks), and then certification and calibration services before reaching OEM channels (automotive and medical), industrial automation integrators, and safety distributors. Established leaders (for example, Robert Bosch, Honeywell, ABB, and Yokogawa) pair hardware with software and services, including cloud monitoring and calibration programs, to increase recurring revenue and reduce end-user downtime. Downstream, aftermarket replacement, periodic bump testing, and scheduled calibration remain central to total cost of ownership for industrial safety and automotive lambda-sensor applications, which keeps distributor networks, service partners, and stocked spares close to end markets in focus.
Competitive Landscape
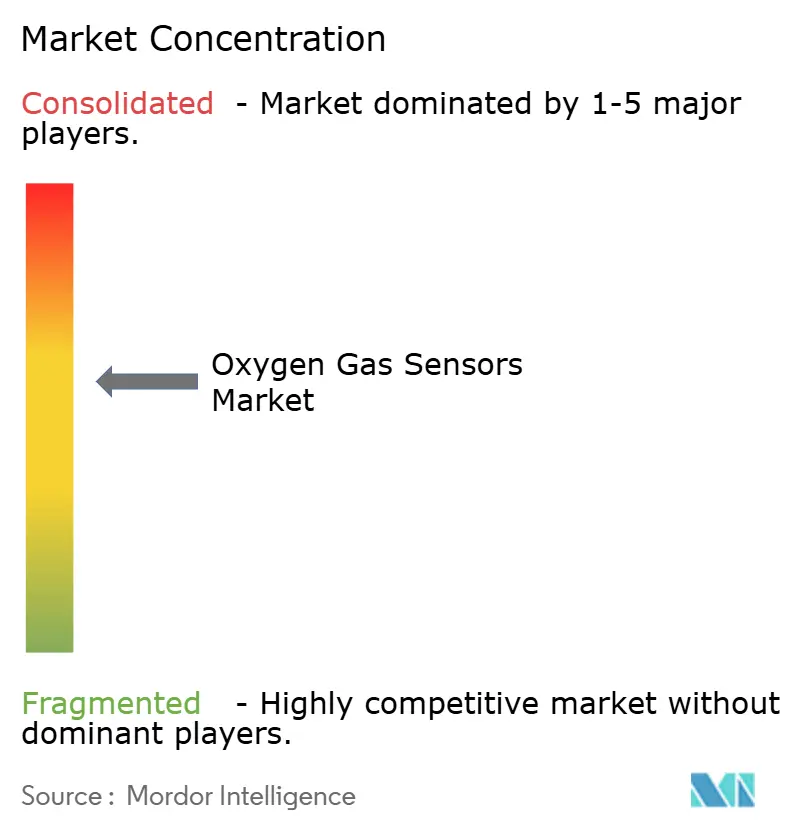
Market concentration is moderate. The top five companies, Robert Bosch, Honeywell, ABB, Yokogawa, and Sensirion, control roughly 45-50% of the global revenue, leaving space for niche players such as City Technology, AlphaSense, Figaro, and NevadaNano. Bosch’s vertically integrated lambda-sensor line produces over 100 million units per year at a sub-USD 15 manufacturing cost, but the firm’s reach into high-value industrial niches is limited.
Yokogawa commands petrochemical burner control with its SIL 2-rated tunable diode laser analyzers, priced at nearly USD 12,000. Honeywell pairs portable detectors with cloud analytics to lock in recurring calibration kits. Sensirion’s miniaturized flow-plus-oxygen chip dominates emergency ventilators. ABB leverages the Ability platform to generate revenue from services provided by installed analyzers.
Disruptors target designs that are wireless, poison-resistant, or maintenance-free, aiming to address evolving market demands for advanced and reliable solutions. NevadaNano has introduced a MEMS-based multi-gas spectrometer boasting a five-year lifespan, which represents a significant innovation in gas detection technology. However, it still awaits extensive field validation to establish its reliability and performance across diverse applications. Despite buyers exploring new form factors and innovative technologies, established players maintain an advantage due to ongoing certification and service challenges, which continue to act as significant barriers for new entrants.
Oxygen Gas Sensors Industry Leaders
Robert Bosch GmbH
ABB Limited
Honeywell International Corporation
Eaton Corporation
General Electric Company
- *Disclaimer: Major Players sorted in no particular order
Oxygen Gas Sensors Market Companies Covered in this Report
- Robert Bosch GmbH
- Honeywell International Corporation
- ABB Ltd.
- Yokogawa Electric Corporation
- Figaro Engineering Inc.
- Eaton Corporation
- Advanced Micro Instruments Inc.
- City Technology Ltd.
- General Electric Company
- Sensirion AG
- TE Connectivity plc
- Mettler-Toledo International Inc.
- AlphaSense Inc.
- Aeroqual Ltd.
- NevadaNano Inc.
- SGX Sensortech
- Control Instruments Corporation
- Fujikura Ltd.
- Maxtec LLC
- Membrapor AG

Market Opportunities and Future Outlook
Regulatory-driven material transitions and certification-led upgrades create replacement demand, particularly where installed bases need low-friction swaps. The move away from lead-based legacy designs is being addressed through new lead-free galvanic offerings, including Alphasense launching the O2-A2-GLF in January 2026 as a drop-in replacement for two-pin lead-based sensors aimed at industrial safety. This aligns with RoHS-aligned procurement needs and simplifies retrofit decisions for existing installations.
Safety-critical and hazardous-area installations are also pulling the market toward higher-integrity architectures and certified transmitter systems. In March 2026, DwyerOmega introduced the Microx ProSafe SIL2 dual-channel oxygen transmitter based on zirconium dioxide (ZrO2), aligning with buyer demand for redundancy in critical monitoring loops. In July 2026, AMETEK Process Instruments extended its 993X gas analyzer lineup with ATEX and IECEx Zone 1 explosion-proof (Ex d) enclosures to broaden applicability in hazardous plants. Across industrial automation and smart-building deployments, the opportunity clusters around digital diagnostics, easier integration into control platforms, and reduced field service burden, especially where wireless or networked monitoring reduces installation complexity compared with long cable runs.
Recent Industry Developments in Oxygen Gas Sensors Market
- May 2026: Robert Bosch GmbH expanded its automotive aftermarket portfolio with 172 new part numbers released for Q1 2026, including seven new oxygen sensor part numbers. The update broadened vehicle-in-operation coverage by about 6.17 million vehicles. This strengthened Bosch's position in replacement demand tied to emissions compliance and maintenance cycles.
- March 2026: Honeywell launched the 4-Series NDIR Hydrocarbon Gas Sensor, an optical non-dispersive infrared sensor designed for use in fixed and portable gas detectors for industrial environments. The launch reinforces the shift toward optical sensing platforms that target improved robustness in harsh applications such as mining and petrochemical sites. Sensor stability and maintenance intervals influence detector total cost of ownership.
- October 2025: ABB Ltd. acquired Swiss startup AirSense Analytics to integrate maintenance-free solid-state oxygen sensors into the ABB Ability platform for remote oil and gas facilities. The acquisition deepened ABB's software-and-services stack around installed analyzers. ABB paired sensor hardware with digital monitoring and longer calibration intervals.


Oxygen Gas Sensors Market Report Scope and Research Methodology
Market Definition and Coverage
For this methodology, the market includes revenues earned from sensors and sensing modules that measure oxygen concentration in gas phase, across industrial, medical, building, environmental, and transportation uses, and it is sized on a global basis in USD.
Scope exclusions: We exclude standalone control panels, complete gas detection systems, calibration gases, installation labor, and after-sales service contracts unless they are bundled into the sensor selling price.
Segments Covered in This Report
- By Type
- Potentiometric
- Amperometric
- Resistive
- Optical
- Tunable Diode Laser
- By Technology
- Infrared
- Catalytic Bead
- Electrochemical
- Zirconia Solid-State
- Other Technologies
- By End-User Industry
- Chemical and Petrochemical
- Automotive
- Medical and Life Sciences
- Industrial Manufacturing
- Water and Wastewater
- Smart Buildings
- Food and Beverage
- By Measurement Range
- 0-1 % O₂
- 1-25 % O₂
- 25-100 % O₂
- By Output Signal
- Analog
- Digital
- Wireless
- By Installation
- Fixed/Stationary
- Portable/Handheld
- By Geography
- North America
- United States
- Canada
- Mexico
- Europe
- Germany
- United Kingdom
- France
- Russia
- Rest of Europe
- Asia-Pacific
- China
- Japan
- India
- South Korea
- Australia
- Rest of Asia-Pacific
- Middle East and Africa
- Middle East
- Saudi Arabia
- United Arab Emirates
- Rest of Middle East
- Africa
- South Africa
- Egypt
- Rest of Africa
- Middle East
- South America
- Brazil
- Argentina
- Rest of South America
- North America
Data Sources, Market Sizing, and Validation
Desk Research
Desk research was used to set the fact base and the boundaries of demand, so the model starts with what can be verified in public data before assumptions are added. We rely on sources such as US OSHA and NIOSH safety guidance, US EPA air monitoring references, Eurostat industrial statistics, UN Comtrade trade data for relevant sensor and instrument codes, and standards bodies such as ISO and IEC for definitions that affect adoption and replacement cycles.
On top of this, we review annual reports, investor presentations, product datasheets, and credible press coverage to understand typical price bands, product lifetimes, and where oxygen sensing is being specified. When needed, we also use paid subscriptions for company financials and for patent databases to confirm innovation intensity and category boundaries. These desk sources are not exhaustive, and many other public documents and data points were also used for cross-checking and clarification.
Primary Interviews and Surveys
Primary work was done through expert interviews and structured surveys with sensor makers, channel partners, system integrators, and end users who specify oxygen sensing in plants, labs, and medical settings. Inputs from these interviews were used to refine how replacement timing works across APAC, EMEA, and the Americas, and to test whether the assumed mix of portable versus fixed installations and the average selling price ranges match what buyers actually procure.
Distribution of primary research fieldwork respondents
| Company type | Respondent position | Region |
|---|---|---|
| Top tier: 31% | CXOs: 15% | APAC: 42% |
| Mid tier: 48% | Functional/Unit leaders: 34% | EMEA: 31% |
| Smaller Players: 21% | Managers: 51% | Americas: 27% |
Market-Sizing & Forecasting
Sizing starts with a top-down build where industrial activity and regulated safety use cases are translated into an addressable sensor demand pool, and then value is reconstructed using typical units deployed and observed pricing. To keep the totals realistic, results are corroborated with selective bottom-up checks, such as sampling supplier revenues where available, channel checks on unit volumes, and a simple ASP x volume bridge by major end-use groups, followed by adjustments when the checks do not line up.
Key inputs used in the model include replacement cycle assumptions by technology, the split of fixed versus portable installations, output signal mix (analog, digital, wireless), measurement-range needs that influence sensor selection, and the pace of new capacity additions in process industries that lift installed base. For forecasting, we mainly use scenario analysis anchored to expert expectations on industrial output, safety enforcement intensity, and medical device utilization, and then we translate each scenario into unit growth and ASP movement. Where bottom-up visibility is weak, gaps are handled by applying conservative penetration rates to the installed base and keeping the ASP curve tied to observed product price bands instead of aggressive step-changes.
Data Validation & Update Cycle
Validation is done through multiple passes where model outputs are compared with independent signals such as trade flows, industrial production trends, and disclosed revenue direction from relevant public companies, and then the assumptions are revisited when variances are outside an acceptable range. Outliers are flagged, discussed internally, and rechecked with follow-up calls if the variance appears to be driven by scope confusion or timing effects.
Reports are refreshed annually, and interim updates are made when there are material events such as regulatory changes, supply disruptions, or sharp pricing shifts in key components. Before delivery, we perform a final data sweep so the numbers reflect the latest available information and the latest expert feedback.
Mordor Intelligence's Global Oxygen Gas Sensors Market Market Size Compared Against Other Published Estimates
Published market sizes for oxygen gas sensors can vary a lot, even when the titles look similar, because each publisher draws the boundary in a slightly different place and uses different time points for prices and exchange rates. Differences also come from how portable versus fixed use is treated, and whether the estimate is built from a true demand pool or from a broader instrumentation spend proxy.
By tracking refresh points for ASP bands and replacement cycles, Mordor Intelligence keeps the model centered on gas-phase oxygen sensing demand rather than pulling in full gas detection systems, which is a common reason totals drift higher in some publications.
Benchmark comparison
| Source | Market Size | Gaps in Research Methodology |
|---|---|---|
| Mordor Intelligence | USD 1.54 B (2026) | |
| Industry Data Publisher A | USD 4.50 B (2024) | This estimate appears to use a wider product boundary and may blend oxygen sensors with broader gas sensing and instrumentation revenues, and it also starts from an earlier base year where pricing and currency timing can differ. |
| Global Research Outlet B | USD 1.76 B (2024) | This estimate uses a different base year and a longer forecast window, and it can shift the total depending on how it mixes sensor types and how it projects ASP growth without separating fixed industrial demand from other end uses. |
Taken together, the spread is mainly explained by scope and timing choices, rather than a single arithmetic error. When the boundary is kept tight around oxygen-in-gas measurement, and inputs like replacement and technology mix are checked with industry respondents, the final number stays easier to audit and repeat over time.


Key Questions Answered in the Report
What is the forecast revenue for the oxygen gas sensors market in 2031?
The market is projected to reach USD 1.94 billion by 2031, reflecting a 4.73% CAGR.
Which sensor type is growing fastest through 2031?
Optical sensors are expected to post a 5.93% CAGR thanks to sub-2-second response times and lower maintenance.
Why are zirconia solid-state sensors gaining traction outside automotive?
Their high-temperature and humidity tolerance makes them ideal for glass, metal, and chemical furnaces where electrochemical cells drift quickly.
How will smart-building adoption affect demand?
Indoor air quality mandates and energy-efficiency incentives should drive a 6.31% CAGR for smart-building deployments, the fastest of any end-user segment.
Which region is projected to record the highest growth?
The Middle East is forecast to advance at a 5.89% CAGR due to large petrochemical and LNG investments that specify continuous oxygen monitoring.
What is the main cost headwind for manufacturers?
Fluctuating platinum-group metal prices pressure catalytic-bead and amperometric sensor margins, especially for suppliers lacking long-term hedging strategies.
Page last updated on:





