Sensors In Oil And Gas Market Size and Share
Market Overview
| Study Period | 2020 - 2031 |
|---|---|
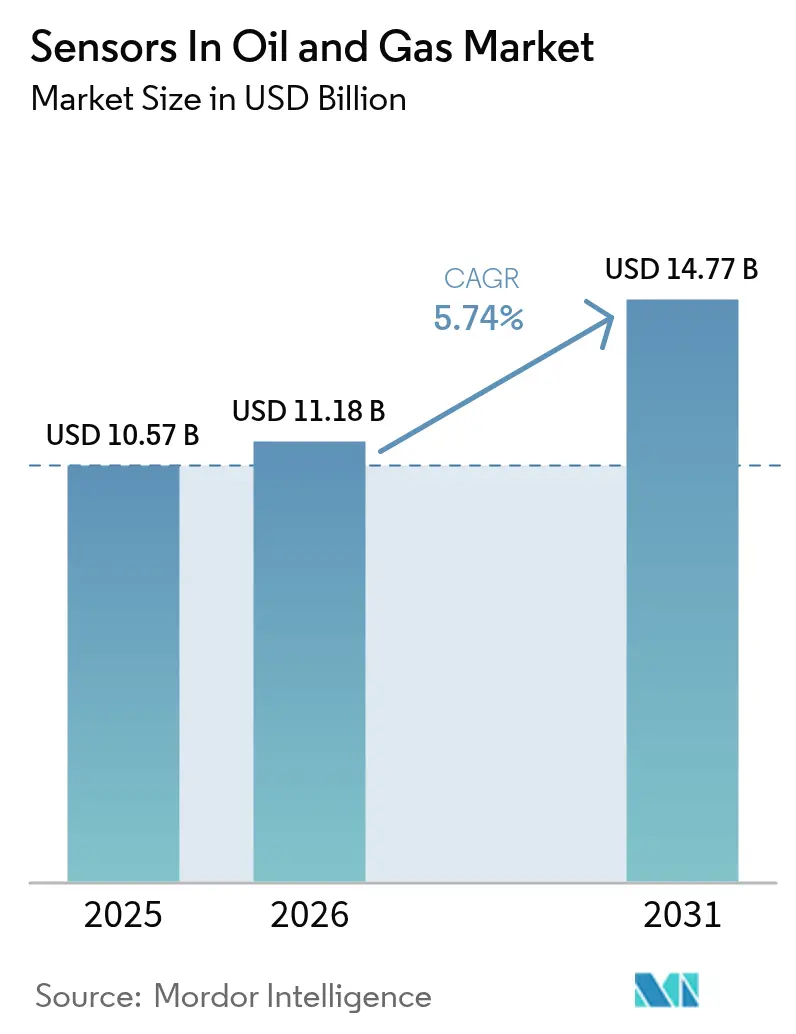
| Market Size (2026) | USD 11.18 Billion |
| Market Size (2031) | USD 14.77 Billion |
| Growth Rate (2026 - 2031) | 5.74% CAGR |
| Fastest Growing Market | Asia Pacific |
| Largest Market | North America |
| Market Concentration | Medium |
Major Players*Disclaimer: Major Players sorted in no particular order Image © Mordor Intelligence. Reuse requires attribution under CC BY 4.0. | |
Sensors In Oil And Gas Market Analysis by Mordor Intelligence
Sensors in oil and gas market size in 2026 is estimated at USD 11.18 billion, growing from 2025 value of USD 10.57 billion with 2031 projections showing USD 14.77 billion, growing at 5.74% CAGR over 2026-2031. This uptrend reflects operators’ rapid shift toward digital‐first asset strategies that cut downtime, curb emissions, and improve worker safety. North America anchors global revenue on the back of shale automation mandates, while Asia-Pacific shows the quickest climb as governments tie new capacity approvals to digital-readiness metrics. Demand favors platform-agnostic sensor suites that merge edge AI with secure wireless protocols, reducing brownfield retrofit costs and delivering enterprise-wide visibility. Established automation majors defend share through global service networks and IECEx-certified portfolios, yet niche innovators are succeeding with purpose-built, harsh-environment solutions that streamline methane quantification and deepwater integrity checks. Because digital twins now underpin maintenance scheduling, operators increasingly embed multi-parameter sensors in rotating equipment, pipelines, and flare stacks to realize real-time risk scoring and energy-efficiency gains.
Key Report Takeaways
- By sensor type, pressure devices held 26.35% of the sensors in oil and gas market share in 2025; ultrasonic designs are projected to grow at a 6.5% CAGR through 2031.
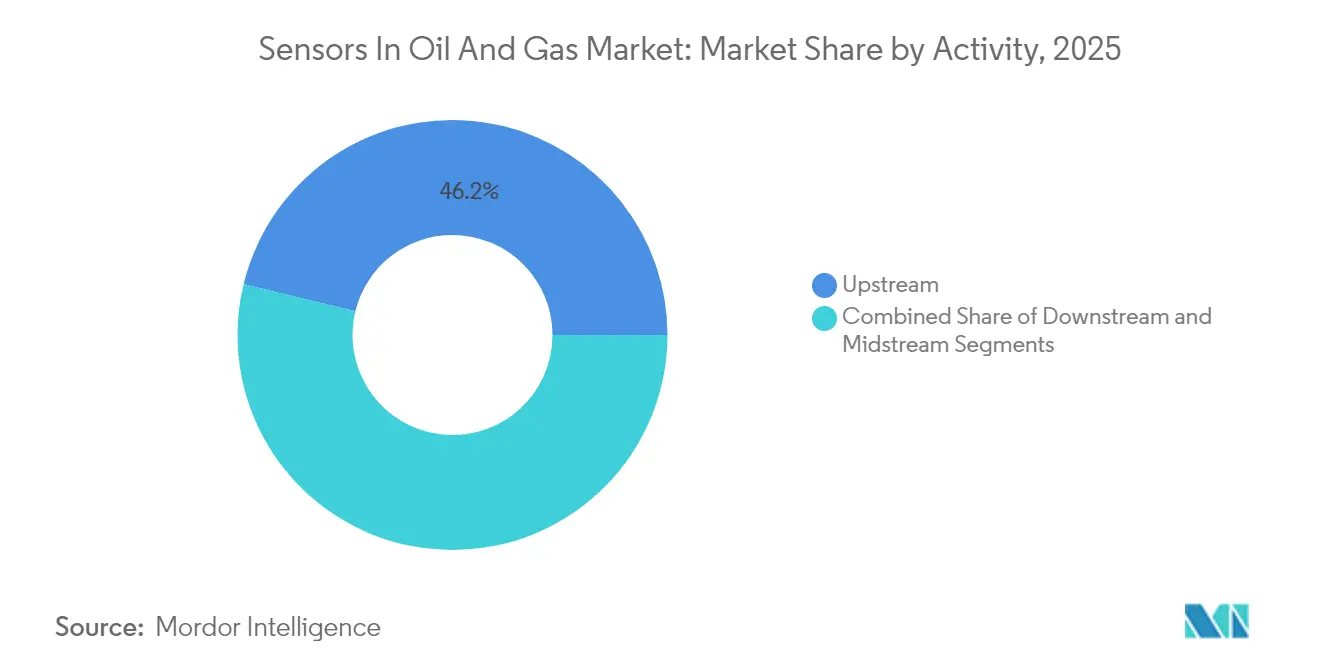
- By activity, upstream accounted for 46.20% share of the sensors in oil and gas market size in 2025, while midstream is poised to expand at a 6.92% CAGR to 2031.
- By application, process safety and emergency shutdown platforms captured 34.35% of 2025 revenue in the sensors in oil and gas market; emissions monitoring is advancing at a 6.6% CAGR through 2031.
- By connectivity, wired networks retained 71.10% share in 2025 in the sensors in oil and gas market; wireless deployments are forecast to post a 7.12% CAGR between 2026-2031.
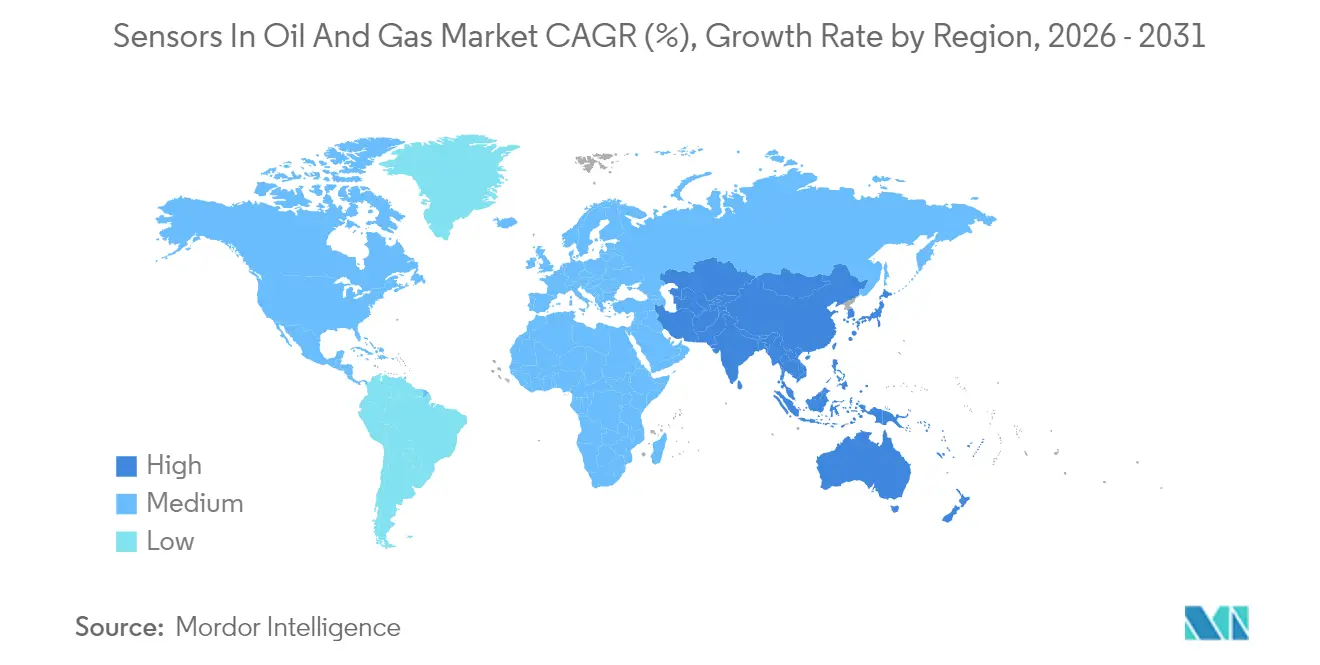
- By geography, North America retained 38.40% share in 2025 in the sensors in oil and gas market; Asia-Pacific is forecast to post a 6.95% CAGR between 2026-2031.
Note: Market size and forecast figures in this report are generated using Mordor Intelligence’s proprietary estimation framework, updated with the latest available data and insights as of 2026.
Global Sensors In Oil And Gas Market Trends and Insights
Drivers Impact Analysis*
| Driver | (~) % Impact on CAGR Forecast | Geographic Relevance | Impact Timeline |
|---|---|---|---|
| Digital-twins-enabled predictive maintenance | +1.2% | Global, with early adoption in North America and Europe | Medium term (2-4 years) |
| Rising demand for integrated safety-instrumented systems | +1.0% | Global, regulatory-driven in North America and EU | Short term (≤ 2 years) |
| Acceleration of deep-water and subsea projects post-COVID | +0.8% | Global offshore regions, concentrated in Gulf of Mexico, North Sea, Brazil | Medium term (2-4 years) |
| Increasing shale automation in North America | +0.7% | North America, primarily US Permian Basin | Short term (≤ 2 years) |
| Edge-AI sensor fusion for real-time asset integrity | +0.9% | Global, with advanced deployment in developed markets | Long term (≥ 4 years) |
| Methane-leak detection mandates (OGMP 2.0, EPA, EU) | +1.1% | Global, regulatory focus in North America and EU | Short term (≤ 2 years) |
| Source: Mordor Intelligence | |||
Digital-twins-enabled Predictive Maintenance
Global majors now pair cloud-hosted twins with edge analytics to pre-empt pump, compressor, and turbine failures. Saudi Aramco trimmed power needs 18% and slashed inspection times 40% at Khurais by embedding thousands of sensors linked to AI models.[1]Saudi Aramco, “数字化油气行业及油田技术创新,” ARAMCO.COM Rotating equipment downtime, historically costing millions of USD per day, is falling as operators schedule repairs based on anomaly scores instead of calendar intervals. Adoption spreads fastest in offshore assets where logistics costs multiply unscheduled stoppages. Because these projects demand multi-physics simulation, vendors that bundle sensors with modeling software gain cross-sell leverage. Early ROI evidence is shifting budget lines from time-based to condition-based maintenance, locking in long-term demand for resilient, self-diagnosing devices.
Rising Demand for Integrated Safety-Instrumented Systems
IEC 61511 compliance now favors unified platforms that converge gas, flame, and shutdown loops. MSA’s S5000 detector, locally assembled in Saudi Arabia, extends calibration intervals to two years while retaining SIL 2 certification.[2]Oil & Gas News, “MSA improves workers’ safety with local gas detectors,” OGNNEWS.COM Operators report fewer site visits and faster startup testing when disparate safety layers run over a common protocol. Investment momentum is highest in refineries and LNG plants undergoing debottlenecking, as tying safety to real-time alarms satisfies both insurers and regulators. Solution providers with local build centers speed up hazardous-area approvals, a decisive advantage in Gulf states mandating in-country value. Heightened risk awareness after recent flaring incidents further cements budget priority for expandable safety backbones that scale with brownfield expansions.
Acceleration of Deep-water and Subsea Projects Post-COVID
Deferred FIDs are now closing, reviving demand for sensors rated beyond 1,000 bar. Shell’s 2024 pact with Baker Hughes on the VitalyX platform underscores operators’ appetite for analytics-ready subsea instrumentation that ships with dual redundancy and digital redundancy paths for 25-year life cycles. Survivability in wide thermal windows pushes suppliers toward silicon-on-insulator MEMS and exotic alloy housings. Because topside bandwidth is scarce, embedded microcontrollers preprocess high-frequency vibration and chemistry signals before uplink, cutting data loads by up to 70%. Early adopters in Brazil and Norway confirm that such architectures cut ROV intervention trips, shaving OPEX by low‐single-digit percentages annually. As subsea production moves to remote power hubs, the business case for autonomous, AI-enabled sensors scales quickly.
Increasing Shale Automation in North America
Permian operators now deploy measurement-while-drilling arrays linked to cloud geosteering engines that recalibrate bit trajectory in seconds. Fiber-optic DAS strings log fracture hits along laterals, letting engineers taper proppant schedules on the fly. University of New Mexico prototypes achieved 5 ppm methane detection with 97% classification accuracy in field pilots, illustrating how academia accelerates cost-effective leak monitoring.[3]University of New Mexico, “Solid-State Mixed-Potential Electrochemical Sensors,” DOI.ORG Tight-budget independents adopt edge devices with subscription analytics to bypass capex cycles, supporting broader fleet adoption. As pad drilling intensifies, drill-to-mill sensors extend to artificial lift gearboxes, creating a contiguous data thread from spud to abandonment.
Restraints Impact Analysis*
| Restraint | (~) % Impact on CAGR Forecast | Geographic Relevance | Impact Timeline |
|---|---|---|---|
| Volatility in upstream CAPEX cycles | -0.9% | Global, particularly pronounced in North America shale plays | Short term (≤ 2 years) |
| Cyber-security vulnerabilities in wireless sensor networks | -0.6% | Global, heightened concern in critical infrastructure regions | Medium term (2-4 years) |
| Scarcity of IECEx-certified component suppliers | -0.4% | Global, most acute in emerging markets | Medium term (2-4 years) |
| Harsh-environment survivability limits for MEMS | -0.3% | Subsea, Arctic, and high-temperature applications globally | Long term (≥ 4 years) |
| Source: Mordor Intelligence | |||
Volatility in Upstream CAPEX Cycles
Sensor rollouts often sit at the mercy of commodity swings. During 2020-2023 price dips, many independents trimmed instrumentation budgets by up to 25%, deferring brownfield upgrades until WTI stabilized above USD 70/bbl. Because sensors in oil and gas market growth relies on multi-year programs, turbulence hampers volume ramps for new platforms, elongating supplier breakeven horizons. Larger IOCs shield projects by rolling OPEX into digital transformation line items, yet even they staged procurement in phases to preserve cash. Vendors counteract by offering leasing models and outcome-based contracts that spread costs, but uptake remains uneven across regions.
Cyber-security Vulnerabilities in Wireless Sensor Networks
Expanding attack surfaces attract sophisticated adversaries targeting operational technology. Incidents surged 70% between 2020 and 2023, spurring North American pipeline operators to adopt zero-trust architectures and IEC 62443 assessments. Patch management complicates remote well pads where bandwidth drops below 256 kbps. Insurance underwriters now factor cyber posture into premiums, nudging asset owners to invest in encrypted protocols and endpoint detection. Nonetheless, talent shortages in OT security impede rollout speed, especially among NOC-led ventures in developing economies.
*Our forecasts treat driver/restraint impacts as directional, not additive. The impact forecasts reflect baseline growth, mix effects, and variable interactions.
Segment Analysis
By Sensor Type: Pressure Dominates Amid Ultrasonic Innovation
Pressure devices owned 26.35% of 2025 revenue, underscoring their omnipresence from wellhead choke monitoring to custody transfer skids across the sensors in oil and gas market. Ultrasonic meters, while smaller in base, are expanding at 6.5% CAGR as non-intrusive designs cut maintenance and simplify calibration loops, a critical advantage in LNG and multiphase pipelines. Temperature, flow, and level instruments maintain stable trajectories, protected by their foundational role in mass-energy balance calculations. Vibration sensors enjoy renewed interest as predictive maintenance programs proliferate, while multi-gas arrays ride emissions mandates.
Buyers increasingly favor consolidated transducer suites that blend pressure, temperature, and vibration into one housing, shrinking penetration points and lowering fugitive emission risks. Suppliers respond with ASIC-based signal chains that linearize multiple elements simultaneously, slashing drift across a 10-year horizon. For remote heads, battery-optimized MEMS pressure cells now boast sub-1 µA sleep currents, extending field life beyond five years in wireless nodes. Integrators leverage these gains to present unified dashboards, easing correlation of process excursions and chronic equipment fatigue in a single pane of glass.


By Connectivity: Wireless Transformation Accelerates
Although wired backbones still represent 71.10% of installed endpoints, wireless nodes are climbing at a 7.12% CAGR, double the baseline sensors in oil and gas market growth. Operators prioritize WirelessHART and ISA100 mesh topologies for brownfield retrofits where trenching costs eclipse sensor outlays. Early 5G private networks in Gulf mega-refineries showcase deterministic latency under 5 ms, enabling closed-loop control in non-critical loops.
Battery chemistry strides plus energy harvesting cut maintenance truck rolls; smart power management extends node duty cycles from months to years. Security remains the gating factor, yet chip-level root-of-trust modules paired with over-the-air firmware updates now satisfy IEC 62443 auditors. As real-time location services piggy-back on the same spectrum, operators gain dual workforce safety benefits without extra infrastructure. These combined advantages underpin wireless’ climb from edge monitoring to core control layers by the decade’s close.
By Activity: Midstream Momentum Builds
Upstream still anchors 46.20% of 2025 takings, reflecting heavy drilling activity and reservoir complexity. Completions technology relies on acoustic and pressure sensors resilient to sand erosion and 25,000 psi bursts, reinforcing the segment’s baseline demand. Yet pipeline operators are signing multi-year integrity monitoring contracts that lift midstream revenue at a 6.92% CAGR, outpacing the total sensors in oil and gas market.
Regulators stipulate high-frequency leak surveys, prompting adoption of distributed fiber optics and airborne laser systems integrated with ground-based nodes. Compression stations add vibration and emissions arrays, enabling predictive repair of dry-gas seals. Storage terminals digitalize floating roof tank gauging to curb slop losses, driving level and radar orders. Downstream retains steady spending for process optimization and flaring control, but incremental gains pale beside midstream’s infrastructure boom in Asia and South America
By Application: Safety Systems Lead Growth
Process safety and emergency shutdown solutions captured 34.35% of 2025 billings, underscoring the life-critical priorities that govern procurement in hazardous plants. Because insurance premiums tie directly to incident metrics, SIL-rated sensors offer quantifiable ROI. Emissions monitoring, however, now traces the steepest curve at 6.6% CAGR as carbon pricing spreads across jurisdictions, inserting continuous methane detection clauses into operating licenses.
Pipeline monitoring capitalizes on machine-learning pattern recognition, flagging pressure waves indicative of third-party strikes within seconds. Drilling optimization platforms integrate downhole acoustics with surface torque-and-drag sensors, unlocking drilling performance indexes that shorten vertical sections by double-digit percentages. Cross-application synergies emerge as edge AI engines process safety and environmental data concurrently, reducing hardware overhead while raising situational awareness. Vendors that map these convergent use cases stand to gain outsized wallet share per facility.
Geography Analysis
North America held 38.40% of 2025 revenue, reflecting shale’s appetite for real-time formation and production data and strict EPA leak rules that elevate advanced gas sensing. U.S. supermajors spearhead enterprise-wide digital rollouts, while Canadian operators retrofit oil-sands upgraders with extreme-cold pressure and level instruments. Mexico’s liberalized acreage adds selective demand, tempered by financing hurdles and pipeline bottlenecks.
Asia-Pacific is the sensors in oil and gas market’s fastest-rising arena at 6.95% CAGR, buoyed by China’s policy to embed intelligent sensing across new green- and brownfield facilities and India’s refinery upgrades that require Ethernet-APL-ready instrumentation. LNG import terminals in Indonesia and the Philippines adopt custody-transfer ultrasonic meters to cut imbalance disputes. Vietnam’s 2024 digital plan for energy vaults entails 90% online permitting, indirectly stimulating sensor procurement for live data feeds.
Europe sustains moderate gains as North Sea operators grapple with aging platforms that demand high-spec vibration and corrosion solutions. EU Green Deal legislation cements the switch to continuous emissions monitoring, widening addressable spend. Middle East producers embrace lighthouse refinery concepts, proven by Aramco facilities that showcase 18% energy savings via dense sensor grids. Africa’s nascent basins weigh in with greenfield orders that leapfrog legacy hard-wired layouts in favor of wireless-first, edge-analytics designs, preparing their assets for long-term carbon accountability regimes.

Competitive Landscape
Market concentration sits in the mid-range: Honeywell, Emerson, ABB, and Siemens together account for under half of 2024 turnover, leveraging global repair hubs, end-to-end suites, and deep certification queues. They emphasize lifecycle contracts that bundle sensors, analytics, and remote condition monitoring, an attractive proposition for resource-constrained NOCs. Multinational incumbents also co-invest in regional assembly, Honeywell’s USD 1.81 billion LNG equipment acquisition broadened its cryogenic sensing catalog and fortified its installed base in Qatar and the U.S. Gulf Coast.
Challenger firms carve footholds by specializing. Sensirion’s optical methane nodes received EPA equivalency, validating newcomer technology in a compliance-critical niche.[4]Sensirion Connected Solutions, “Overview,” SENSIRION-CONNECTED.COM Blackline Safety’s EXO 8 added gamma detection to portable hubs, capturing emergency response budgets. Academic-industry consortia like the University of New Mexico’s electrochemical sensor project inject disruptive IP into the product pipeline, particularly where ultra-low PPM sensitivity is mandatory. Edge-AI software startups partner with hardware OEMs to supply firmware-level anomaly detection, shortening time-to-market for integrated offerings.
Barriers to entry remain material: IECEx audits, safety integrity certification, and after-sales footprints deter pure-play software firms without hardware lineage. Yet operators’ push for open standards pries open proprietary ecosystems, encouraging modular platforms that let buyers mix best-of-breed transducers. Consequently, competitive dynamics hinge on who masters secure data orchestration across multivendor fleets rather than on transducer specs alone.
Sensors In Oil And Gas Industry Leaders
Honeywell International Inc
TE Connectivity Ltd
Robert Bosch GmbH
ABB Ltd
Siemens AG
- *Disclaimer: Major Players sorted in no particular order


Recent Industry Developments
- May 2025: Cubic Sensor showcased a full upstream-to-downstream portfolio at SENSOR+TEST 2025, highlighting ultrasonic and TDLAS modules.
- April 2025: Sensirion Connected Solutions won U.S. EPA approval for its Nubo Sphere wireless methane monitor, cementing regulatory confidence in IoT emissions platforms.
- January 2025: Saudi Aramco’s North Ghawar plant joined the World Economic Forum lighthouse network for large-scale Industry 4.0 adoption.
- November 2024: TotalEnergies began fleet-wide deployment of continuous methane sensors to meet its target of halving emissions by 2030.


Global Sensors In Oil And Gas Market Report Scope
The oil and gas industry operates in a very volatile environment. The oil price fluctuations and the industry's digitization boom have driven the demand for innovation and investment to meet the cost, ease the cost, and optimize the industry's operations. Thus, deploying the sensors is crucial for monitoring specific parameters for the safety and optimization of processes in the oil and gas industry. Wireless sensors are widely used for this due to their low cost, ease of deployment, flexibility, and convenience of operation.
The oil and gas sensors market is segmented by sensor type (gas sensor, temperature sensor, ultrasonic sensor, pressure sensor, flow sensor, level sensor, other sensor types), connectivity (wired, wireless), activity (upstream, midstream, downstream), and geography (North America, Europe, Asia-Pacific, Latin America, Middle East, and Africa). The market sizes and forecasts are provided in terms of value in USD for all the above segments.
| Gas |
| Temperature |
| Ultrasonic |
| Pressure |
| Flow |
| Level |
| Vibration |
| Wired |
| Wireless |
| Upstream |
| Midstream |
| Downstream |
| Process Safety and ESD |
| Pipeline Monitoring |
| Drilling Optimization |
| Emissions Monitoring |
| North America | United States | |
| Canada | ||
| Mexico | ||
| South America | Brazil | |
| Argentina | ||
| Rest of South America | ||
| Europe | United Kingdom | |
| Germany | ||
| France | ||
| Italy | ||
| Spain | ||
| Netherlands | ||
| Rest of Europe | ||
| Asia-Pacific | China | |
| Japan | ||
| South Korea | ||
| India | ||
| ASEAN | ||
| Rest of Asia-Pacific | ||
| Middle East and Africa | Middle East | Saudi Arabia |
| United Arab Emirates | ||
| Turkey | ||
| Rest of Middle East | ||
| Africa | South Africa | |
| Nigeria | ||
| Kenya | ||
| Rest of Africa | ||
| By Sensor Type | Gas | ||
| Temperature | |||
| Ultrasonic | |||
| Pressure | |||
| Flow | |||
| Level | |||
| Vibration | |||
| By Connectivity | Wired | ||
| Wireless | |||
| By Activity | Upstream | ||
| Midstream | |||
| Downstream | |||
| By Application | Process Safety and ESD | ||
| Pipeline Monitoring | |||
| Drilling Optimization | |||
| Emissions Monitoring | |||
| By Geography | North America | United States | |
| Canada | |||
| Mexico | |||
| South America | Brazil | ||
| Argentina | |||
| Rest of South America | |||
| Europe | United Kingdom | ||
| Germany | |||
| France | |||
| Italy | |||
| Spain | |||
| Netherlands | |||
| Rest of Europe | |||
| Asia-Pacific | China | ||
| Japan | |||
| South Korea | |||
| India | |||
| ASEAN | |||
| Rest of Asia-Pacific | |||
| Middle East and Africa | Middle East | Saudi Arabia | |
| United Arab Emirates | |||
| Turkey | |||
| Rest of Middle East | |||
| Africa | South Africa | ||
| Nigeria | |||
| Kenya | |||
| Rest of Africa | |||


Key Questions Answered in the Report
What is the forecast value for global sensor deployments in oil and gas by 2031?
The sensors in oil and gas market is projected to reach USD 14.77 billion by 2031.
Which region is expected to grow fastest?
Asia-Pacific leads with a 6.95% CAGR through 2031, driven by refinery expansions and digital mandates.
Which sensor type is expanding most quickly?
Ultrasonic devices are forecast to grow at 6.5% CAGR due to their non-invasive flow measurement capability.
Why are wireless networks gaining traction?
Wireless nodes offer flexible retrofits, lower cabling costs, and now meet security and latency standards suitable for critical monitoring.
How are emissions regulations influencing adoption?
New methane-leak mandates require continuous monitoring, accelerating demand for advanced optical and electrochemical sensors.
Page last updated on:


