Virtual Prototype Market Size and Share
Market Overview
| Study Period | 2019 - 2030 |
|---|---|
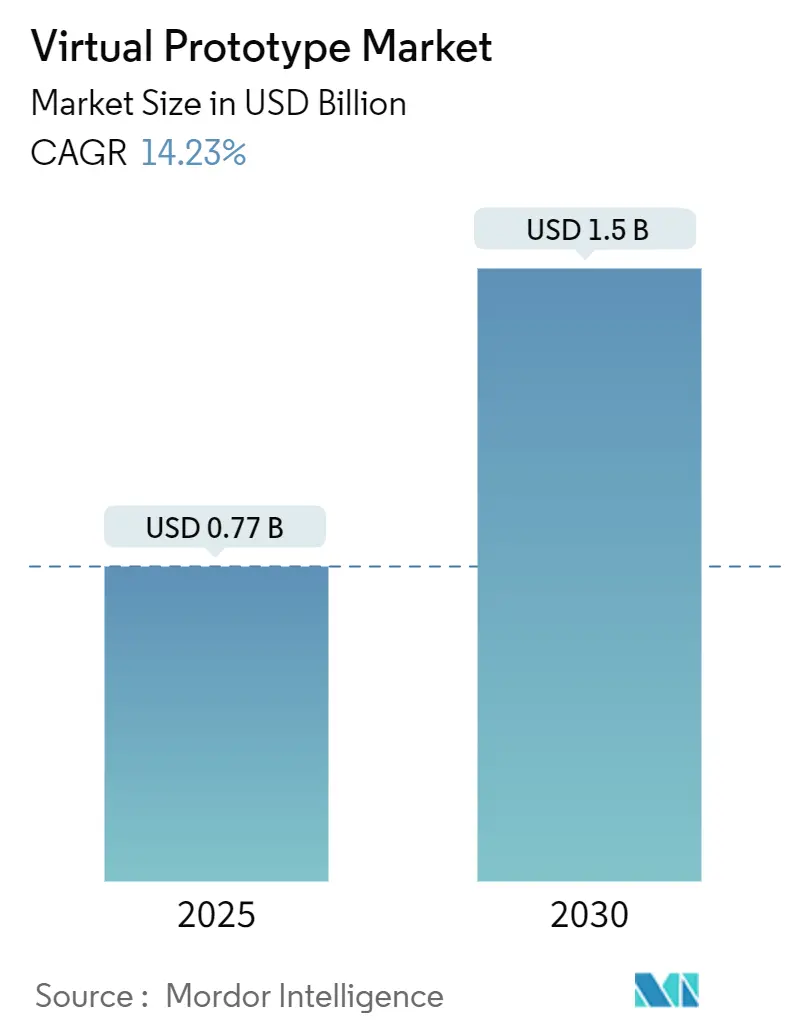
| Market Size (2025) | USD 0.77 Billion |
| Market Size (2030) | USD 1.5 Billion |
| Growth Rate (2025 - 2030) | 14.23% CAGR |
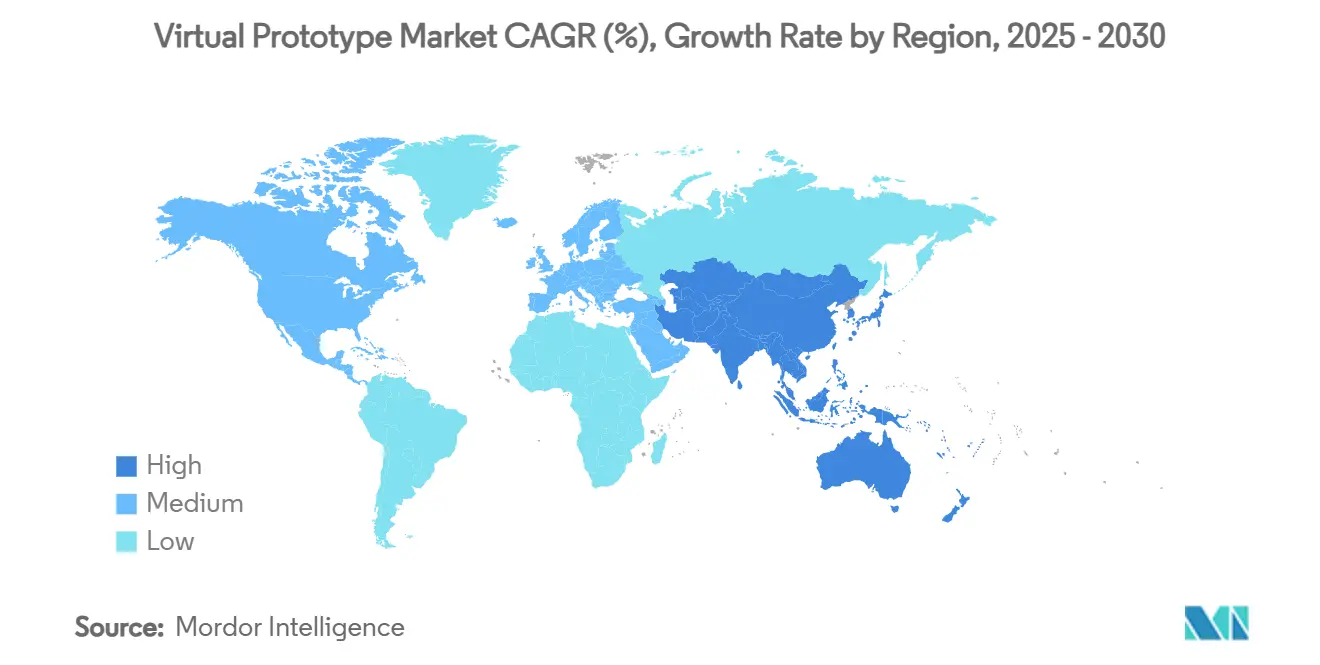
| Fastest Growing Market | Asia Pacific |
| Largest Market | North America |
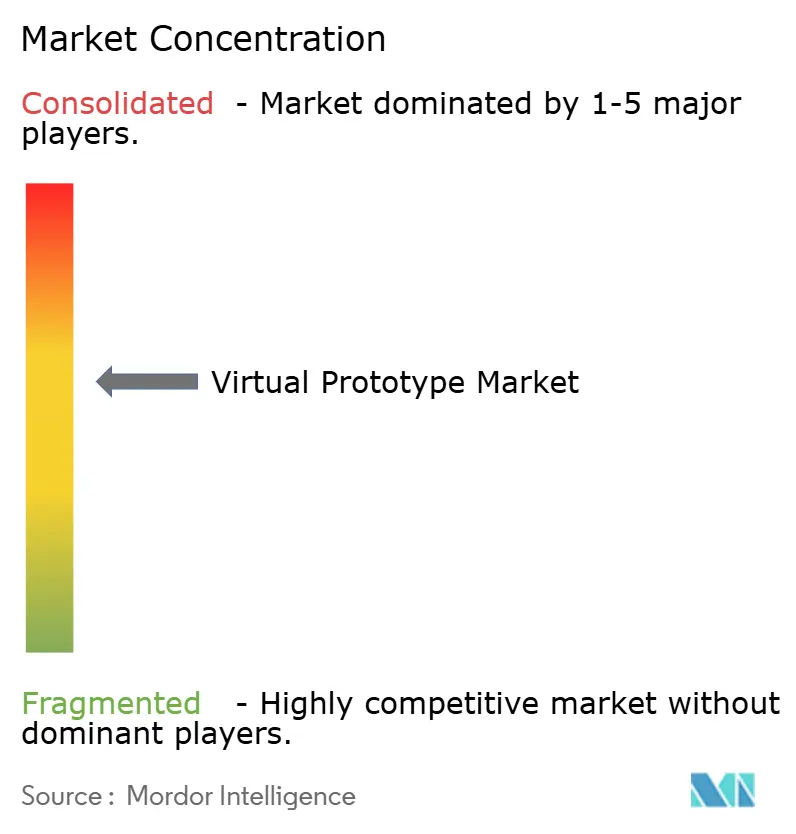
| Market Concentration | Medium |
Major Players *Disclaimer: Major Players sorted in no particular order Image © Mordor Intelligence. Reuse requires attribution under CC BY 4.0. | |
Virtual Prototype Market Analysis by Mordor Intelligence
The virtual prototype market size stood at USD 0.77 billion in 2025 and is forecast to reach USD 1.50 billion by 2030, advancing at a 14.23% CAGR over the period. Sustained demand for accurate digital twins that trim physical-prototype expenditures, first-time-right silicon mandates, and electric-vehicle thermal challenges underpin this expansion.[1]Synopsys, “Virtual Prototyping Pre-Silicon Verification,” synopsys.comAutomotive, semiconductor, and healthcare innovators are aligning simulation investments with software-defined product roadmaps, channeling budgets toward model-based systems engineering (MBSE) platforms that collapse multi-physics workflows into shared data environments. Cloud elasticity is augmenting on-premise high-performance computing (HPC) clusters, but concerns over IP sovereignty still tether critical workloads to enterprise data centers. Meanwhile, artificial-intelligence (AI) enhancement of physics solvers is compressing iteration cycles, allowing engineers to explore wider design envelopes without overshooting project milestones.
Key Report Takeaways
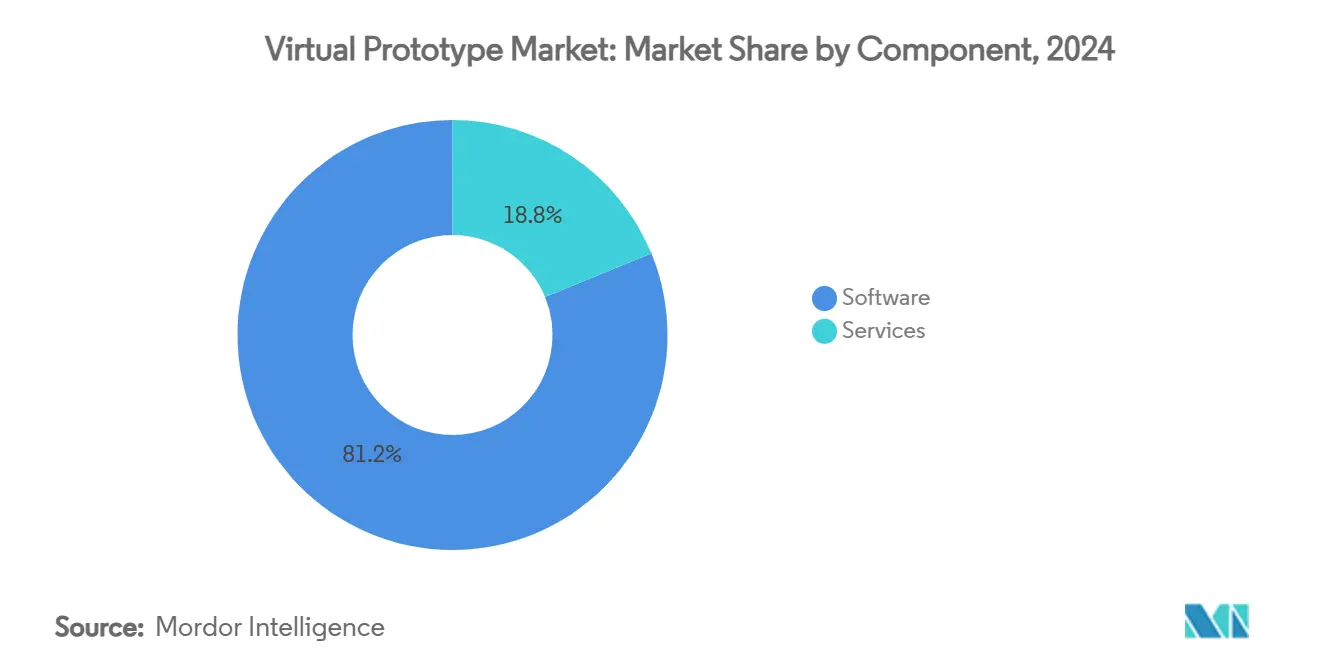
- By component, software led with 81.2% revenue share in 2024, whereas services are projected to expand at a 15.7% CAGR through 2030.
- By deployment, on-premise accounted for 68.1% of the virtual prototype market share in 2024, while cloud solutions are growing at a 16.1% CAGR through 2030.
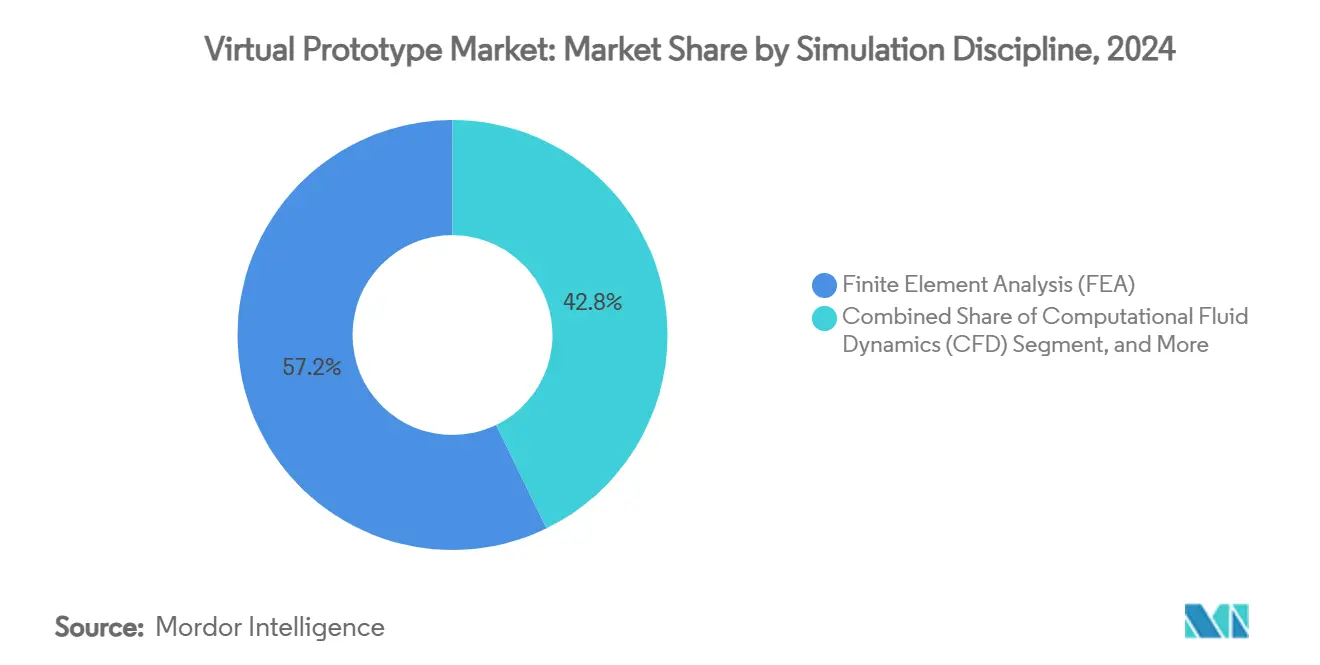
- By simulation discipline, finite-element analysis secured a 57.2% share of the virtual prototype market size in 2024; computational fluid dynamics is advancing at a 15.3% CAGR to 2030.
- By end-use industry, automotive and transportation contributed 32.4% of 2024 revenues, whereas healthcare and medical devices exhibit the fastest trajectory at 14.4% CAGR through 2030.
- By geography, North America dominated with 37.1% market share in 2024, yet Asia-Pacific is set to climb at a 14.8% CAGR during the forecast period.
Global Virtual Prototype Market Trends and Insights
Drivers Impact Analysis*
| Driver | (~) % Impact on CAGR Forecast | Geographic Relevance | Impact Timeline |
|---|---|---|---|
| Cutting physical-prototype cost and time | +3.2% | Global, strongest in North America & Europe | Medium term (2-4 years) |
| Shift toward software-defined vehicles | +2.8% | Global, led by North America & Asia-Pacific automotive hubs | Long term (≥ 4 years) |
| Rapid MBSE adoption | +2.1% | North America & Europe aerospace–defense | Medium term (2-4 years) |
| First-time-right silicon demand | +1.9% | Asia-Pacific core, spill-over to North America | Short term (≤ 2 years) |
| Edge-AI driven real-time digital twins | +1.7% | Global, early uptake in manufacturing-intensive regions | Long term (≥ 4 years) |
| Sustainability-linked virtual twins | +1.4% | Europe & North America, expanding into Asia-Pacific | Long term (≥ 4 years) |
| Source: Mordor Intelligence | |||
Growing need to cut physical-prototype cost and time
Automotive OEMs now invest more than USD 2 million per complete vehicle mule, while a single semiconductor tape-out may exceed USD 50 million if iterative respins are required. Virtual prototypes remove 70–80% of that spend and shave 6–12 months off program calendars, a benefit demonstrated when Volkswagen’s Nivus project was executed entirely in silico, trimming 10 months of development and saving multimillion-dollar prototype budgets. Enterprises therefore channel capital toward scalable simulation licenses and HPC capacity rather than physical test rigs, accelerating adoption across mobility, consumer electronics, and heavy equipment.
Shift toward software-defined vehicles and SDV platforms
A modern autonomous car may integrate up to 1 billion lines of code, a scale that renders traditional hardware-centric validation untenable. Virtual environments now orchestrate continuous integration and over-the-air update scenarios, verifying cybersecurity patches and new functions before vehicles reach customers. BMW’s collaboration with Dassault Systèmes on digital twins illustrates how automakers prioritize cloud-enabled collaboration that keeps designers, software teams, and supply-chain partners in sync. As software determines differentiation in electric and autonomous platforms, virtual prototype market participation deepens across Tier 1 suppliers and mobility start-ups.
Rapid adoption of model-based systems engineering (MBSE)
MBSE replaces document-centric workflows with interconnected system models that auto-propagate change across mechanical, electrical, and software artefacts, cutting integration rework and late-cycle surprises. Lockheed Martin’s F-35 program illustrates scalability, coordinating thousands of subsystems within a unified digital thread that mitigates configuration drift. Pairing MBSE with real-time digital twins closes the loop between design intent and field performance, enabling continuous certification and predictive maintenance.
Demand for first-time-right silicon in chip design
AI accelerators, neuromorphic devices, and chiplet-based architectures make post-fab respins prohibitively expensive, escalating the premium on exhaustive pre-silicon verification. Hardware-assisted emulators and transaction-level models allow firmware teams to begin coding months before silicon tape-out, slashing schedule risk. Cloud-hosted emulation farms such as ZeBu Cloud grant on-demand capacity that smaller design houses could not previously afford, broadening the virtual prototype market to fabless start-ups.
Restraints Impact Analysis*
| Restraint | (~) % Impact on CAGR Forecast | Geographic Relevance | Impact Timeline |
|---|---|---|---|
| High initial licensing and HPC costs | -2.4% | Global, greatest burden in emerging markets | Short term (≤ 2 years) |
| IP-security concerns in cloud collaboration | -1.8% | Global, acute in defense and semiconductor segments | Medium term (2-4 years) |
| Shortage of multi-domain simulation talent | -1.6% | North America & Europe, increasingly felt in Asia-Pacific | Long term (≥ 4 years) |
| Fragmented data standards | -1.2% | Global, amplified in manufacturing-centric economies | Medium term (2-4 years) |
| Source: Mordor Intelligence | |||
High initial licensing and HPC compute costs
Annual seat licenses for flagship multi-physics suites can surpass USD 500,000, while enterprise-scale HPC clusters often demand USD 10 million outlays.[2]Lenovo Press, “On-Premise vs Cloud TCO,” lenovopress.lenovo.com Such capital intensity sidelines small and medium enterprises (SMEs). Although cloud platforms lower entry barriers, always-on workloads may incur 3–5 times higher operating expense than amortized on-premise clusters, tempering adoption among cash-constrained innovators.
IP-security concerns in cloud collaboration
Design files embody the competitive edge for defense primes and fabless chipmakers. Even with virtual private clouds and air-gapped environments, organizations remain wary of jurisdictional exposure and insider risk. Compliance audits and sovereign-cloud offerings are expanding, yet critical sign-off simulations often stay on local infrastructure, slowing broader cloud shift within the virtual prototype market.
*Our forecasts treat driver/restraint impacts as directional, not additive. The impact forecasts reflect baseline growth, mix effects, and variable interactions.
Segment Analysis
By Component: Services Close the Gap on Software Dominance
Software commanded 81.2% of 2024 revenues, a reflection of the intellectual property locked into solvers, meshing algorithms, and optimization engines that anchor long-term customer relationships. Subscription models guarantee recurrent income streams and fund continuous feature releases, reinforcing vendor lock-in. Services, however, are climbing at a 15.7% CAGR as enterprises confront steep learning curves around MBSE, digital-twin orchestration, and AI-assisted optimization. Consulting engagements for workflow automation and solver customization deepen vendor entrenchment and create high switching costs. The virtual prototype market size for services is projected to eclipse USD 0.45 billion by 2030, underlining the shift from pure license sales to outcome-centric partnerships. SMEs increasingly outsource simulation tasks to managed-service providers that bundle software access with cloud computing resources, avoiding large capital commitments.
Robust services growth also reflects acute talent shortages; enterprises rely on vendor specialists to integrate cross-discipline solvers into unified data backbones. Implementation teams routinely map MBSE frameworks onto existing PLM systems, ensuring bidirectional traceability between requirements, test artefacts, and certification dossiers. As AI begins to automate meshing and parameter sweeps, service providers pivot toward higher-value activities such as physics-informed neural-network training and sustainability scenario modeling. This evolution positions the services segment as the fulcrum for competitive differentiation within the virtual prototype industry.


By Deployment Model: Hybrid Strategies Dominate
On-premise infrastructure retained 68.1% share of the virtual prototype market in 2024, driven by regulatory mandates and IP-sensitive workloads in aerospace and semiconductor domains. Greenfield programs still procure clustered CPU-GPU nodes to guarantee deterministic throughput for multi-month campaign runs. Nonetheless, cloud-native deployments are rising at 16.1% CAGR, fueled by elastic burst-capacity needs and the gigawatt-scale power budgets of generative-AI design spans. The virtual prototype market size attributed to cloud usage will near USD 0.7 billion by 2030 as consumption-based pricing attracts start-ups and academia.
organisations keep baseline solvers local for nightly builds while dispatching stochastic design-exploration jobs to hyperscale facilities during peak demand. Provider offerings such as Virtualizer Native Execution on Arm hardware integrate directly with CI/CD pipelines, further blurring boundaries between software engineering and physics validation. Security certifications, sovereign-cloud availability, and transparent cost-governance dashboards will dictate the velocity of future cloud adoption across the virtual prototype market.
By Simulation Discipline: CFD Narrows the Gap with FEA
Finite-element analysis held a 57.2% revenue lead in 2024, underpinned by structural integrity and durability validation across automotive, aerospace, and heavy machinery. Meanwhile, computational fluid dynamics is sprinting at 15.3% CAGR as electrified-powertrain thermal design, battery pack cooling, and 5G antenna optimisation escalate flow-simulation requirements. AI-accelerated solvers from partnerships such as Ansys-NVIDIA have slashed CFD run times, making parametric sweeps feasible within standard sprint cycles.
Electromagnetic, vibrations, and multiphase-flow models are increasingly co-simulated to capture coupled phenomena that single-physics tools overlook. Consequently, the virtual prototype market share of integrated multi-physics platforms is expanding as end-users select unified environments over point solutions. Vendor roadmaps emphasise automatic domain coupling and AI-guided solver selection to lower specialist barriers and broaden addressable user bases.

By End-Use Industry: Healthcare Surges Beyond Early Adopters
Automotive and transportation accounted for 32.4% of total 2024 spending, reflecting entrenched practices in crashworthiness, aerodynamics, and software-defined vehicle validation. Yet regulatory momentum in health technology is propelling the medical-device segment at a 14.4% CAGR. The US FDA’s 2024 guidance that formalised computational modelling credibility has legitimised in-silico evidence within 510(k) submissions, shortening bench-testing schedules and accelerating time-to-clinic.[3]U.S. FDA, “Computational Modeling Credibility Guidance,” fda.gov
Digital twins extend beyond implant design into hospital operations, where patient-specific cardiovascular models support surgical planning and personalised therapy regimens. Semiconductor and electronics remain a stable growth pillar as AI chips integrate exotic materials and advanced packaging that demand holistic electro-thermal-mechanical co-simulation. Aerospace and defence usage consolidates around MBSE-driven platform design, while industrial machinery, telecom, and consumer goods sectors constitute a nascent but rising wave of adopters experimenting with network digital-twin technologies for 5G roll-outs.
Geography Analysis
North America controlled 37.1% of global revenue in 2024, anchored by Detroit’s automotive cluster, Silicon Valley fabless chipmakers, and long-standing defence procurement programmes that institutionalised virtual validation. The region maintains a robust venture-funding pipeline for simulation start-ups and benefits from extensive university–industry collaborations. A steady influx of MBSE projects ensures stable demand across public- and private-sector initiatives.
Asia-Pacific is the fastest riser, forecast to climb at 14.8% CAGR through 2030 as China drives semiconductor self-sufficiency plans and India scales digital-engineering competencies for its expanding vehicle platform exports. Government incentives for smart manufacturing and aggressive renewable-energy roll-outs catalyse virtual-twin adoption across gigafactory, marine, and energy domains. The virtual prototype market size in Asia-Pacific is projected to overtake Europe post-2028, underscoring its strategic primacy for vendor go-to-market investments.
Europe retains its engineering pedigree in automotive and aerospace, leveraging strict sustainability regulations that mandate carbon-footprint optimisation through simulation before physical builds. OEMs deploy virtual twins to validate lightweighting strategies, battery-thermal envelopes, and flight-efficiency enhancements; Airbus’s 20,000-user immersion in the 3DEXPERIENCE environment typifies this scale. South America and the Middle East & Africa remain emerging territories-yet showcase pockets of rapid progress, such as advanced agri-machinery simulation in Brazil and energy-sector digital twins within Gulf petrochemical complexes-indicating a widening global footprint for the virtual prototype market.

Competitive Landscape
The virtual prototype market is moderately concentrated, with five leading vendors-Synopsys, Siemens Digital Industries Software, Dassault Systèmes, Hexagon, and Ansys-commanding close to 65% of 2024 revenues. M&A remains the primary vehicle for portfolio expansion; Synopsys’ USD 35 billion acquisition of Ansys and Siemens’ USD 10.6 billion purchase of Altair Engineering exemplify ecosystem consolidation targeting seamless chip-to-system workflows.
Strategic differentiation now pivots on AI-empowered optimisation, domain-specific accelerators, and cloud-agnostic licensing that lets customers bounce workloads across hybrid architectures. Dassault Systèmes leverages its PLM backbone to embed real-time MBSE artefacts, whereas cloud-native challenger SimScale courts SMEs with consumption-based pricing and a browser-first experience. Patent filings catalogued by IEEE reveal surging activity around physics-informed neural networks, automated adaptive meshing, and heterogeneous computing pipelines-signalling a competitive battleground anchored in AI-simulation convergence.
Interoperability standards, cybersecurity certifications, and domain-expert service networks evolve into de facto moats. Nonetheless, open-source solvers and university-incubated start-ups continue to nibble at niche verticals, especially in renewable-energy micro-grids and bio-pharma where bespoke physics models trump generic suites. Over the forecast horizon, strategic alliances between cloud hyperscalers and simulation vendors are expected to reshape pricing, procurement, and distribution across the virtual prototype industry.
Virtual Prototype Industry Leaders
Hexagon AB
Dassault Systèmes S.E.
Synopsys, Inc.
PTC Inc.
Autodesk, Inc.
- *Disclaimer: Major Players sorted in no particular order

Recent Industry Developments
- March 2025: Synopsys rolled out Virtualizer Native Execution on Arm hardware, unifying CI/CD pipelines with transaction-level models to cut validation time across automotive and IoT programs.
- February 2025: Dassault Systèmes and Volkswagen deployed the 3DEXPERIENCE platform for collaborative virtual-twin vehicle development.
- January 2025: Ansys, Kontrol, TÜV SÜD, and Microsoft launched a cloud-based virtual homologation toolchain to streamline automotive compliance.
- January 2025: Hexagon introduced VTDx, a cloud-native ADAS software test-automation platform harnessing hyperscale compute for scenario validation.


Global Virtual Prototype Market Report Scope
| Software |
| Services |
| On-premise |
| Cloud |
| Finite Element Analysis (FEA) |
| Computational Fluid Dynamics (CFD) |
| Multibody Dynamics (MBD) |
| Electromagnetic / Signal Integrity |
| Automotive and Transportation |
| Aerospace and Defense |
| Semiconductor and Electronics |
| Healthcare and Medical Devices |
| Industrial Machinery |
| Other End-Use Industries (Telecom, Consumer Goods) |
| North America | United States |
| Canada | |
| Mexico | |
| Europe | Germany |
| United Kingdom | |
| France | |
| Italy | |
| Spain | |
| Rest of Europe | |
| Asia-Pacific | China |
| Japan | |
| India | |
| South Korea | |
| Australia | |
| Rest of Asia-Pacific | |
| South America | Brazil |
| Argentina | |
| Rest of South America | |
| Middle East and Africa | Saudi Arabia |
| United Arab Emirates | |
| South Africa | |
| Egypt | |
| Rest of Middle East and Africa |
| By Component | Software | |
| Services | ||
| By Deployment Model | On-premise | |
| Cloud | ||
| By Simulation Discipline | Finite Element Analysis (FEA) | |
| Computational Fluid Dynamics (CFD) | ||
| Multibody Dynamics (MBD) | ||
| Electromagnetic / Signal Integrity | ||
| By End-Use Industry | Automotive and Transportation | |
| Aerospace and Defense | ||
| Semiconductor and Electronics | ||
| Healthcare and Medical Devices | ||
| Industrial Machinery | ||
| Other End-Use Industries (Telecom, Consumer Goods) | ||
| By Geography | North America | United States |
| Canada | ||
| Mexico | ||
| Europe | Germany | |
| United Kingdom | ||
| France | ||
| Italy | ||
| Spain | ||
| Rest of Europe | ||
| Asia-Pacific | China | |
| Japan | ||
| India | ||
| South Korea | ||
| Australia | ||
| Rest of Asia-Pacific | ||
| South America | Brazil | |
| Argentina | ||
| Rest of South America | ||
| Middle East and Africa | Saudi Arabia | |
| United Arab Emirates | ||
| South Africa | ||
| Egypt | ||
| Rest of Middle East and Africa | ||


Key Questions Answered in the Report
What is driving the double-digit CAGR of the virtual prototype market?
A synergy of cost pressure to eliminate physical prototypes, first-time-right silicon mandates, and growing reliance on real-time digital twins is propelling the market at a 14.23% CAGR.
Which segment is expanding the fastest within the virtual prototype market?
Cloud deployment leads growth at a 16.1% CAGR as organisations leverage elastic compute for design-space exploration while retaining sensitive sign-off simulations on-premise.
How large is the services opportunity in the virtual prototype industry?
Services are forecast to approach USD 0.45 billion by 2030 as enterprises seek specialised consulting for MBSE roll-outs, solver customisation, and AI-assisted optimisation.
Why is Asia-Pacific the most attractive growth geography?
Regional semiconductor self-sufficiency programs, automotive digitisation, and Industry 4.0 incentives are pushing Asia-Pacific toward a 14.8% CAGR, set to overtake Europe post-2028.
How are recent mega-mergers reshaping competition?
Synopsys–Ansys and Siemens–Altair tie-ups integrate chip, system, and HPC workflows, raising entry barriers and concentrating innovation around AI-enabled multi-physics platforms.
What regulatory change has accelerated healthcare adoption of virtual prototyping?
The US FDA’s 2024 credibility guidance validated in-silico evidence for medical device submissions, catalysing a 14.4% CAGR in the healthcare and medical-device segment.
Page last updated on:


