Product Prototyping Market Size and Share
Market Overview
| Study Period | 2020 - 2031 |
|---|---|
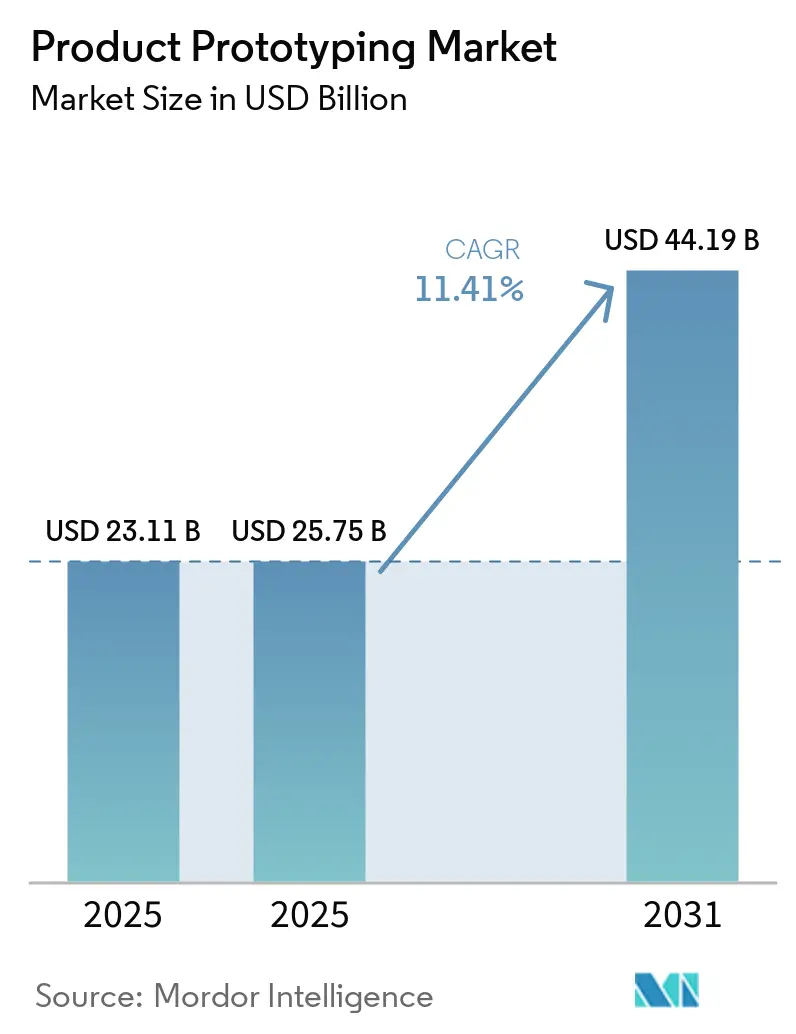
| Market Size (2025) | USD 25.75 Billion |
| Market Size (2031) | USD 44.19 Billion |
| Growth Rate (2026 - 2031) | 11.41% CAGR |
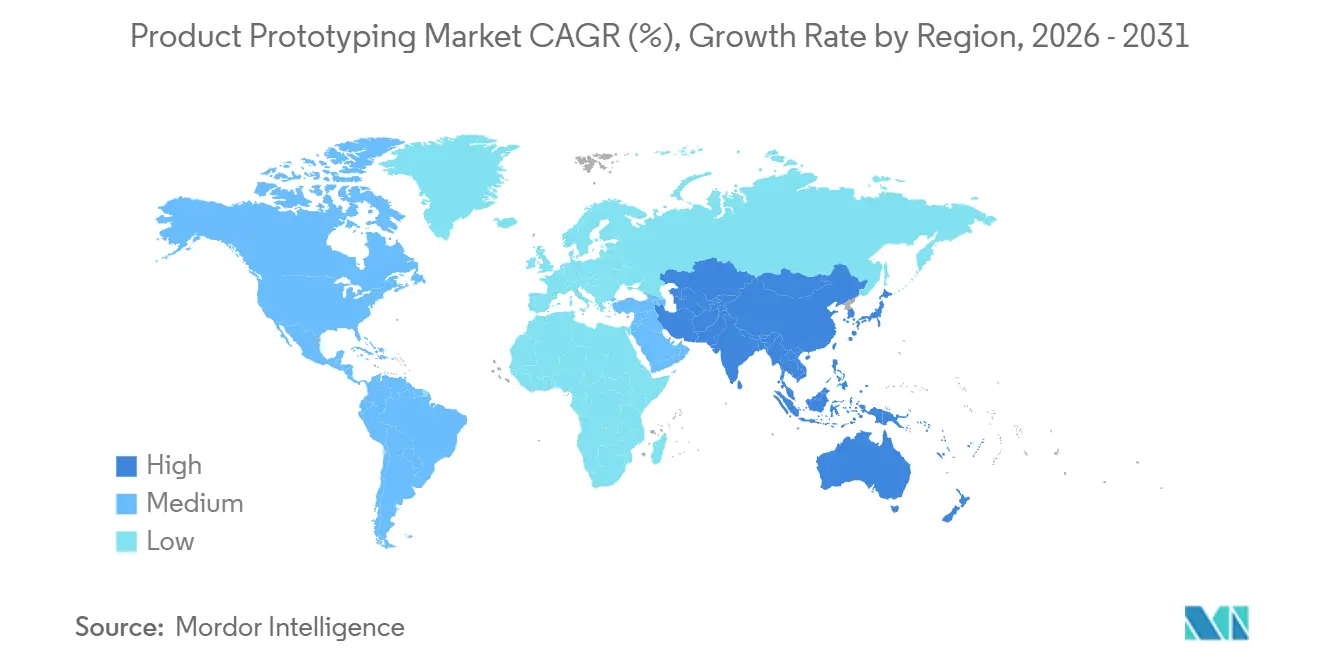
| Fastest Growing Market | Asia Pacific |
| Largest Market | North America |
| Market Concentration | Medium |
Major Players *Disclaimer: Major Players sorted in no particular order Image © Mordor Intelligence. Reuse requires attribution under CC BY 4.0. | |
Product Prototyping Market Analysis by Mordor Intelligence
The product prototyping market size is projected to expand from USD 23.11 billion in 2025 and USD 25.75 billion in 2026 to USD 44.19 billion by 2031, registering a CAGR of 11.41% between 2026 to 2031. Demand acceleration is closely tied to the convergence of cloud-based design platforms and declining additive-manufacturing costs, which together compress iteration cycles from weeks to days. Automotive, aerospace, and consumer-electronics producers now run concurrent hardware sprints that mirror agile software methods, using distributed supplier networks to balance speed with capital discipline. Venture funding into platform-orchestrated supply chains surpassed USD 600 million in 2025-2026, fueling instant-quoting engines and broadening access for small enterprises. Meanwhile, enterprises are reassessing vendor contracts as intellectual-property safeguards lag behind the realities of global file sharing.
Key Report Takeaways
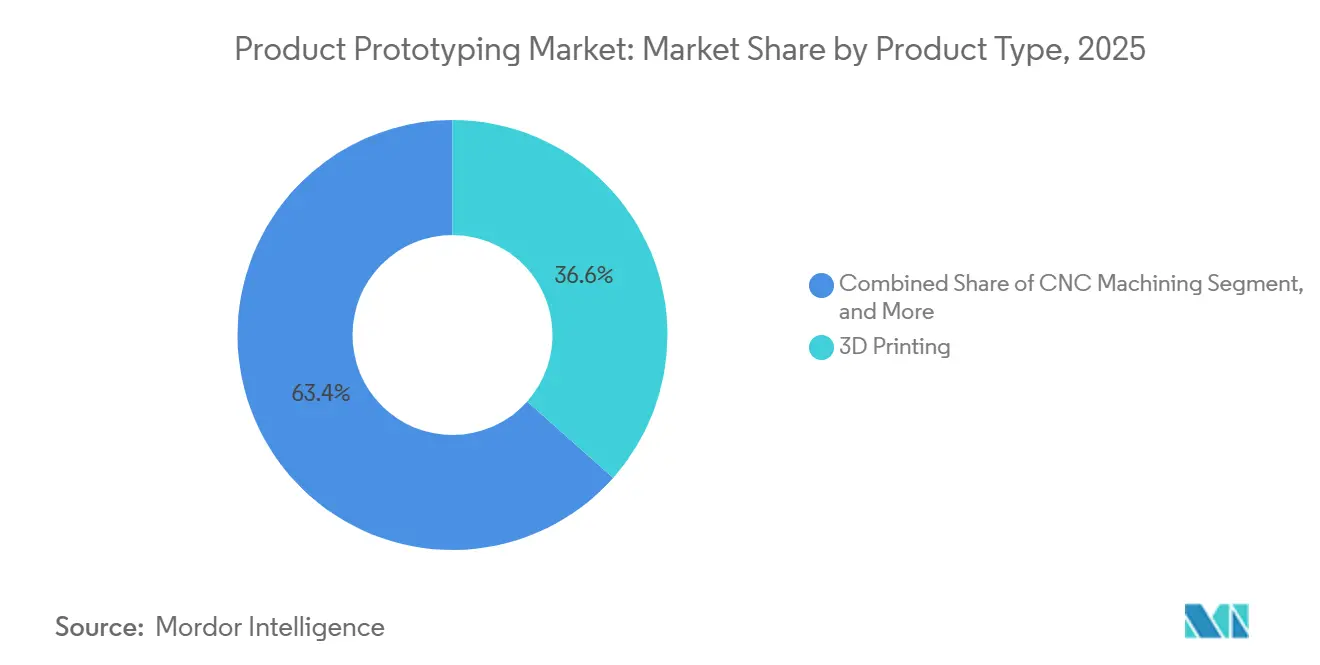
- By product type, 3D printing led with 36.57% of the product prototyping market share in 2025, while its segment revenue is projected to grow at an 11.64% CAGR through 2031.
- By material type, plastics accounted for 44.88% share of the product prototyping market size in 2025, whereas composites are expected to expand at an 11.67% CAGR to 2031.
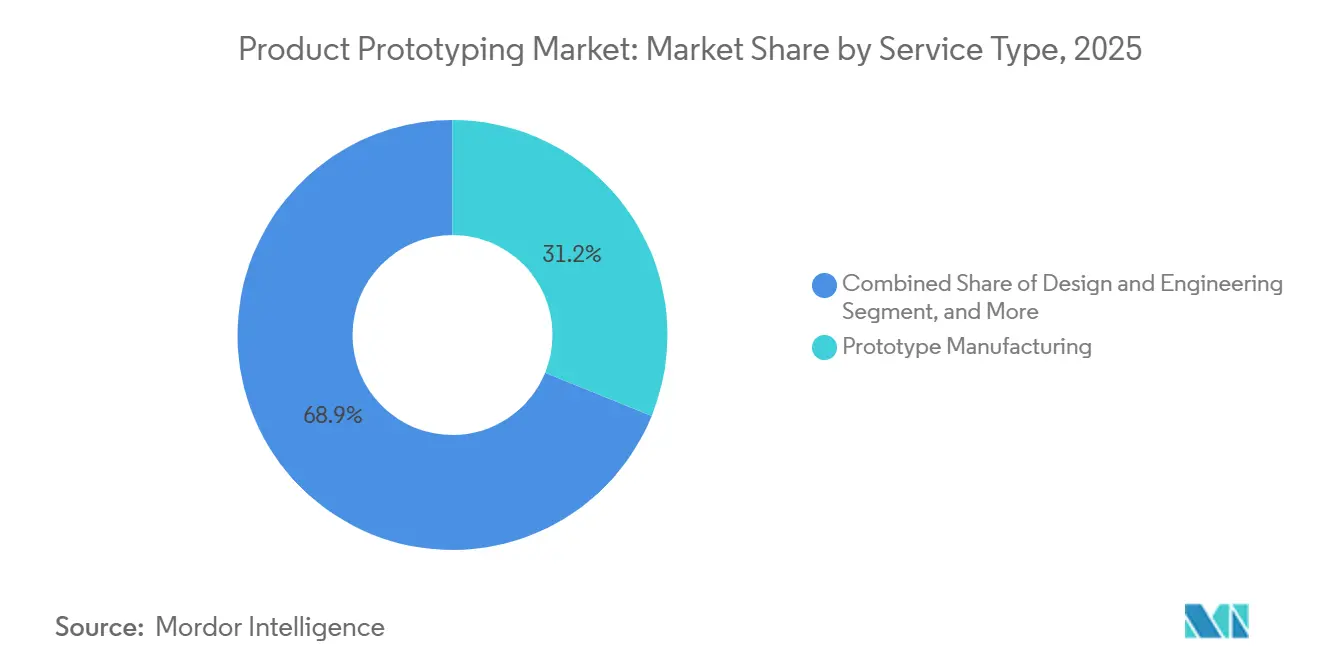
- By service type, prototype manufacturing captured 31.15% revenue in 2025, and functional testing is forecast to register an 11.56% CAGR over the same period.
- By end-use industry, automotive held 25.12% of 2025 revenue, while medical devices represent the fastest-growing vertical at an 11.67% CAGR through 2031.
- By geography, North America represented 30.18% of 2025 revenue, but Asia-Pacific is set to post a 12.11% CAGR, the highest among all regions.
Note: Market size and forecast figures in this report are generated using Mordor Intelligence’s proprietary estimation framework, updated with the latest available data and insights as of January 2026.
Global Product Prototyping Market Trends and Insights
Drivers Impact Analysis*
| Driver | (~) % Impact on CAGR Forecast | Geographic Relevance | Impact Timeline |
|---|---|---|---|
| Rising Demand for On-Demand Manufacturing and Hyper-Personalized Products | +2.8% | Global, early concentration in North America and Western Europe, rapid uptake in major Asia-Pacific cities | Medium term (2-4 years) |
| Accelerating Cost Decline per Part in Additive Manufacturing | +2.4% | Global, led by North America and Europe, spillover to Asia-Pacific | Short term (≤ 2 years) |
| Automotive OEM Shift Toward Agile Hardware Sprints | +1.9% | North America, Europe, China, secondary in South Korea and Japan | Medium term (2-4 years) |
| Shorter Product Life-Cycles in Consumer Electronics | +1.7% | Global, epicenters in China, South Korea, Taiwan, United States | Short term (≤ 2 years) |
| Venture-Capital Funding for Cloud-Based Prototyping Platforms | +1.4% | North America and Europe, emerging in Asia-Pacific and Middle East | Long term (≥ 4 years) |
| Rapid Expansion of Regional R&D Subsidies for Localized Production | +1.2% | Europe, Asia-Pacific, Middle East | Long term (≥ 4 years) |
| Source: Mordor Intelligence | |||
Rising Demand for On-Demand Manufacturing and Hyper-Personalized Products
Brands in electronics, medical devices, and automotive interiors increasingly rely on pull-based fabrication, ordering single pieces or micro-batches that arrive within days.[1]Xometry, “2026 Manufacturing Outlook,” xometry.com Patient-specific orthopedic guides exemplify how geometry variability makes traditional tooling uneconomical. Footwear firms test lattice midsoles tuned to individual gait patterns, while eyewear designers iterate frames from facial scans. ISO 13485 and ISO 9001 frameworks ensure that distributed workflows meet production-grade traceability, easing adoption. As AI automates manufacturability checks, non-engineers gain entry, broadening the product prototyping market.
Accelerating Cost Decline per Part in Additive Manufacturing
Polymer and metal additive part costs have fallen 30-40% in five years as multi-laser systems lift throughput and powder-recovery loops curb waste. Binder-jetting platforms now re-use powder across cycles, further reducing unit economics. Aerospace programs prototype titanium parts earlier to validate designs before forging, leveraging these savings. Material vendors are pricing engineering polymers 20-30% below 2020 levels, stimulating broader uptake. Combined with advanced build-optimization software, these shifts pull the product prototyping market toward applications once reserved for CNC machining.
Automotive OEM Shift Toward Agile Hardware Sprints
OEMs such as Audi trimmed interior-trim iteration from 12 weeks to 3 weeks using 3D printing. Electric-vehicle programs, where battery architectures keep evolving, benefit from concurrent prototype loops that freeze tooling only when chemistries stabilize. Tier-1 suppliers now house rapid-prototype cells that blend additive, CNC, and sheet-metal equipment to deliver parts in days. ISO 26262 and IATF 16949 governance embeds functional-safety checkpoints inside those accelerated workflows.[2]ISO, “ISO 13485 Quality Management,” iso.org As platform vehicle architectures spread, differentiating upper-body styling amplifies demand for frequent low-volume prototypes.
High Post-Processing and Finishing Costs for Functional Prototypes
Support removal, surface polishing, and heat treatment can equal 30-40% of total additive-prototype spend, undermining cost advantages. Automated finishing cells remain limited to simple geometries, forcing labor-intensive hand work for complex parts. Metal prototypes demand stress-relief and machining that may double raw-build costs. Inconsistent post-processing standards complicate quality assurance when buyers use multiple bureaus. Large firms are investing in robotic support-removal lines, but until prices drop, adoption in cost-sensitive sectors will lag.
Restraints Impact Analysis*
| Restraint | (~) % Impact on CAGR Forecast | Geographic Relevance | Impact Timeline |
|---|---|---|---|
| High Post-Processing and Finishing Costs for Functional Prototypes | -1.8% | Global, acute where labor is expensive | Short term (≤ 2 years) |
| IP-Theft Concerns in Distributed Manufacturing Ecosystems | -1.3% | Global, heightened in China and India | Medium term (2-4 years) |
| Skills Gap in Hybrid CNC and Additive Workflows | -0.9% | North America, Europe, Asia-Pacific | Long term (≥ 4 years) |
| Volatile Engineering-Grade Polymer Prices | -0.7% | Global, linked to petrochemical supply | Short term (≤ 2 years) |
| Source: Mordor Intelligence | |||
High Post-Processing and Finishing Costs for Functional Prototypes
Support removal, sand-blasting, and heat treatment can triple the base build cost of metal parts, eroding the business case for functional prototypes in cost-sensitive sectors.[3]VPrint3D, “Post-Processing Cost Analysis,” vprint3d.com Although AM Flow and PostProcess Technologies offer automated finishing cells, entry tickets above USD 400,000 deter many shop floors. Labor-driven steps also introduce variability that undermines tight tolerance requirements in aerospace and orthopedic implants. Clients unwilling to absorb these expenses revert to traditional machining despite longer lead times, constraining revenue realization for the product prototyping market until automation spreads and capital costs decline.
IP-Theft Concerns in Distributed Manufacturing Ecosystems
The USTR’s 2026 Special 301 Report cataloged persistent enforcement gaps in key offshore jurisdictions. Cases documented by World Trademark Review show CAD files duplicated and marketed within weeks, eroding first-mover advantage. Blockchain provenance tools promise mitigation yet face integration hurdles for small service bureaus. U.S. and EU trade-secret laws offer recourse, but litigation costs prompt many firms to insource or limit vendor geography. Secure-transfer platforms are emerging, but until widely adopted, some companies will restrict exposure, tempering growth of the product prototyping market.
*Our forecasts treat driver/restraint impacts as directional, not additive. The impact forecasts reflect baseline growth, mix effects, and variable interactions.
Segment Analysis
By Product Type: Additive Dominance Reshapes Tooling Economics
3D printing generated 36.57% of 2025 revenue, securing the largest product prototyping market share, and is projected to expand at an 11.64% CAGR. Complex lattices and conformal cooling channels make additive manufacturing the default for aerospace brackets and medical implants. CNC machining keeps relevance where sub-10 micron tolerances and mirror finishes are mandatory, although longer setups limit its growth. Injection molding endures for production-intent validation when cosmetic surfaces and production plastics are essential, but up-front mold costs gatekeep low-volume programs.
Hybrid workflows integrate sheet-metal laser cutting and CNC bending for thin-wall enclosures with cycle times that rival additive for flat-pattern parts. Multi-material additive platforms that deposit rigid and elastomeric polymers in one build further erode the boundaries between methods, consolidating assemblies and shrinking lead times. As these technologies converge, the product prototyping market continues shifting toward flexible, digital-driven production engines.


By Material Type: Composites Gain as Light Weighting Intensifies
Plastics provided 44.88% of revenues in 2025, underlining their cost and processing versatility. However, composites are expected to post an 11.67% CAGR through 2031, the fastest of any material segment. Continuous-fiber printing now validates load paths for automotive and aerospace structures before committing to autoclave tooling. Metals remain indispensable where heat dissipation or biocompatibility matter, with titanium and aluminum dominating additive builds for medical and aerospace prototypes.
Elastomeric prototypes support sealing and haptic feedback use cases, aided by photopolymers that replicate multiple shore hardness levels. Ceramic and bio-based polymer demand, while niche, grows on sustainability regulations in Europe. The narrowing gap between prototype and production materials reduces redesign cycles and pushes further growth in the product prototyping market.
By Service Type: Testing Services Capture Validation Demand
Prototype manufacturing made up 31.15% of 2025 revenue and remains the core gateway into engagements. Functional testing, forecast for an 11.56% CAGR, is rising as regulators tighten performance documentation, especially in medical devices under the FDA’s Quality Management System Regulation. User-experience validation platforms extend testing beyond physical to digital touchpoints, shortening launch cycles.
Design-engineering consulting fills skills gaps for firms lacking in-house CAD and analysis capabilities, while 3D scanning rebuilds legacy parts into digital twins for re-manufacture. Rapid tooling and small-batch production blur the line between prototyping and manufacturing, an evolution that underscores the strategic importance of service breadth in the product prototyping market.
By End-Use Industry: Medical Devices Accelerate
Automotive retained 25.12% revenue share in 2025, benefiting from electric-vehicle program iterations. Yet medical devices, expanding at an 11.67% CAGR, lead growth on the back of patient-specific implants and the FDA’s Breakthrough Devices pathway. Aerospace and defense projects rely on quicker certification of lightweight metal parts as additive cost curves drop.
Consumer electronics sustain demand due to sub-annual refresh cycles and the need for rapid appearance models. Industrial machinery users adopt on-demand parts to minimize inventory, tapping the flexibility of the product prototyping market. As customization and regulatory pressures rise, integrated prototype-to-production pipelines become critical vendor differentiators.
Geography Analysis
North America controlled 30.18% of 2025 revenue, supported by clustered automotive and aerospace design centers and contract-manufacturing density. Government incentives for reshoring critical supply chains continue to reinforce local prototype demand. However, Asia-Pacific is projected to post a 12.11% CAGR as China recorded a 54% year-on-year jump in 3D-printing equipment output during Q1 2026. India’s friendshoring initiatives further amplify regional capacity additions.
Europe’s growth is built on Germany’s automotive-tooling corridors and the United Kingdom’s aerospace-certification expertise. GE Aerospace’s EUR 110 million (USD 124 million) regional investment underscores lasting confidence. Middle East and Africa markets are emerging, exemplified by Saudi Arabia’s USD 26 million tungsten-core framework that pairs local innovation with global OEM partnerships.
South America remains small but shows momentum as Brazilian firms trial rapid tooling and Argentine aerospace projects test metal additive for satellite parts. Across geographies, vendor selection now weighs cost and lead time against IP protection and certification infrastructure, a calculus that shapes flows in the product prototyping market.

Competitive Landscape
The Product Prototyping Market is Moderately Fragmented. Competition is moderate, with vertically integrated veterans, Proto Labs, Materialize, Stratasys, and 3D Systems, leveraging proprietary materials and global production hubs. Proto Labs expanded its metal additive capacity in North Carolina during November 2025 to defend high-value segments, while Stratasys partnered with Tritone and Xometry to diversify materials and reach. 3D Systems’ divestiture of non-core software refocused capital on industrial printers co-developed with Oerlikon.
Digital-native platforms such as Xometry and Fathom harness algorithmic pricing and distributed fulfillment, scaling without heavy asset bases. Lovable’s USD 330 million Series B at a USD 6.6 billion valuation and Magic Patterns’ profitable SaaS play show investor conviction in software-orchestrated manufacturing. AI-driven manufacturability analysis further differentiates platforms by shaving engineering labor and accelerating quote-to-dock cycles.
Regional fragmentation persists as specialized CNC, sheet-metal, and injection-mold shops maintain cost advantages on geometry-specific work. Nevertheless, certification hurdles under ISO 9001 and AS9100 constrain smaller entrants, nudging consolidation toward providers with documented compliance histories. Hybrid workflows that blend CNC roughing with additive finishing remain green-field opportunities inside the product prototyping market.
Product Prototyping Industry Leaders
Proto Labs, Inc.
Xometry, Inc.
Stratasys Ltd. (Stratasys Direct)
Materialise NV
3D Systems Corporation
- *Disclaimer: Major Players sorted in no particular order


Recent Industry Developments
- April 2026: Stratasys and Xometry partnered to list proprietary nylon and polypropylene powders on Xometry’s instant-quoting platform, broadening material access for functional prototypes.
- March 2026: 3D Systems highlighted healthcare and industrial focus in FY 2025 results, emphasizing the DMP Factory 500 metal platform co-developed with Oerlikon.
- February 2026: IBM Ventures invested in Anima to scale its design-to-code automation tool beyond 1.5 million installs.
- January 2026: Flora raised USD 42 million Series A to expand its no-code, node-based digital-product prototyping tool.


Global Product Prototyping Market Report Scope
The Product Prototyping Market pertains to the industry dedicated to the development of tools, technologies, and services that enable the creation of prototypes prior to mass production. This market encompasses both physical and digital prototyping methods, including 3D printing, CAD modeling, and rapid manufacturing. These methods support businesses in validating designs, assessing functionality, minimizing development costs, and expediting time-to-market by converting concepts into tangible or virtual representations.
The Product Prototyping Market Report is Segmented by Product Type (3D Printing, CNC Machining, Injection Molding, Sheet-Metal Prototyping, Other Product Type), Material Type (Plastics, Metals, Composites, Rubber, Other Material Type), Service Type (Design and Engineering, Prototype Manufacturing, Functional Testing, 3D Scanning and Reverse Engineering, Other Service Type), End-Use Industry (Automotive, Aerospace and Defense, Consumer Electronics, Medical Devices, Industrial Machinery, Other End-Use Industry), and Geography (North America, Europe, Asia-Pacific, Middle East and Africa, South America). The Market Forecasts are Provided in Terms of Value (USD).
| 3D Printing |
| CNC Machining |
| Injection Molding |
| Sheet-Metal Prototyping |
| Other Product Type |
| Plastics |
| Metals |
| Composites |
| Rubber |
| Other Material Type |
| Design and Engineering |
| Prototype Manufacturing |
| Functional Testing |
| 3D Scanning and Reverse Engineering |
| Other Service Type |
| Automotive |
| Aerospace and Defense |
| Consumer Electronics |
| Medical Devices |
| Industrial Machinery |
| Other End-Use Industry |
| North America | United States | |
| Canada | ||
| Mexico | ||
| Europe | Germany | |
| United Kingdom | ||
| France | ||
| Russia | ||
| Rest of Europe | ||
| Asia-Pacific | China | |
| Japan | ||
| India | ||
| South Korea | ||
| Australia | ||
| Rest of Asia-Pacific | ||
| Middle East and Africa | Middle East | Saudi Arabia |
| United Arab Emirates | ||
| Rest of Middle East | ||
| Africa | South Africa | |
| Egypt | ||
| Rest of Africa | ||
| South America | Brazil | |
| Argentina | ||
| Rest of South America | ||
| By Product Type | 3D Printing | ||
| CNC Machining | |||
| Injection Molding | |||
| Sheet-Metal Prototyping | |||
| Other Product Type | |||
| By Material Type | Plastics | ||
| Metals | |||
| Composites | |||
| Rubber | |||
| Other Material Type | |||
| By Service Type | Design and Engineering | ||
| Prototype Manufacturing | |||
| Functional Testing | |||
| 3D Scanning and Reverse Engineering | |||
| Other Service Type | |||
| By End-Use Industry | Automotive | ||
| Aerospace and Defense | |||
| Consumer Electronics | |||
| Medical Devices | |||
| Industrial Machinery | |||
| Other End-Use Industry | |||
| By Geography | North America | United States | |
| Canada | |||
| Mexico | |||
| Europe | Germany | ||
| United Kingdom | |||
| France | |||
| Russia | |||
| Rest of Europe | |||
| Asia-Pacific | China | ||
| Japan | |||
| India | |||
| South Korea | |||
| Australia | |||
| Rest of Asia-Pacific | |||
| Middle East and Africa | Middle East | Saudi Arabia | |
| United Arab Emirates | |||
| Rest of Middle East | |||
| Africa | South Africa | ||
| Egypt | |||
| Rest of Africa | |||
| South America | Brazil | ||
| Argentina | |||
| Rest of South America | |||


Key Questions Answered in the Report
What is the current product prototyping market size and projected growth?
The product prototyping market size stands at USD 25.75 billion in 2026 and is forecast to reach USD 44.19 billion by 2031, reflecting an 11.41% CAGR.
Which product type holds the largest share in global prototyping?
3D printing leads with 36.57% of 2025 revenue, and its segment is expanding faster than CNC machining or injection molding.
Why are medical-device companies accelerating prototyping spend?
Personalized implants and faster FDA pathways drive higher prototype volumes and a projected 11.67% CAGR for the segment, encouraging service bureaus to add ISO 13485-compliant capacity.
Which region will post the fastest growth through 2031?
Asia-Pacific is forecast to grow at a 12.11% CAGR thanks to China's surging printer installations and India's friendshoring-led capacity additions.
What are the main cost barriers to wider additive-manufacturing adoption?
Post-processing expenses account for up to 40% of functional-prototype costs, limiting uptake in price-sensitive projects despite falling print costs.
How are IP-security concerns being addressed in distributed manufacturing?
Firms increasingly adopt encrypted file-transfer tools, blockchain provenance tracking, and selective on-shoring to mitigate unauthorized replication risks.
Page last updated on:


