
Commerce Cloud Market Size and Share
Market Overview
| Study Period | 2020 - 2031 |
|---|---|
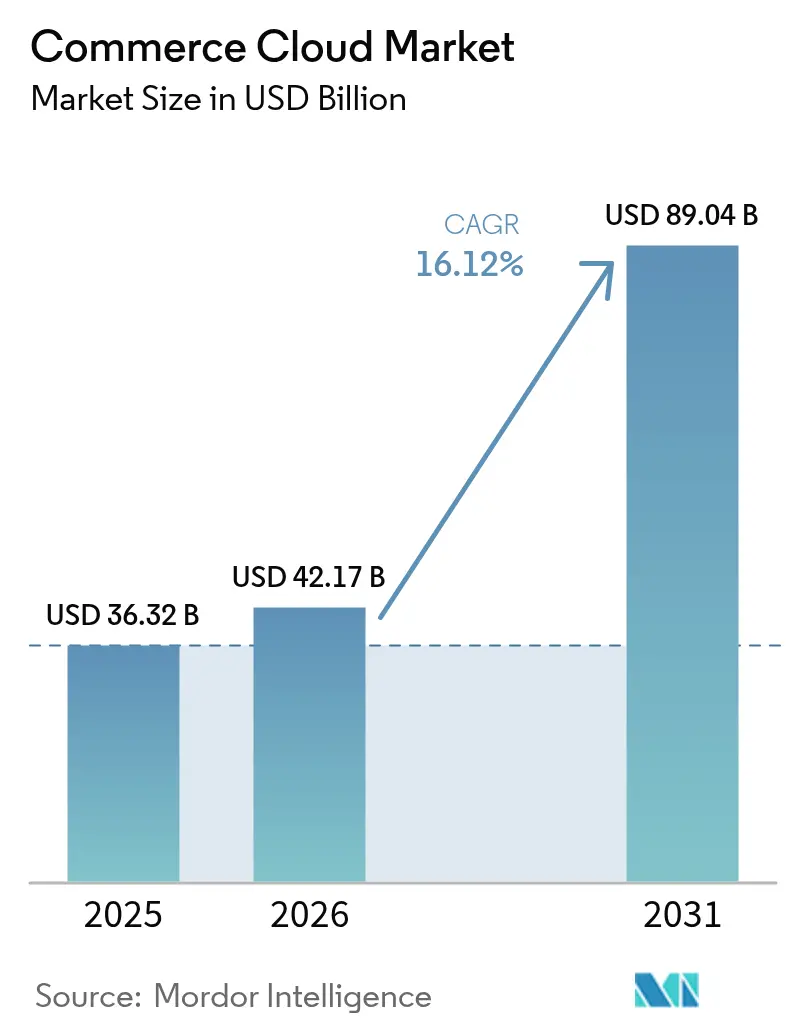
| Market Size (2026) | USD 42.17 Billion |
| Market Size (2031) | USD 89.04 Billion |
| Growth Rate (2026 - 2031) | 16.12 % |
| Fastest Growing Market | Asia-Pacific |
| Largest Market | North America |
| Market Concentration | Medium |
Major Players *Disclaimer: Major Players sorted in no particular order Image © Mordor Intelligence. Reuse requires attribution under CC BY 4.0. | |
Commerce Cloud Market Analysis by Mordor Intelligence
The commerce cloud market size was valued at USD 36.32 billion in 2025 and estimated to grow from USD 42.17 billion in 2026 to reach USD 89.04 billion by 2031, at a CAGR of 16.12% during the forecast period (2026-2031).[1]Salesforce Newsroom, “Salesforce Announces Q1 FY25 Results,” salesforce.comRobust growth reflects enterprises’ rapid move toward API-first designs that support hyper-personalized shopping, real-time data activation, and generative-AI services. Demand is also driven by retailer mandates for omnichannel order management, the increasing adoption of microservice stacks, and the proven cost agility of public cloud. Composable architectures shorten release cycles and reduce vendor lock-in, while early adopters report lower abandonment rates and faster load times. Regional momentum remains strongest in North America, yet Asia Pacific is narrowing the gap as B2B digitization accelerates and mobile-first buying habits mature.
Key Report Takeaways
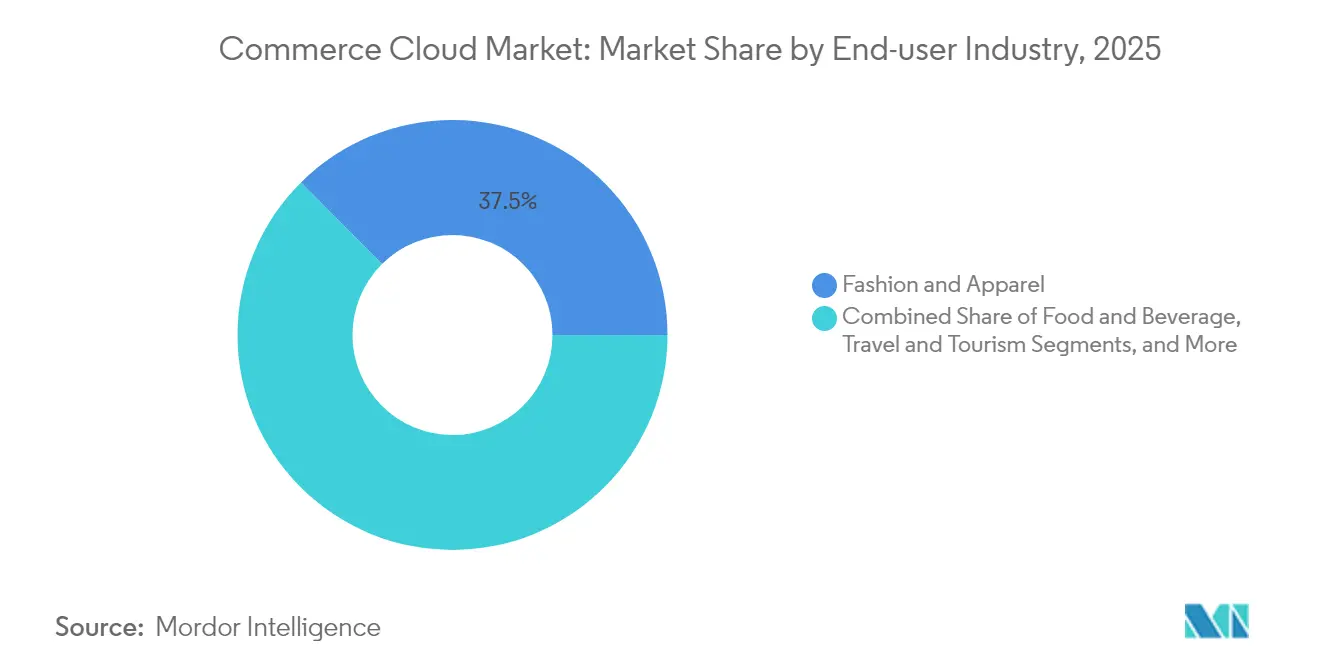
- By end-user industry, Fashion and Apparel led with 37.45% revenue share in 2025, while Grocery and Pharmaceuticals is set to grow at an 18.12% CAGR to 2031.
- By platform, the B2C segment held 63.10% of the commerce cloud market share in 2025, whereas Marketplace-as-a-Service shows a 20.75% CAGR through 2031.
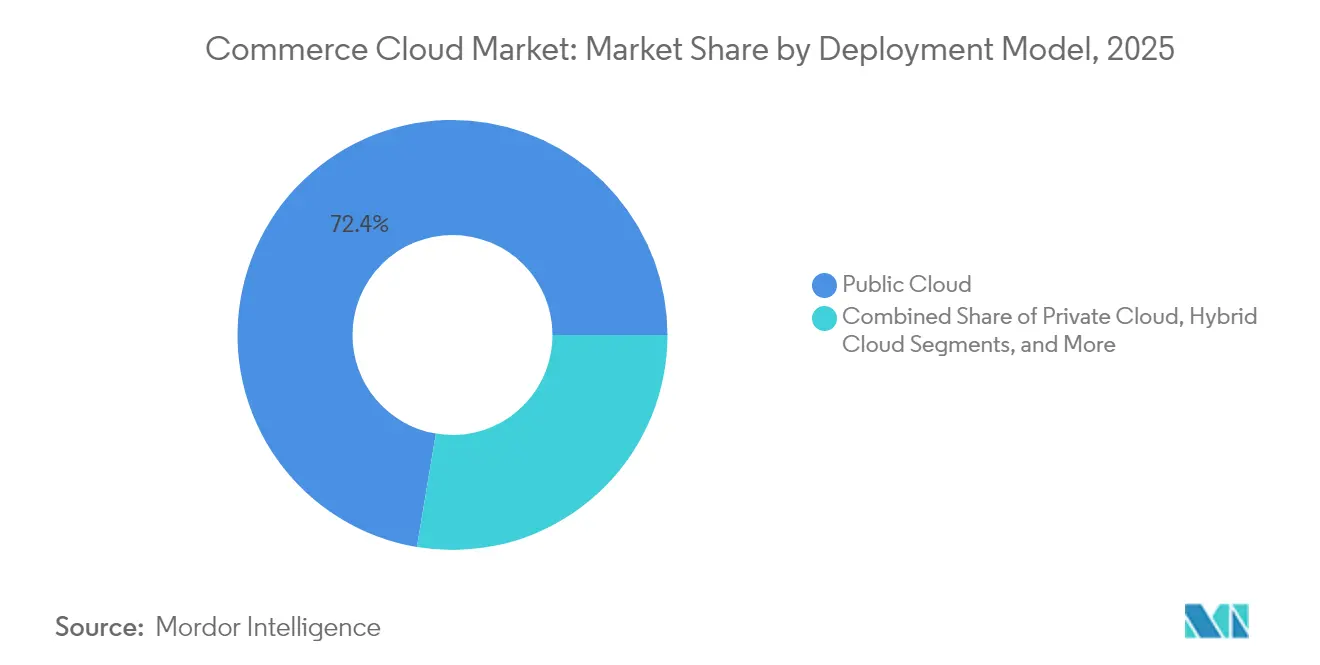
- By deployment model, Public Cloud accounted for 72.35% share of the commerce cloud market size in 2025 and Composable architectures are expanding at a 22.95% CAGR.
- By organization size, SMEs captured 55.40% share of the commerce cloud market in 2025 and are growing at a 16.88% CAGR.
- By geography, North America dominated with 40.55% share in 2025, while Asia Pacific is advancing at a 16.22% CAGR to 2031.
Note: Market size and forecast figures in this report are generated using Mordor Intelligence’s proprietary estimation framework, updated with the latest available data and insights as of 2026.
Global Commerce Cloud Market Trends and Insights
Drivers Impact Analysis*
| Driver | (~) % Impact on CAGR Forecast | Geographic Relevance | Impact Timeline |
|---|---|---|---|
| Hyper-personalization via GenAI and real-time CDP integration | +3.2% | Global, early in North America and EU | Medium term (2-4 years) |
| Omnichannel order-management mandates from major retailers | +2.8% | North America and EU core, expanding to APAC | Short term (≤ 2 years) |
| API-first and headless architectures shortening time-to-market | +2.1% | Global, led by North America and Western Europe | Medium term (2-4 years) |
| Growing preference for composable microservice stacks | +1.9% | North America and EU, APAC following | Long term (≥ 4 years) |
| Accelerating B2B digital migration post-COVID | +1.7% | Global, strong in APAC and Latin America | Short term (≤ 2 years) |
| Green-cloud commitments shaping vendor choice | +0.8% | EU leading, North America and APAC following | Long term (≥ 4 years) |
| Source: Mordor Intelligence | |||
Hyper-personalization via GenAI and real-time CDP integration
Generative AI fused with customer data platforms is raising click-through and conversion by 13%, as shown by Alibaba’s AIGI service that renders photorealistic products from text before production.[2]Hinze Zhang, “AIGI: AI-Generated Imagery in Commerce,” arXiv, arxiv.orG Target’s AI grocery push lifted conversion 6.2% and took digital grocery to 13.2% of revenue. Real-time data feeds also enable predictive inventory and dynamic pricing, turning the commerce cloud market into a strategic engine for competitive edge. Yet data-quality dependency and skill gaps place smaller firms at risk of falling behind market leaders.
Omnichannel order-management mandates from major retailers
Retailers now demand granular visibility across stores, warehouses, and last-mile partners. PLUS Supermarkets’ shift to composable commerce cut online friction by 89% and boosted site speed up to 70%.[3]Commercetools GmbH, “PLUS Supermarkets Goes Composable,” commercetools.com Barbeques Galore trimmed excess stock 30% and halved order-processing time after adding Fluent Order Management. Suppliers that lag on these capabilities face delisting or costly manual processes, which is accelerating commerce cloud adoption.
API-first and headless architectures shortening time-to-market
Headless frameworks reduce launch cycles from months to weeks. A global sportswear brand saw cart abandonment fall 28% and mobile conversion climb 15% after moving off a monolithic stack. Surveyed engineering leaders say better developer experience is now essential for innovation. Skills scarcity remains a hurdle, but early movers reap higher resiliency during peak traffic.
Growing preference for composable microservice stacks
Composable commerce lets firms swap services without rewriting the core. Commercetools topped vendor evaluations with a 4.59 score for composable use cases. Salling Group reduced licensing fees 75% and lifted conversion 30% after modular re-platforming. Ulta Beauty scaled thousands of channels under one MACH-based layer, proving the approach at retail scale. Governance complexity, however, calls for disciplined vendor and API management.
Restraints Impact Analysis*
| Restraint | (~) % Impact on CAGR Forecast | Geographic Relevance | Impact Timeline |
|---|---|---|---|
| High technical debt and migration costs | -2.4% | Global, acute in North America and EU | Short term (≤ 2 years) |
| Data-sovereignty and cross-border privacy rules | -1.8% | EU leading, expanding worldwide | Medium term (2-4 years) |
| Vendor lock-in fears around proprietary PaaS | -1.3% | Global, highest in enterprise tier | Long term (≥ 4 years) |
| Shortage of cloud-native commerce talent | -1.1% | Global, most severe in North America and EU | Medium term (2-4 years) |
| Source: Mordor Intelligence | |||
High technical debt and migration costs from monolithic stacks.
Sixty-one percent of B2B sellers plan to launch a new platform due to legacy limitations, yet dual-run periods can inflate costs and increase risk. Oracle ATG migrations can take 18 months and require specialized change management. Yet, 90% of recent migrants report increased sales, with 30% experiencing growth in the top tier, underscoring their long-term worth.
Shortage of cloud-native commerce talent
By 2026, 90% of firms will face critical tech skill gaps, exposing USD 5.5 trillion in risk. Automotive leaders echo the pain, with 69% citing software shortages as a digital barrier.[4]IBM Institute for Business Value, “Automotive Software Readiness 2024,” ibm.com Companies are betting on AI code assistants and upskilling to fill the gap, yet supply trails demand.
*Our forecasts treat driver/restraint impacts as directional, not additive. The impact forecasts reflect baseline growth, mix effects, and variable interactions.
Segment Analysis
By End-user Industry: Fashion Leads While Grocery Accelerates
Fashion and Apparel held 37.45% of the commerce cloud market share in 2025, thanks to its early adoption of personalization and complex inventory orchestration. Sephora’s unified data model demonstrates how style brands deliver premium experiences, driving wallet-share growth. Electronics follow due to product-configurator needs and dealer integrations. Beauty and Personal Care rides virtual try-ons, with L’Oréal launching 60 DTC sites on Salesforce in weeks. The commerce cloud market size for Grocery and Pharmaceuticals is projected to expand at an 18.12% CAGR through 2031 as same-day delivery drives system upgrades. Travel, Automotive, and Home and Furniture are emerging plays as AR and connected-car commerce mature.Smaller industries are now adopting the platform because the cost has fallen, and specialized templates are available.
Subscription models in the Food and beverage industry, as well as same-day drug fulfillment, demonstrate how even regulated categories are moving online. Growth in these niches maintains high momentum in the overall commerce cloud market, despite macroeconomic volatility.



By Platform: B2C Dominance Challenged by Marketplace Innovation
B2C commerce accounted for 63.10% of 2025 revenue, reflecting the company's deep DTC roots and continued investment in UX. Target’s AI shopper segmentation underpins the plateau. Marketplace-as-a-Service is racing ahead with a 20.75% CAGR, as brands open third-party stalls to monetize traffic. The commerce cloud market size allocated to B2B is expanding steadily because manufacturers need dealer portals and punch-out catalogs. D2C streams grow as labels bypass resellers to lift margins. Multi-model suites now enable one backend to support B2C, B2B, and marketplace flows, thereby reducing stack sprawl.
Vendor roadmaps favor unified checkout, flexible commission rules, and embedded financing. These capabilities keep the commerce cloud market attractive for firms seeking new revenue without investing in new infrastructure.
By Deployment Model: Public Cloud Leads as Composable Surges
Public Cloud controlled 72.35% of spend in 2025. Firms keep workloads there for scale and pay-as-you-grow economics. Yet composable setups post a 22.95% CAGR, signalling that flexibility outranks lift-and-shift savings. The commerce cloud market size aimed at private deployments remains strong in pharma and public-sector contracts, where data residency is a key consideration. Hybrid designs help firms phase migrations and hedge costs.
Sustainability pledges tilt decisions. Google and Microsoft both aim to achieve carbon-free operations by the end of this decade, which will influence RFP criteria. Composable stacks enable green-conscious buyers to swap services without forklift upgrades, thereby strengthening their appeal.
By Organization Size: SMEs Drive Democratic Access
SMEs accounted for 55.40% of spend in 2025 and grew at 16.88% CAGR, proving that sophisticated commerce now fits smaller IT budgets. Usage-based licenses and turnkey connectors compress launch costs and timelines. Vision Healthcare rolled out a composable stack for 75 brands in four months, handling 25,000 daily orders. Large enterprises still lead in multi-brand control and global rollouts, but modular design enables vendors to serve both tiers from a single code base.
The cloud computing industry is increasingly tailoring packages that scale linearly, easing upgrade anxiety. As SME adoption broadens, vendor ecosystems are gathering more apps and partners, thereby reinforcing network effects.
Geography Analysis
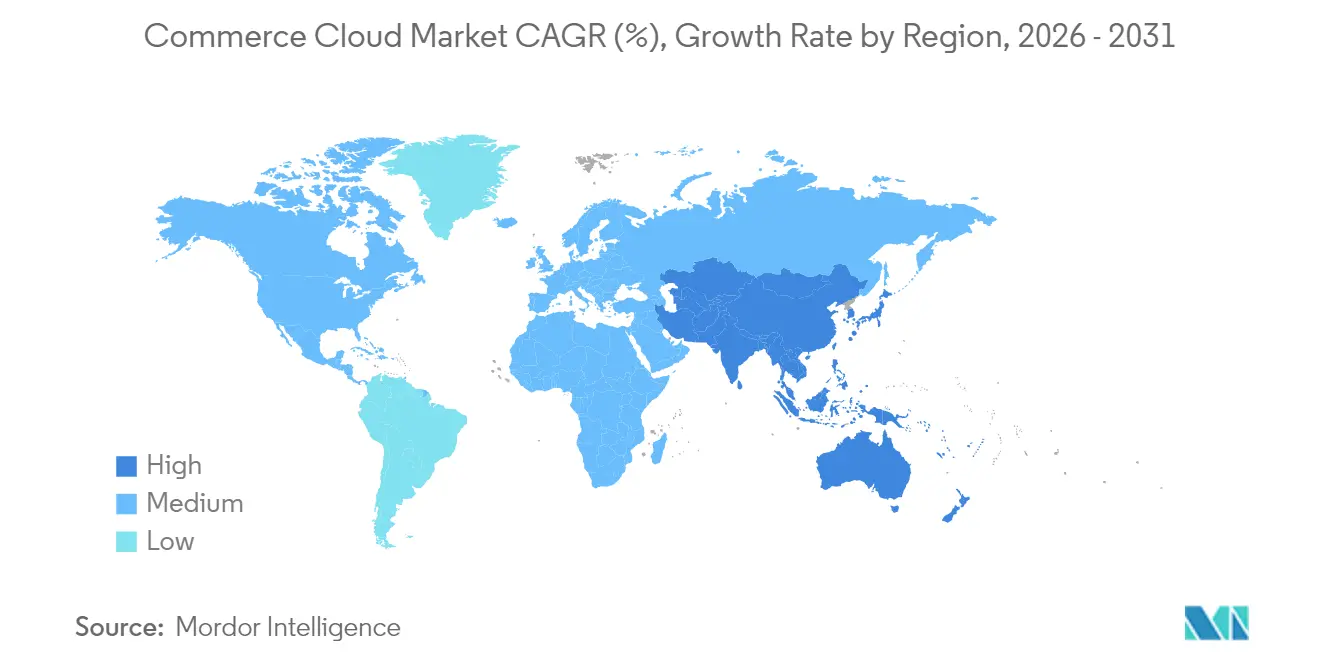
North America retained 40.55% of 2025 revenue due to early adoption of headless solutions and dense hyperscaler footprints. Walmart’s 18% e-commerce mix shows persistent digital momentum. Skill shortages and rising cloud bills temper growth, prompting a shift to remote hiring and the adoption of FinOps. The commerce cloud market size in the Asia Pacific is expanding at a 16.22% CAGR as emerging markets leapfrog to mobile-first commerce. Government digital agendas and B2B modernization spark volume, especially in India and China.Latin America benefits from a record USD 224.579 billion in foreign direct investment and the arrival of cloud data centers by Microsoft, AWS, and Oracle. Europe focuses on sovereign cloud, with 37% of firms already investing to meet region-specific regulations. The
The Middle East and Africa are reporting a rise in digital payments and supportive national programs that are widening the commerce cloud market. Vendors that localize compliance functions and payment rails capture a disproportionately large share.

Regulatory Landscape
Commerce cloud deployments operate under privacy, cybersecurity, AI governance, and public-sector procurement rules that increasingly influence architecture choices, including data residency, auditability, and third-party risk controls. In the United States, federal buyers anchor requirements through FedRAMP, with 2026 updates emphasizing security indicators and cloud-native architecture guidance, alongside continued FISMA-aligned security and privacy management expectations for agencies.
In Europe, the European Commission is advancing cloud and AI policy initiatives, and the EU AI Act introduces transparency and documentation duties that can shape AI-enabled personalization, search, and agentic shopping experiences embedded in commerce platforms. Governments are also tightening cloud sovereignty and localization expectations, which can translate into cross-border processing constraints and procurement restrictions that global vendors and multinational retailers must design around through regional hosting, contractual controls, and compliance automation.
Value Chain Analysis
The commerce cloud value chain begins with hyperscale cloud infrastructure and foundational services (compute, storage, databases, security) that support public, private, and hybrid deployments, and then extends to commerce application vendors providing storefront, catalog, pricing, checkout, and order management capabilities. Ecosystem layers add identity, CDP/analytics, search, payments, tax, fraud, and logistics connectors, while marketplaces and app partners package vertical and regional functionality to speed implementation.
Downstream, systems integrators and digital agencies handle discovery, migration, and composable builds, which can become multi-month programs for large enterprises and often drive time-to-value. Buyer-side operations (merchandising, marketing, customer service, fulfillment) shape requirements for omnichannel order visibility and real-time data activation, while infrastructure constraints and geopolitics can affect deployment planning, including hardware availability for data center buildouts and tariff-related cost volatility for imported components. Recent operator and enterprise programs, such as Smart Communications working with Salesforce on a unified digital storefront and MTN South Africa launching a digital brand on LotusFlare’s cloud-native platform, highlight how partnerships increasingly bundle platform software with implementation and industry-specific monetization workflows.
Competitive Landscape
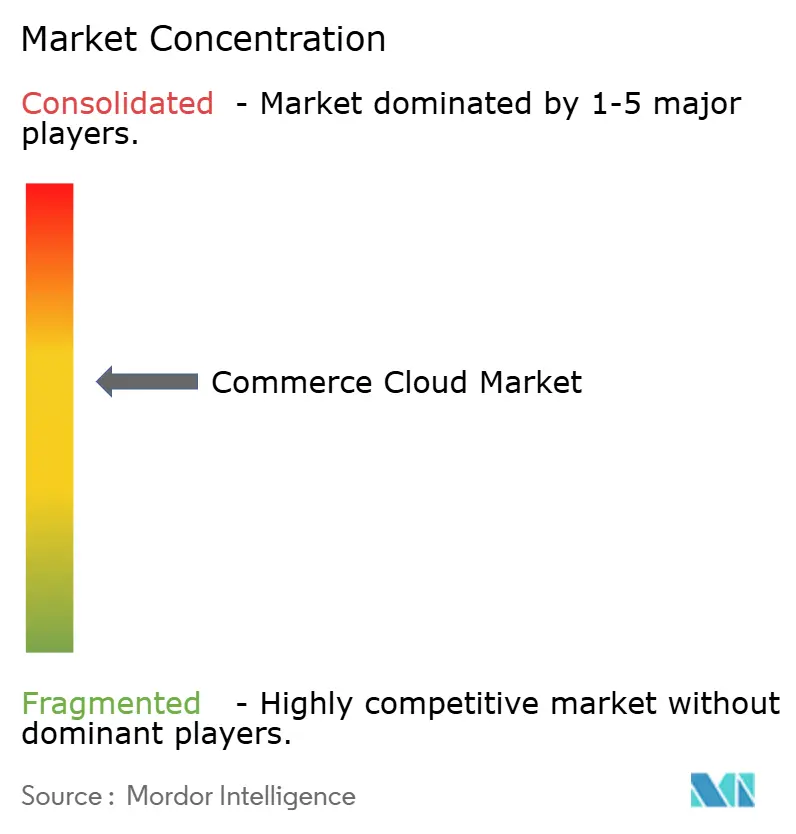
The commerce cloud market is moderately fragmented, yet it is trending toward consolidation. Salesforce moved to buy Informatica for USD 8 billion, adding deep data management that fuels personalization. Commercetools users are 12 points more likely to cut the total cost of ownership, highlighting cost ROI as a battleground. Patent filings in cloud service orchestration and AI content signal future differentiation based on automation and personalization.
White-space solutions emerge in automotive, healthcare, and industrial scenarios that demand vertical compliance. New entrants leverage microservices and pay-per-use bundles to erode incumbent hold. Incumbents counter with ecosystem programs and carbon-neutral roadmaps. Selection criteria now include green metrics and AI roadmap maturity, prompting all vendors to innovate at a rapid pace.
The top five vendors together hold around 45% share, pointing to a mid-consolidated structure that still offers room for challengers.
Commerce Cloud Industry Leaders
SAP SE (maihiro GmbH)
Oracle Corporation
BigCommerce Pty. Ltd.
Shopify Inc.
Salesforce Inc
- *Disclaimer: Major Players sorted in no particular order

Market Opportunities and Future Outlook
Enterprise buyers are re-platforming away from monolithic stacks toward API-first and composable commerce, creating whitespace for vendors and integrators that reduce migration risk, accelerate releases, and lower the dual-run burden that comes with legacy replacements. Adoption signals show up in vendor programs centered on modular storefront frameworks and faster build cycles, while retailers and B2B firms continue to push for granular omnichannel inventory and order orchestration, particularly where suppliers face mandate-driven requirements from larger channels.
AI-enabled commerce experiences are a second opportunity area, tied to product discovery, merchandising automation, and service workflows that depend on data unification and governance. Named roadmaps and releases, including Salesforce updating its B2C Commerce roadmap in 2026 with AI-driven agent integration and related experience enhancements, point to ongoing investment in conversational shopping and workflow automation. Payments is also a monetizable layer as platforms move toward embedded payments to streamline checkout and reduce integration sprawl; collaborations such as SAP Commerce Cloud working with Adyen on a native payment capability show vendors bundling revenue-path services into the core platform.
Recent Industry Developments
- July 2026: Oracle announced customer outcomes tied to Oracle Retail Lifecycle Pricing Optimization, citing Bealls Inc. increasing clearance sales dollars by 25%. The update reinforces how commerce-adjacent pricing and optimization suites are being positioned as AI-enabled levers that connect demand, inventory, and margin management across digital and store channels.
- May 2026: SAP introduced SAP Commerce Cloud, ERP Edition at SAP Sapphire Orlando, targeting small and mid-sized B2B organizations that want commerce aligned to core ERP processes. This expands vendor coverage into a mid-market segment where implementation simplicity and native back-office integration are key buying criteria.
- May 2025: Salesforce signed a definitive agreement to acquire Informatica for USD 8 billion, strengthening data integration and management capabilities across its portfolio. The acquisition supports commerce use cases that rely on unified customer and product data to power personalization, real-time activation, and governance for AI-driven experiences.


Research Methodology Framework and Report Scope
Market Definition and Coverage
We define the commerce cloud market as cloud-based software and related services that help companies build, run, and improve digital commerce experiences across web, mobile, and connected channels.
Scope exclusions: We exclude pure on-premise commerce software, general IT infrastructure cloud spend, and non-commerce marketing tools that do not support transactions.
Segmentation Overview
- By End-user Industry
- Fashion and Apparel
- Grocery and Pharmaceuticals
- Electronics and Appliances
- Food and Beverage
- Beauty and Personal Care
- Travel and Tourism
- Automotive and Spare Parts
- Home and Furniture
- By Platform
- B2C Commerce
- B2B Commerce
- D2C Commerce
- Marketplace-as-a-Service
- By Deployment Model
- Public Cloud
- Private Cloud
- Hybrid Cloud
- Composable / Micro-service
- By Organization Size
- Small and Medium Enterprises
- Large Enterprises
- By Geography
- North America
- United States
- Canada
- Mexico
- South America
- Brazil
- Argentina
- Chile
- Rest of South America
- Europe
- United Kingdom
- Germany
- France
- Italy
- Spain
- Netherlands
- Russia
- Rest of Europe
- Asia Pacific
- China
- India
- Japan
- South Korea
- ASEAN
- Rest of Asia Pacific
- Middle East and Africa
- Middle East
- United Arab Emirates
- Saudi Arabia
- Turkey
- Rest of Middle East
- Africa
- South Africa
- Nigeria
- Kenya
- Rest of Africa
- Middle East
- North America
Data Sources, Market Sizing, and Validation
Desk Research
Desk research was used to set the market perimeter and to anchor demand signals that can be cross-checked consistently across regions. We relied on public sources such as US Census Bureau e-commerce statistics, Eurostat digital economy indicators, OECD ICT and business demography datasets, WTO and UN Comtrade trade series for related hardware flows, and WIPO patent and technology classification data to understand innovation direction.
On top of this, we reviewed company annual reports, earnings call notes, investor presentations, product documentation, and reputable press coverage to understand packaging, customer adoption language, and typical contract constructs (subscription, usage-based, and services). Select paid subscriptions were used only for company financials and news screening, along with patent databases to verify technology focus. The desk sources listed here are illustrative and not exhaustive, and many other public documents were also referred to for data collection, validation, and clarification.
Primary Interviews and Surveys
Primary work was used to stress-test what is counted as commerce cloud revenue and to avoid double counting across commerce, order management, and adjacent customer experience tools. We spoke with a mix of software providers, implementation partners, system integrators, and enterprise buyers across retail, consumer goods, and travel-led commerce, then reconciled differences by region and buying model.
Distribution of primary research fieldwork respondents
| Company type | Respondent position | Region |
|---|---|---|
| Top tier: 39% | CXOs: 14% | APAC: 45% |
| Mid tier: 45% | Functional/Unit leaders: 29% | EMEA: 29% |
| Smaller Players: 16% | Managers: 57% | Americas: 26% |
Market-Sizing & Forecasting
The core model starts with a top-down build where enterprise software spending and cloud adoption indicators are used to reconstruct an addressable pool for commerce platform workloads, which is then allocated using observed adoption by industry and region. To keep totals realistic, we corroborated results with selective bottom-up checks such as sampled subscription pricing ranges, typical implementation and support attach rates, and channel checks on deal sizes for mid-sized versus large enterprises.
A few inputs were treated as key sizing fingerprints because they can be validated repeatedly, including online retail sales growth, digital buyer penetration by region, the shift toward B2B digital ordering, typical cloud deployment mix (public, private, hybrid), and the pace of platform replacement cycles. Forecasts were built using scenario analysis, where the base case follows consensus expectations gathered in interviews on cloud migration timing, composable adoption, and contract renewal behavior. Where provider disclosures were limited, gaps were handled through peer-group benchmarking and careful normalization of revenues into consistent currency timing and annualization rules.
Data Validation & Update Cycle
Outputs are validated by triangulating the model totals against independent signals like e-commerce growth, enterprise cloud software budgets, and publicly discussed pipeline and renewal commentary. When large variances show up, assumptions are revisited, notes are rechecked, and selected experts are re-contacted so the driver behind the variance is clear before sign-off.
Each report is refreshed annually, and interim updates are made when material events change pricing, packaging, or demand conditions. Before delivery, an analyst performs a final pass across recent news and filings so clients receive the latest updated view aligned to the same market definition.
Mordor Intelligence's Commerce Cloud Market Size Compared Against Other Published Estimates
Published market numbers for commerce cloud often diverge because the scope line is drawn differently, and the pricing and revenue recognition assumptions then follow that choice. Timing can also affect comparability, since some publishers mix calendar years with fiscal years or convert currencies using different average rates.
The main gap comes from whether adjacent tools like general CRM suites, marketing automation, or broader cloud infrastructure are folded into the total, and that alone can swing the final figure. Counting only commerce platform and directly related commerce services, then validating growth using e-commerce sales indicators and cloud adoption checks, is how Mordor Intelligence keeps the estimate aligned to an actual transaction enablement demand pool.
Benchmark comparison
| Source | Market Size | Gaps in Research Methodology |
|---|---|---|
| Mordor Intelligence | USD 42.17 B (2026) | |
| Industry Newsletter A | USD 18.13 B (2024) | Uses an earlier base year and appears to apply a narrower revenue capture that can miss services attach and hybrid deployment related consumption, which reduces the starting value. |
| Trade Publication B | USD 25.75 B (2024) | Likely blends adjacent customer experience software and uses a different currency timing and growth path, which can lift the 2024 estimate and change comparability to a 2026 base. |
The spread in values is mostly explained by scope choices and timing, not by a disagreement that the category is growing. By keeping inclusions tied to commerce transaction enablement and checking assumptions against observable demand indicators, the result stays traceable and repeatable even when disclosure levels vary.


Key Questions Answered in the Report
What is the current commerce cloud market size?
The commerce cloud market size reached USD 42.17 billion in 2026 and is projected to hit USD 89.04 billion by 2031.
Which end-user vertical leads adoption?
Fashion & Apparel leads with 37.45% share thanks to advanced personalization and omnichannel strategies.
Who are the key players in Commerce Cloud Market?
Lightwell Inc. (IBM Corporation), Salesforce.com, Inc., SAP SE (maihiro GmbH), Oracle Corporation and BigCommerce Pty. Ltd. are the major companies operating in the Commerce Cloud Market.
What segment is growing fastest?
Grocery and Pharmaceuticals is expanding at an 18.12% CAGR as same-day delivery and inventory accuracy become critical.
Which region offers the highest growth?
Asia Pacific posts the fastest regional CAGR at 16.22%, driven by B2B digitization and mobile commerce adoption.
How big is the SME opportunity?
SMEs hold 55.40% of current revenue and grow at 16.88% CAGR, reflecting easier entry through subscription pricing and composable stacks.
What is the main barrier to migration?
High technical debt from legacy platforms and scarce cloud-native talent remain the leading hurdles, together trimming potential growth by more than 3%.
Page last updated on:


 Your data is secure and never sold or shared.


