Network Function Virtualization (NFV) Market Size and Share
Market Overview
| Study Period | 2020 - 2031 |
|---|---|
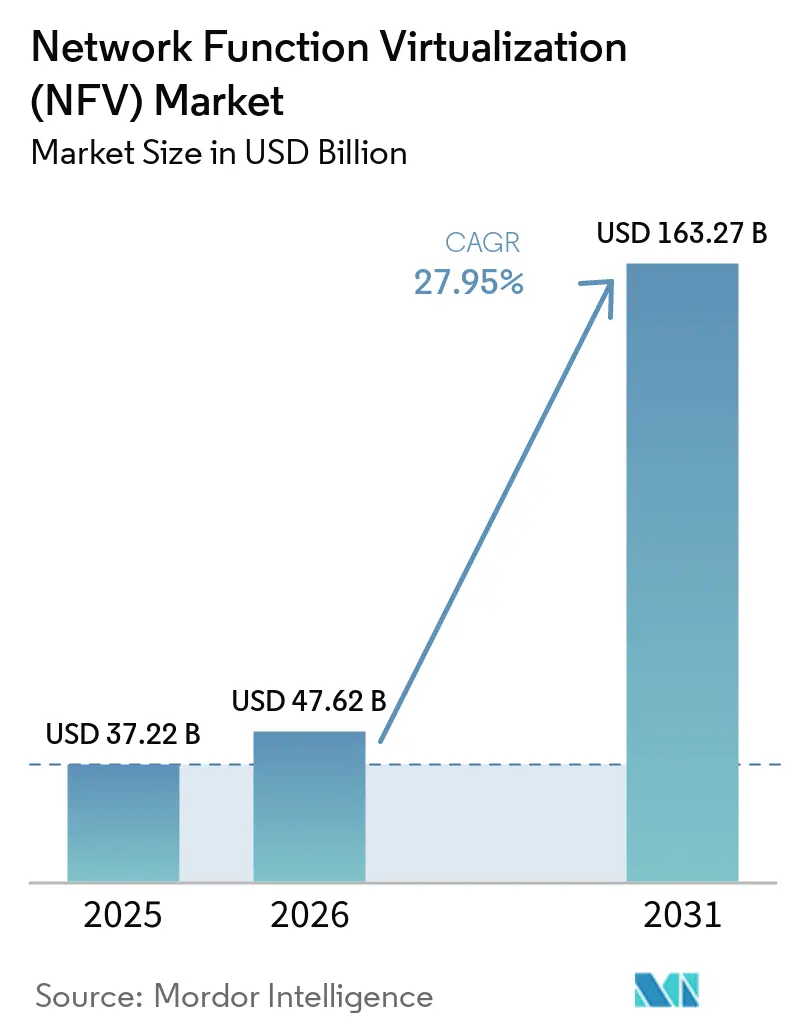
| Market Size (2026) | USD 47.62 Billion |
| Market Size (2031) | USD 163.27 Billion |
| Growth Rate (2026 - 2031) | 27.95% CAGR |
| Fastest Growing Market | Asia Pacific |
| Largest Market | North America |
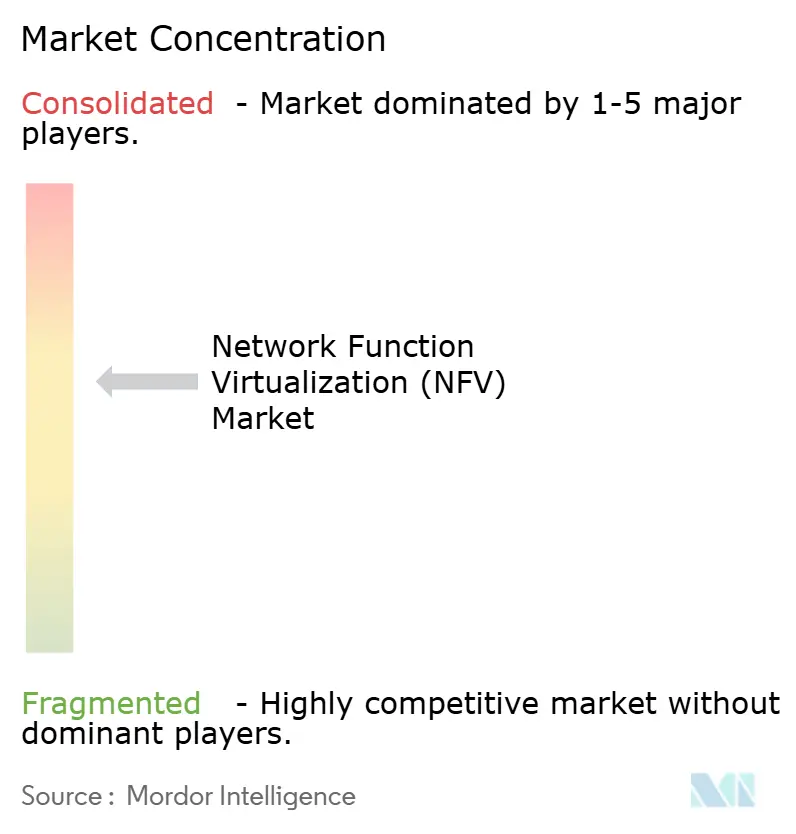
| Market Concentration | Medium |
Major Players*Disclaimer: Major Players sorted in no particular order Image © Mordor Intelligence. Reuse requires attribution under CC BY 4.0. | |
Network Function Virtualization (NFV) Market Analysis by Mordor Intelligence
The network function virtualization market size is expected to grow from USD 37.22 billion in 2025 to USD 47.62 billion in 2026 and is forecast to reach USD 163.27 billion by 2031 at 27.95% CAGR over 2026-2031. Accelerating adoption of cloud-native architectures, rapid 5G rollouts, and operators’ drive to convert capital expenses into operating expenses underpin this expansion. Commercial launches of network slicing, coupled with multi-access edge computing, are pulling virtualized network functions from centralized data centers into thousands of edge locations to satisfy latency-sensitive use cases. Open-source programs such as O-RAN and ONAP continue to erode legacy vendor lock-in, giving operators broader supplier choice while spurring new competitive dynamics.[1]ETSI, “Blog: AI and Open-Source Technologies Shaping Telco Cloud,” etsi.org Hardware refresh cycles remain robust for carrier-grade compute platforms, yet software-centric automation is growing faster as operators pursue zero-touch operations.
Key Report Takeaways
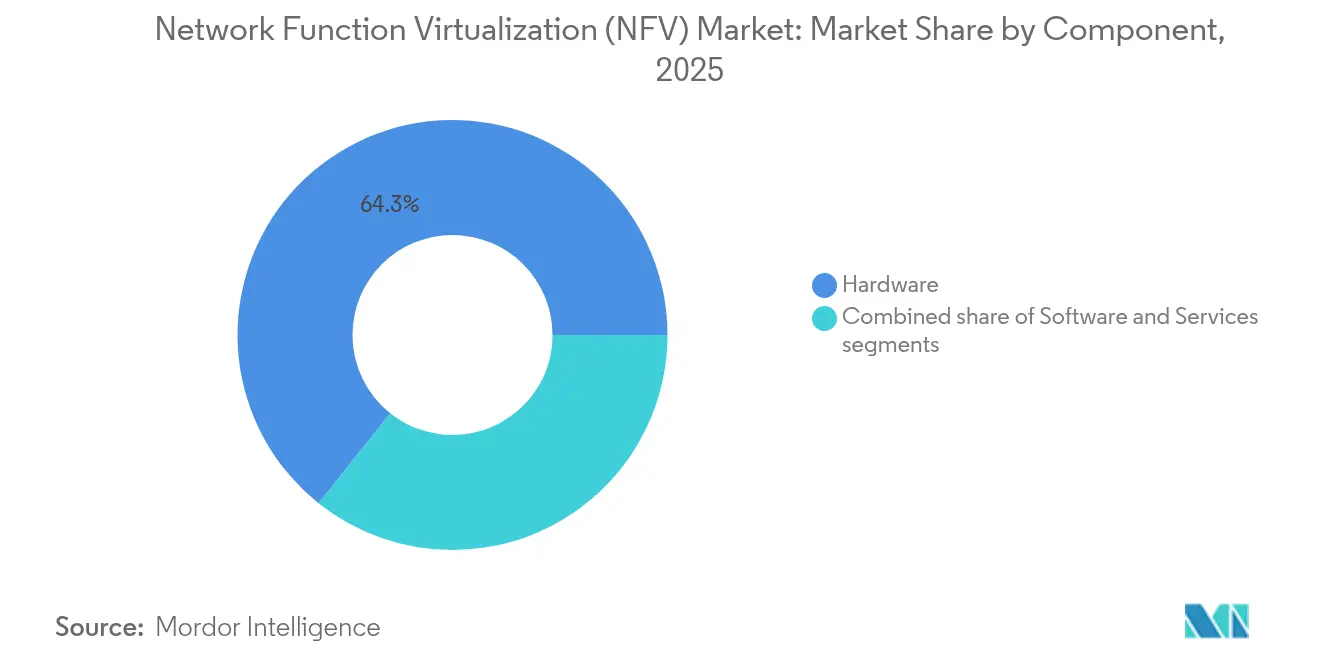
- By component: Hardware held 64.30% of the network function virtualization market share in 2025; software is slated for the fastest 29.2% CAGR through 2031.
- By application: Virtual appliances captured 44.65% of the network function virtualization market size in 2025, while orchestration and automation is expected to expand at 28.2% CAGR between 2026-2031.
- By end user: Telecom service providers commanded 49.90% share of the network function virtualization market size in 2025, whereas cloud service providers are forecast to grow at a 28.4% CAGR to 2031.
- By deployment mode: On-premise architectures represented 66.90% of the network function virtualization market share in 2025; hybrid and multi-cloud deployments show the highest 28.9% CAGR to 2031.
- By virtualized network function: Compute functions contributed 65.80% share of the network function virtualization market size in 2025; advanced traffic-management functions such as virtual load balancers should lead growth at 28.8% CAGR through 2031.
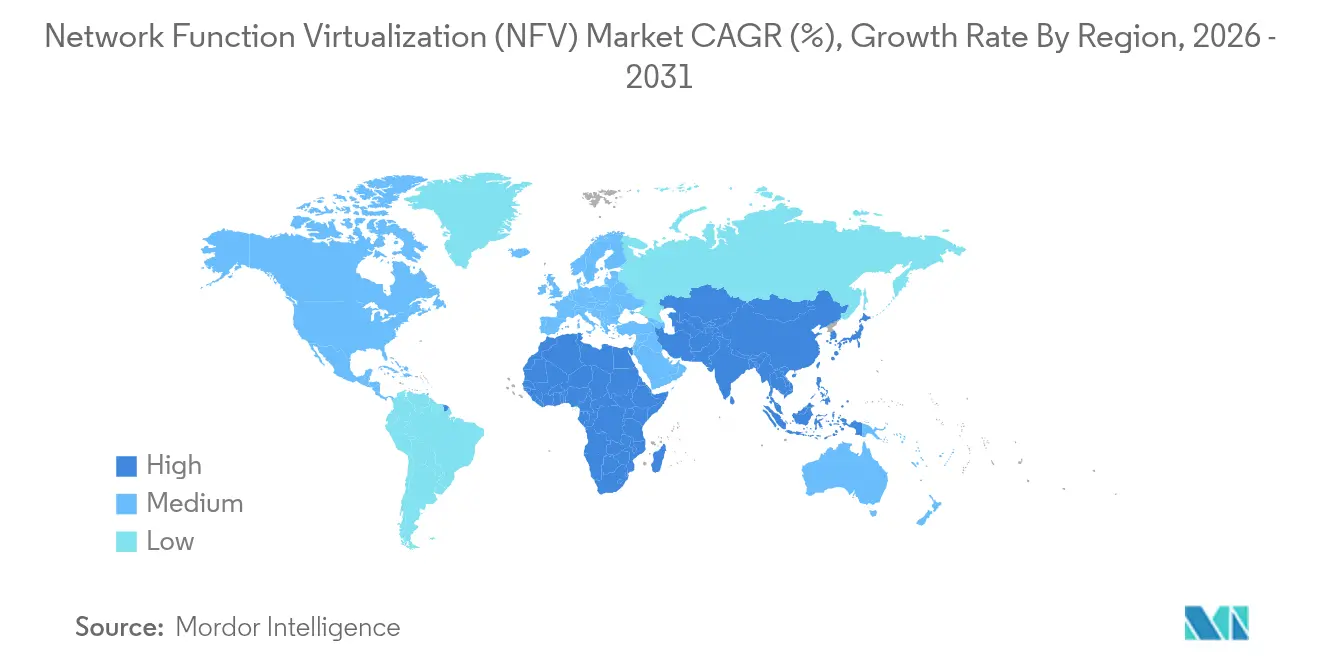
- By geography: North America led with a 37.60% network function virtualization market share in 2025, while Asia-Pacific is predicted to be the fastest region at 29.3% CAGR through 2031.
Note: Market size and forecast figures in this report are generated using Mordor Intelligence’s proprietary estimation framework, updated with the latest available data and insights as of 2026.
Global Network Function Virtualization (NFV) Market Trends and Insights
Drivers Impact Analysis*
| Driver | (~) % Impact on CAGR Forecast | Geographic Relevance | Impact Timeline |
|---|---|---|---|
| Rising demand for 5G and network slicing | +8.2% | Global (early North America, APAC) | Medium term (2-4 years) |
| Telco CAPEX-to-OPEX shift via cloud-native NFV infrastructure | +6.5% | Global | Long term (≥ 4 years) |
| Edge-cloud deployments for URLLC and mMTC | +5.1% | APAC core, spill-over North America and EU | Medium term (2-4 years) |
| AI-driven MANO and service assurance | +4.3% | North America and EU, expanding APAC | Long term (≥ 4 years) |
| Open-source ecosystems lowering vendor lock-in | +3.2% | Global | Medium term (2-4 years) |
| Private-5G adoption in Industry 4.0 | +2.5% | North America and EU factories | Short term (≤ 2 years) |
| Source: Mordor Intelligence | |||
Rising demand for 5G and network slicing
Network slicing lets operators create multiple isolated virtual networks on common infrastructure, each optimized for specific performance targets. By pairing software-defined networking with NFV, carriers dynamically allocate compute, storage, and transport resources to run new services in minutes rather than months. Early commercial slices span autonomous vehicle telemetry, robotic process automation, and smart-city sensor backhaul. The model supports differentiated pricing linked to latency or reliability, repositioning operators from bandwidth resellers to service enablers.
Telco CAPEX-to-OPEX shift via cloud-native NFV infrastructure
Containerized network functions and microservices allow operators to decompose monolithic network elements, spin them up rapidly, and pay only for the resources consumed. Dish’s public commitment to spend USD 10 billion on an all-cloud 5G network showcases the financial appeal of shifting fixed hardware cycles toward elastic software lifecycles[2]Intel, “Cloud-Native Architectures for 5G,” intel.com. Cost savings emerge not merely from cheaper hardware but from zero-touch provisioning and automated life-cycle management that cut field-engineering visits and manual configuration errors.
Edge-cloud deployments for URLLC and mMTC use-cases
Ultra-reliable low-latency communication and massive machine-type traffic drive operators to distribute compute resources closer to users. Placing virtualized packet core functions at regional hubs trims round-trip latency by over 30%, enabling real-time control of industrial robots and autonomous drones. Operators increasingly orchestrate workloads to move between core and edge clouds based on policy, traffic peaks, or application demands.
AI-Driven MANO and service assurance
Artificial intelligence is infiltrating management and orchestration layers, automating everything from VNF placement to predictive failure remediation. Machine-learning algorithms digest telemetry streams, forecast demand surges, and automatically scale functions before congestion occurs. Vendors report measurable improvements in mean-time-to-repair and energy savings when AI determines optimal resource allocations. Data quality and standardized interfaces remain prerequisites for achieving full self-organizing networks.
Restraints Impact Analysis*
| Restraint | (~) % Impact on CAGR Forecast | Geographic Relevance | Impact Timeline |
|---|---|---|---|
| Integration with legacy OSS/BSS stacks | -4.8% | Global (mature telecom markets) | Long term (≥ 4 years) |
| Multi-vendor VNF interoperability gaps | -3.2% | Global | Medium term (2–4 years) |
| Telco skill-set shortage for cloud-native operations | -2.7% | Asia-Pacific, Middle East, and emerging telecom markets | Medium term (2–4 years) |
| Security and compliance risks in disaggregated supply chain | -3.6% | North America, Europe, and regulated telecom sectors | Long term (≥ 4 years) |
| Source: Mordor Intelligence | |||
Open-Source ecosystems lowering vendor lock-in
The O-RAN specification disaggregates radio access networks into interoperable components, while ONAP delivers an open-source platform for end-to-end service orchestration. Carriers using open interfaces reduce single-vendor dependence and accelerate multivendor innovation cycles. Europe’s regulatory agenda actively promotes open architectures to strengthen digital sovereignty and curb concentration risk.
Private-5G adoption in Industry 4.0 driving on-prem NFV
Manufacturers deploy on-premise 5G cores and radio units to guarantee deterministic latency for machine automation. NFV makes it practical to host packet core, security, and analytics on compact edge servers inside factories, protecting intellectual property and meeting stringent uptime targets. Early adopters in automotive and semiconductor plants validate the model and set precedents for broader enterprise uptake.
Restraints Impact Analysis*
| Restraint | (~) % Impact on CAGR Forecast | Geographic Relevance | Impact Timeline |
|---|---|---|---|
| Integration with legacy OSS/BSS stacks | -4.8% | Global (mature markets) | Long term (≥ 4 years) |
| Multi-vendor VNF interoperability gaps | -3.2% | Global | Medium term (2-4 years) |
| Source: Mordor Intelligence | |||
Integration with legacy OSS/BSS stacks
Operational support and billing systems built for static hardware struggle with dynamic, elastic virtual functions. Inventory tools must recognise transient VNFs, and billing engines need real-time usage data to enable slice-based charging. Many carriers now run dual stacks while migrating, inflating operational complexity and delaying NFV benefits.
Multi-vendor VNF interoperability gaps
Despite ETSI specifications, onboarding each supplier’s VNF often entails bespoke integration scripts and exhaustive certification tests. Performance visibility across heterogenous chains is limited, forcing operators to assemble specialized monitoring solutions. Security policy harmonization across diverse code bases further complicates upgrades and patch cycles[3]Thales Group, “Multi-Vendor NFV Security Challenges,” thalesgroup.com.
*Our forecasts treat driver/restraint impacts as directional, not additive. The impact forecasts reflect baseline growth, mix effects, and variable interactions.
Segment Analysis
By Component: Hardware anchors, software accelerates
Hardware still underpins 64.30% of the 2025 network function virtualization market size because carrier-grade compute and acceleration cards guarantee predictable throughput during early 5G traffic spikes. Yet software revenues, propelled by container network functions and AI orchestration suites, are set to grow at 29.2% CAGR through 2031. A surge in hyper-converged edge platforms illustrates how operators bundle compute, storage, and switching in a single appliance optimized for cloud-native packets.
Software’s momentum is reinforced by open-source ecosystems that shorten development cycles and encourage community-driven innovation. As operators adopt GitOps and CI/CD pipelines, release cadences mirror cloud disciplines rather than hardware refresh timelines. This transition displaces bespoke appliances with programmable services deployable in minutes, reshaping vendor economics across the network function virtualization market.


By Application: Virtual appliances still lead
In 2025 virtual appliances—firewalls, vCPE, and vRAN—occupied 44.65% share of the network function virtualization market size. Orchestration and automation, however, will outpace all other categories at a 28.2% CAGR because service agility depends on intent-driven provisioning engines that coordinate thousands of distributed VNFs. Operators view automated closed-loop control as indispensable to monetizing network slices and maintaining quality of service amid exponential traffic growth.
Containerization is catalyzing application diversity. Edge Kubernetes clusters now host lightweight UPFs and user plane accelerators, enabling industrial IoT and immersive media workloads. Vendors integrate analytics and policy enforcement directly inside orchestrators, collapsing traditional boundaries between assurance and control domains. These innovations keep the network function virtualization market firmly on a software-first trajectory.
By End User: Telco core, cloud climbs
Telecom service providers controlled 49.90% of revenue in 2025, yet hyperscale cloud companies represent the fastest-growing buyer group at 28.4% CAGR. Cloud providers leverage established DevOps culture and global data-center footprints to deliver managed 5G core or private-network offerings, intensifying competition with traditional carriers. Enterprises spanning manufacturing, healthcare, and logistics adopt on-prem NFV stacks to secure data sovereignty while meeting deterministic latency.
This coexistence is redefining value chains. Carriers now collaborate with public clouds for regional breakout, but also deploy their own edge clouds for regulated services. The network function virtualization industry thus witnesses new partnership models and co-investment schemes to capture emerging revenue pools.
By Deployment Mode: Hybrid dominates growth
Although on-premise installations accounted for 66.90% share in 2025, hybrid and multi-cloud top the growth chart at 28.9% CAGR. Operators grade workloads: latency-critical user-plane functions stay local, analytics and non-real-time control migrate to private clouds, and test environments move to public hyperscalers. This blended model maximizes performance while containing cost risk, but demands federated orchestration that spans heterogeneous infrastructure.
Policy-based placement engines are maturing to automate function mobility between clouds as traffic patterns shift. Consequently, the network function virtualization market is leaning toward platform vendors capable of abstracting multiple clouds behind a single control layer, easing operational burdens while preserving regulatory compliance.

By Virtualized Network Function: Traffic management surges
Compute primitives—virtual routers and switches—delivered 65.80% of 2025 spending, forming the substrate for every service chain. Yet advanced traffic-management VNFs such as next-gen firewalls and application load balancers will expand at 28.8% CAGR. Microservices architectures create east-west traffic bursts that demand granular inspection and steering, fueling demand for programmable, AI-enhanced security and balancing tools.
Service-function-chaining frameworks now support intent-based path selection, ensuring packets traverse the right mix of security, acceleration, and policy nodes without manual intervention. This sophistication elevates software value capture relative to silicon, reinforcing long-term software ascendancy in the network function virtualization market.
Geography Analysis
North America’s 37.60% network function virtualization market share in 2025 stems from early virtualization initiatives by operators such as AT&T and the United States’ strategic push for secure, domestic 5G infrastructure leadership. Federal incentives for open-RAN research, coupled with ample capital access, accelerate commercial deployments. Canadian carriers follow similar trajectories, modernizing packet cores to increase agility and satisfy aggressive service-quality mandates.
Europe registers steady adoption as regulators prioritize digital sovereignty, sustainability, and competition. BEREC’s cloud-edge framework encourages open interfaces and federated cloud models that align naturally with NFV. Operators like Deutsche Telekom and Telefónica pilot AI-native orchestration and GitOps pipelines, demonstrating potential 5% greenhouse-gas reductions from dynamic workload consolidation. Fragmented national rules, however, prolong cross-border harmonization.
Asia-Pacific’s 29.3% CAGR makes it the powerhouse of future growth. China’s sweeping 5G rollout embeds virtualization from the radio to the core, while India’s modernization drive embraces software-defined architectures to meet exploding mobile-data demand. Japan and South Korea already run private 5G-enabled factories, validating low-latency edge clouds. Emerging ASEAN economies, unencumbered by legacy networks, jump straight to cloud-native deployments, broadening supplier opportunities across the network function virtualization market.

Competitive Landscape
Competition spans legacy equipment makers, hyperscale cloud providers, and pure-play software vendors. Ericsson, Nokia, and Huawei have refactored product lines around cloud-native cores, disaggregated RAN components, and CI/CD release cycles to protect installed bases while courting new revenue pools[5]Ericsson, “Security Standardization for Virtualized 5G Networks,” ericsson.com. Hyperscalers leverage serverless platforms and AI toolchains to deliver managed network-as-a-service offerings that undercut traditional procurement models. VMware’s absorption into Broadcom and Microsoft’s integration of Affirmed Networks illustrate strategic acquisitions that blend telco know-how with cloud scale.
Open-source participation now figures prominently in vendor differentiation. Contributions to O-RAN reference designs or ONAP modules signal commitment to interoperability, helping carriers de-risk multi-vendor rollouts. Meanwhile, edge-cloud orchestration startups promise simplified, container-first stacks devoid of NFV’s historical complexity, appealing to enterprises seeking turnkey private networks. As 5G-Advanced and early-stage 6G research magnify demands for AI-driven automation, software expertise will outweigh hardware lineage in determining long-term winners within the network function virtualization market.
Despite fragmentation, strategic alliances are proliferating. Operators increasingly sign framework deals that bundle radio, core, and orchestration with cloud expertise and professional services. This co-design approach accelerates time-to-revenue, but also shifts bargaining power toward partners capable of delivering end-to-end outcomes, further reshaping competitive contours across the network function virtualization industry.
Network Function Virtualization (NFV) Industry Leaders
Verizon Communications Inc.
AT&T Inc.
Huawei Technologies Co., Ltd.
Nokia Corporation
Ericsson AB
- *Disclaimer: Major Players sorted in no particular order

Recent Industry Developments
- June 2025: Ekinops acquired Olfeo to integrate secure-access functions into its SASE portfolio, broadening mid-market NFV security options.
- February 2025: GSMA released “The Mobile Economy 2025,” confirming 72 operator groups, representing 78.5% of global mobile connections, joined the Open Gateway initiative, signaling large-scale API-driven monetization strategies built on NFV infrastructure.
- January 2025: HCLTech issued a white paper detailing OSS transformation blueprints that align NFV and SDN domains to improve cross-layer visibility and data accuracy.
- March 2024: The European Commission’s BEREC published guidance on cloud-edge services, establishing a regulatory baseline for interoperable, federated cloud environments supportive of NFV.
- February 2024: Ericsson highlighted ETSI NFV-SEC advancements that harmonize security controls across heterogeneous orchestration stacks.


Global Network Function Virtualization (NFV) Market Report Scope
The Network Function Virtualization (NFV) market encompasses technologies and solutions that virtualize traditional network functions, such as firewalls, load balancers, and routers, to run on standard hardware rather than proprietary devices. This approach improves network scalability, flexibility, and cost efficiency by enabling dynamic provisioning and automated management of network resources. NFV is a key enabler for modern applications like 5G, edge computing, and IoT, transforming how networks are designed and operated.
The study delves deep into the trends and dynamics shaping the network function virtualization industry. The market size is estimated by monitoring the revenue streams of leading players providing NFV solutions and services. Additionally, the study scrutinizes the primary growth drivers and macroeconomic elements influencing the market's expansion.
The Network Function Virtualization (NFV) market is segmented by component (hardware, software, services), application (virtual appliances, core network virtualization), end user (telecom operators, enterprises (BFSI, retail, healthcare, manufacturing, other enterprises), and cloud service providers), and Geography (North America, Europe, Asia, Australia and New Zealand, Latin America, Middle East and Africa). The market sizes and forecasts are provided in terms of value (USD) for all the above segments.
| Hardware |
| Software |
| Services |
| Virtual Appliances (vCPE, vFW, vRAN) |
| Core Network Virtualization (vEPC, vIMS, vSR) |
| Orchestration and Automation |
| Telecom Service Providers | |
| Cloud Service Providers | |
| Enterprises | Banking, Financial Services, and Insurance (BFSI) |
| Retail and e-Commerce | |
| Healthcare and Life Sciences | |
| Manufacturing and Industrial | |
| Government and Defense |
| On-premise |
| Public Cloud |
| Hybrid / Multi-cloud |
| Compute (vRouter, vSwitch) |
| Storage |
| Network (vLoad Balancer, vSR) |
| North America | United States | |
| Canada | ||
| Europe | United Kingdom | |
| Germany | ||
| France | ||
| Italy | ||
| Spain | ||
| Russia | ||
| Rest of Europe | ||
| Asia-Pacific | China | |
| India | ||
| Japan | ||
| South Korea | ||
| Australia and New Zealand | ||
| Rest of Asia-Pacific | ||
| South America | Brazil | |
| Argentina | ||
| Rest of South America | ||
| Middle East and Africa | Middle East | Saudi Arabia |
| United Arab Emirates | ||
| Turkey | ||
| Rest of Middle East | ||
| Africa | South Africa | |
| Nigeria | ||
| Rest of Africa | ||
| By Component | Hardware | ||
| Software | |||
| Services | |||
| By Application | Virtual Appliances (vCPE, vFW, vRAN) | ||
| Core Network Virtualization (vEPC, vIMS, vSR) | |||
| Orchestration and Automation | |||
| By End User | Telecom Service Providers | ||
| Cloud Service Providers | |||
| Enterprises | Banking, Financial Services, and Insurance (BFSI) | ||
| Retail and e-Commerce | |||
| Healthcare and Life Sciences | |||
| Manufacturing and Industrial | |||
| Government and Defense | |||
| By Deployment Mode | On-premise | ||
| Public Cloud | |||
| Hybrid / Multi-cloud | |||
| By Virtualized Network Function | Compute (vRouter, vSwitch) | ||
| Storage | |||
| Network (vLoad Balancer, vSR) | |||
| By Geography | North America | United States | |
| Canada | |||
| Europe | United Kingdom | ||
| Germany | |||
| France | |||
| Italy | |||
| Spain | |||
| Russia | |||
| Rest of Europe | |||
| Asia-Pacific | China | ||
| India | |||
| Japan | |||
| South Korea | |||
| Australia and New Zealand | |||
| Rest of Asia-Pacific | |||
| South America | Brazil | ||
| Argentina | |||
| Rest of South America | |||
| Middle East and Africa | Middle East | Saudi Arabia | |
| United Arab Emirates | |||
| Turkey | |||
| Rest of Middle East | |||
| Africa | South Africa | ||
| Nigeria | |||
| Rest of Africa | |||


Key Questions Answered in the Report
What is the current size of the network function virtualization market?
The market is valued at USD 47.62 billion in 2026.
How large is the market expected to be by 2031?
It is projected to reach USD 163.27 billion by 2031, advancing at a 27.95% CAGR over 2026-2031.
Which geographic region is expanding the fastest?
Asia-Pacific leads growth with a 29.3% CAGR through 2031.
Why are telecom operators shifting from hardware appliances to software-based solutions?
Cloud-native NFV lets carriers convert capital expenses into operating expenses, automate network operations, and launch new services in minutes.
Which component segment is growing most quickly?
Software revenues are forecast to rise at a 29.2% CAGR, outpacing hardware and services.
What deployment model is seeing the strongest uptake?
Hybrid and multi-cloud architectures show the highest growth, with a 28.9% CAGR as operators blend on-premise, private, and public clouds for optimal performance and cost.
Page last updated on:


