Viral Inactivation Market Size and Share
Market Overview
| Study Period | 2020 - 2031 |
|---|---|
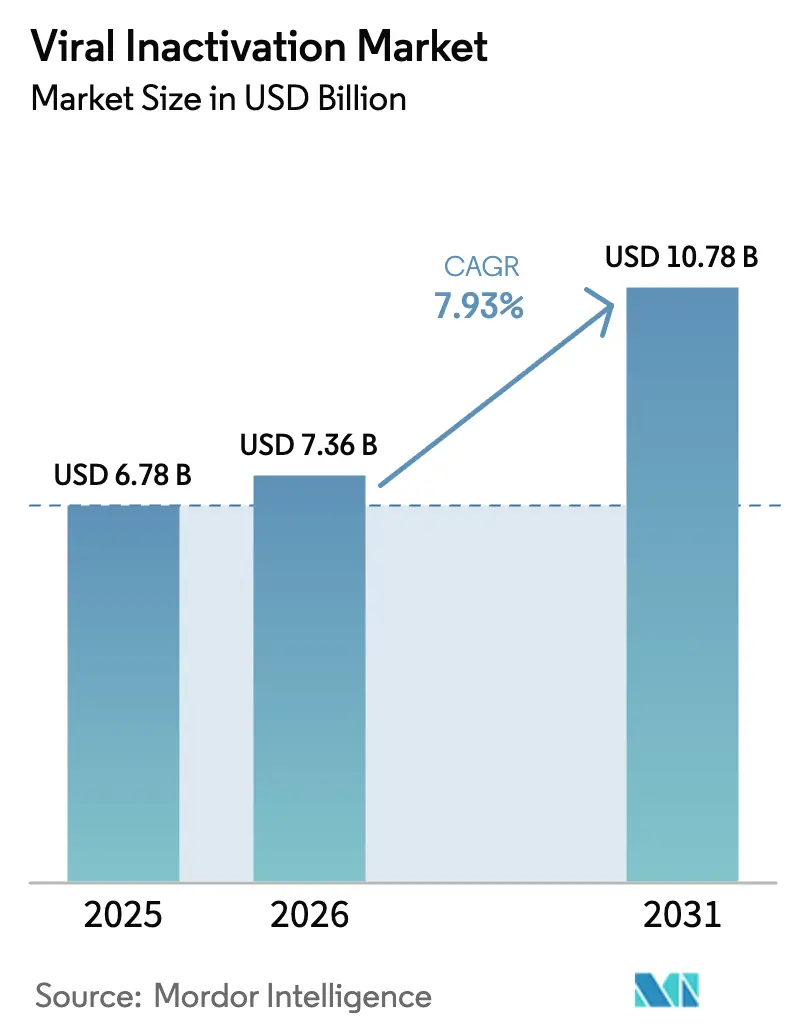
| Market Size (2026) | USD 7.36 Billion |
| Market Size (2031) | USD 10.78 Billion |
| Growth Rate (2026 - 2031) | 7.93% CAGR |
| Fastest Growing Market | Asia Pacific |
| Largest Market | North America |
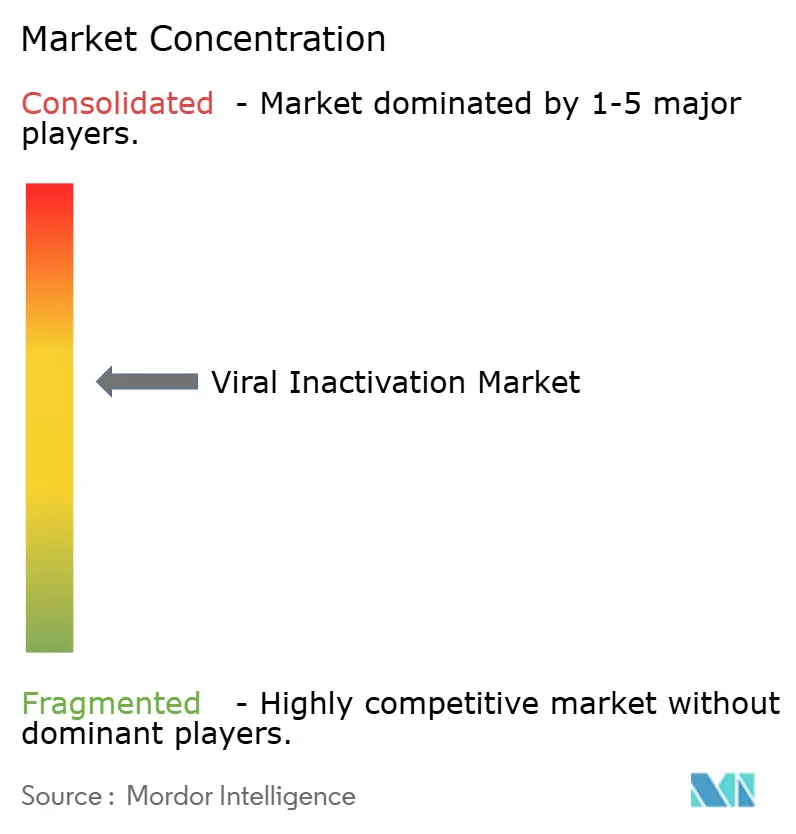
| Market Concentration | Medium |
Major Players*Disclaimer: Major Players sorted in no particular order Image © Mordor Intelligence. Reuse requires attribution under CC BY 4.0. | |
Viral Inactivation Market Analysis by Mordor Intelligence
The Viral Inactivation Market size was valued at USD 6.78 billion in 2025 and is estimated to grow from USD 7.36 billion in 2026 to reach USD 10.78 billion by 2031, at a CAGR of 7.93% during the forecast period (2026-2031).
This acceleration comes from a widening biologics pipeline, more vigilant regulators after contamination incidents, and the retirement of legacy detergents that dominated viral-clearance protocols. More than 2,100 gene-therapy programs were in development as of Q3 2025, and 44% of them use in vivo vectors that require rigorous viral-safety validation upstream in manufacturing. Global guidance also tightened; ICH Q5A(R2) embedded next-generation sequencing and quantitative PCR into routine viral-safety studies and formally covered continuous-manufacturing scenarios. Solvent-detergent protocols still account for the largest revenue share, yet low-pH adjustment is gaining ground because it suits high-titer monoclonal-antibody workflows and cuts hold times. Across products, single-use systems are displacing stainless-steel hardware, while end-users are turning to contract development and manufacturing organizations (CDMOs) for complex clearance studies. North America remains the largest regional spender, but Asia-Pacific is expanding quickest as Korean and Chinese CDMOs pour billions into new capacity.
Key Report Takeaways
- By method, solvent-detergent treatments led with 46.71% of viral inactivation market share in 2025, while low-pH adjustment is forecast to expand at an 11.48% CAGR through 2031.
- By product, kits and reagents captured 39.23% of revenue in 2025; viral-inactivation systems and accessories are projected to grow at a 12.23% CAGR between 2026 and 2031.
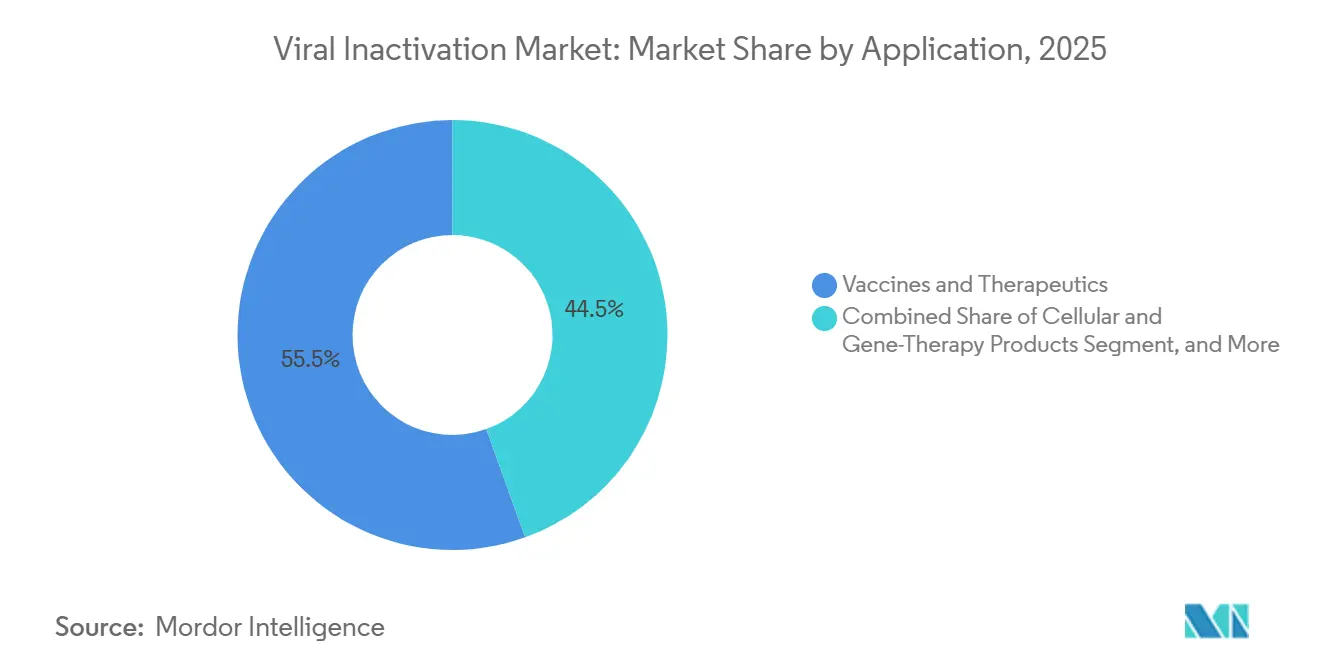
- By application, vaccines and therapeutics held 55.48% of the viral inactivation market in 2025, whereas cellular and gene-therapy products are set to grow at a 10.04% CAGR through 2031.
- By end-user, biopharma and biotechnology companies accounted for 60.46% of 2025 spending, but CDMOs are expected to record a 14.49% CAGR through 2031.
- By geography, North America accounted for 43.64% of revenue in 2025, yet Asia-Pacific is forecast to see a 13.16% CAGR through 2031.
Note: Market size and forecast figures in this report are generated using Mordor Intelligence’s proprietary estimation framework, updated with the latest available data and insights as of January 2026.
Global Viral Inactivation Market Trends and Insights
Drivers Impact Analysis*
| Driver | (~) % Impact on CAGR Forecast | Geographic Relevance | Impact Timeline |
|---|---|---|---|
| Expansion of Biologics & Gene-Therapy Pipelines | +2.1% | Global, with concentration in North America and Asia-Pacific | Long term (≥ 4 years) |
| Rising Incidence of Viral-Contamination Recalls | +1.4% | Global, acute in North America and Europe | Short term (≤ 2 years) |
| Stringent Global Regulatory Mandates for Viral Safety | +1.8% | Global, led by FDA, EMA, PMDA enforcement | Medium term (2-4 years) |
| Shift Toward Single-Use Bioprocessing Platforms | +1.3% | North America, Europe, expanding to Asia-Pacific | Medium term (2-4 years) |
| Phase-Out of Triton X-100 Accelerating Alternative Chemistries | +0.9% | Europe primary, spillover to North America | Short term (≤ 2 years) |
| AI-Enabled Real-Time Inline Viral-Safety Analytics | +0.4% | North America pilot sites, early Asia-Pacific adoption | Long term (≥ 4 years) |
| Source: Mordor Intelligence | |||
Expansion of Biologics & Gene-Therapy Pipelines
FDA approvals of Itvisma and Papzimeos in 2025 highlighted the regulatory expectation that adeno-associated virus (AAV) therapies demonstrate robust upstream viral inactivation against replication-competent AAV.[1]U.S. Food and Drug Administration, “Warning Letters and Regulatory Actions 2024-2025,” fda.gov The American Society of Gene and Cell Therapy documented 2,129 active gene-therapy programs in Q3 2025, nearly half of which used in vivo vectors that shift inactivation earlier in the process. Sponsors are installing dedicated skids upstream of chromatography, which raises capital outlays but compresses timelines by eliminating dilution steps. Biosimilar developers in emerging markets favor turnkey reagent kits that package detergent, buffer, and hold-vessel specifications to sidestep lengthy process-development work. ICH Q5A(R2) now allows platform viral clearance data when process similarity is proven, reducing the per-program validation burden.
Rising Incidence of Viral-Contamination Recalls
The FDA issued Complete Response Letters and warning letters to Coherus, Scholar Rock, and multiple CAR-T producers during 2024-2025 after detecting shortcomings in viral safety. These actions triggered the widespread adoption of dual orthogonal inactivation, which combines solvent-detergent treatment with a low-pH hold or nanofiltration, even when one step alone meets log-reduction targets. Plasma fractionators faced extra scrutiny after trace amounts of parvovirus B19 DNA were detected in post-market surveillance, prompting the European Medicines Agency to tighten documentation requirements in 2024.[2]European Medicines Agency, “Enhanced Viral-Inactivation Requirements for Plasma Products,” ema.europa.eu Manufacturers responded by extending detergent hold times and adding UV-C barriers for non-enveloped viruses. Collectively, these events reinforced the imperative for validated, multi-step clearance strategies across biologics portfolios.
Stringent Global Regulatory Mandates for Viral Safety
ICH Q5A(R2), effective January 2024, elevated next-generation sequencing and quantitative PCR from exploratory to recommended test methods, allowing earlier detection of low-titer adventitious agents.[3]International Council for Harmonisation, “ICH Q5A(R2): Viral Safety Evaluation of Biotechnology Products,” ich.org The guideline also addressed continuous manufacturing, obliging sponsors to confirm viral clearance during steady-state operation, rather than using batch-mode surrogates. In 2025, the FDA's draft guidance on viral-vector manufacturing instructed sponsors to test inactivation against model retroviruses and polyomaviruses, effectively doubling the number of spiking studies. Japan’s PMDA and China’s NMPA aligned with these expectations in 2024 and 2025, creating a unified triad that reduces region-specific studies while raising the global baseline for viral-safety data.
Shift Toward Single-Use Bioprocessing Platforms
Cytiva’s FlexFactory was expected to reach 50 global installations in 2025, each featuring single-use viral-inactivation hold bags that eliminate cleaning validation but introduce leachables challenges when harsh detergents come into contact with polyethylene films. Sartorius stepped in with pH-resistant disposable mixers manufactured at its Göttingen plant during the 2024 expansion. Repligen’s 2024 acquisition of Astrea Bioseparations deepened its affinity-chromatography expertise, enabling sponsors to integrate inactivation between capture and polishing without intermediate pooling. Plasma fractionators remain anchored to stainless-steel pasteurizers because 60 °C, 10-hour cycles exceed single-use thermal limits. Even so, FDA guidance now requires extractables studies covering inactivation conditions, adding 6 to 9 months to the timeline when switching from reusable to disposable hardware.
Restraints Impact Analysis*
| Restraint | (~) % Impact on CAGR Forecast | Geographic Relevance | Impact Timeline |
|---|---|---|---|
| High CAPEX for Advanced Inactivation Infrastructure | -1.2% | Global, acute for mid-tier CDMOs in Asia-Pacific and South America | Medium term (2-4 years) |
| Complex & Lengthy Validation / Regulatory Approval Cycles | -0.9% | Global, most pronounced in North America and Europe | Long term (≥ 4 years) |
| Supply-Chain Volatility for GMP-Grade Detergents & Filters | -0.6% | Global, episodic disruptions in Asia-Pacific and Europe | Short term (≤ 2 years) |
| Bioprocess Integration Challenges with Continuous Manufacturing | -0.5% | North America and Europe pilot sites | Long term (≥ 4 years) |
| Source: Mordor Intelligence | |||
High CAPEX for Advanced Inactivation Infrastructure
Inline systems that couple with perfusion bioreactors cost between USD 1.5 million and USD 3 million per line, a hurdle that small CDMOs in India and Brazil struggle to clear. Samsung Biologics’ USD 2.1 billion Songdo outlay covered dedicated viral-inactivation suites, yet mid-tier firms retrofit legacy vessels and accept longer cycles to hold capital spending down. Heat-inactivation pasteurizers exceed USD 800,000 each, and plasma fractionators often run six to eight units in parallel, tying up cash that could be used to fund process analytics upgrades. Gene-therapy sites face similar economic challenges, but with smaller batch sizes, which dilutes the return on invested capital and slows adoption.
Complex & Lengthy Validation / Regulatory Approval Cycles
Spiking studies still last 12-18 months because sponsors must demonstrate log-reduction against a panel of model viruses, then repeat the work whenever they switch detergents or tweak pH holds. The FDA’s 2025 viral-vector guidance now includes worst-case surrogate viruses in the test panel, increasing the study count and cost. Continuous-manufacturing pilots must demonstrate steady-state clearance with live virus; however, no standardized protocol exists for spiking a perfusion feed without compromising cell viability, resulting in ad hoc approaches and regulatory concerns. When Coherus received a Complete Response Letter in 2024 over viral-safety issues, the company lost 18 months and incurred a second round of clearance studies at a new CDMO.
*Our forecasts treat driver/restraint impacts as directional, not additive. The impact forecasts reflect baseline growth, mix effects, and variable interactions.
Segment Analysis
By Method: Solvent–Detergent Remains Dominant While Low-pH Gains Momentum
Solvent-detergent processing retained 46.71% of the viral inactivation market share in 2025, underpinned by its four-hour inactivation window and entrenched use in plasma pools. Low-pH adjustment, however, is forecast to post an 11.48% CAGR, outpacing the overall viral inactivation market by integrating seamlessly after protein-A capture in antibody lines. Heat-pasteurization stays niche at <15% of biologic volumes because many recombinant proteins denature above 50 °C. Nanofiltration and UV-C round out the toolkit for non-enveloped viruses but await broader validation before capturing a larger share.
The solvent-detergent’s strength also reflects regulators' confidence in its track record of eliminating HIV, HBV, and HCV from plasma pools ranging from 20,000 to 50,000 liters. Still, the EU ban on Triton X-100 forces requalification with new surfactants, stretching project timelines by a year. Low-pH users avoid chemical substitutions altogether, relying instead on buffer adjustments. Nanofiltration is rising in AAV and lentiviral manufacture; Planova cartridges demonstrated 6-log removal of minute virus of mice in 2024, prompting several CDMOs to pair 20-nm filters with pH holds for redundancy.


By Product: Systems Grow Faster Than Consumables
Kits and reagents accounted for 39.23% of revenue in 2025; however, single-use viral-inactivation systems are projected to grow at a 12.23% CAGR, the fastest among all products. Cytiva’s FlexFactory and Sartorius single-use mixers compress cleaning validation from weeks to hours, allowing CDMOs to swing quickly between campaigns.
Consumable margins remain under pressure because biosimilar producers in Asia price aggressively, leading suppliers to bundle detergents with pre-qualified tubing and bags. Validation-service revenue is climbing as ICH Q5A(R2) obliges sponsors to document viral clearance during steady state. Charles River and Texcell completed over 300 spiking studies in 2025, marking a shift toward outsourced expertise. Ancillary products, such as UV-C chambers and nanofiltration housings, occupy smaller niches but gain relevance where non-enveloped viruses dominate the risk profile.
By Application: Cell & Gene Therapies Outpace Traditional Vaccines
Vaccines and therapeutics comprised 55.48% of 2025 demand, yet cellular and gene-therapy products are forecast to post a 10.04% CAGR, making them the fastest-growing application segment. FDA approvals of AAV-based Itvisma and Papzimeos underscore regulators’ insistence on upstream inactivation against replication-competent AAV. Plasma products retain a stable niche because solvent-detergent treatment remains a regulatory requirement, although EU detergent bans prolong the need for revalidation.
Monoclonal-antibody producers leverage low-pH holds immediately after capture chromatography, taking advantage of naturally acidic eluates. CAR-T makers face a different hurdle: lentiviral transduction introduces the risk of replication-competent lentivirus, expanding demand for nanofiltration and dual solvent-detergent plus pH workflows. Diagnostic reagents and recombinant enzymes round out the “other applications,” yet the scale remains modest compared to therapeutic proteins.
By End-User: CDMOs Capture the Outsourcing Wave
Biopharma companies still commanded 60.46% of spending in 2025 because large innovators maintain internal capacity for blockbuster antibodies. However, CDMOs are expected to log a 14.49% CAGR thanks to early-phase outsourcing and complex gene-therapy programs that require specialized live-virus suites. Samsung Biologics added four 15,000-liter reactors and adjunct viral-inactivation suites in 2024, illustrating how scale players monetize full-service offerings. WuXi Biologics expanded its Singapore plant in 2025 to include inline pH-adjustment skids for viral-vector production, strengthening the Asia-Pacific’s supply base.
Contract research organizations (CROs) handle the viral-clearance testing that many sponsors lack facilities for, yet they represent roughly one-tenth of revenue. Academic and government centers handle niche biodefense and orphan therapy work but lack the volumes to influence overall growth. CDMOs differentiate by pairing GMP manufacturing with in-house spiking labs, slashing tech-transfer cycles, and attracting venture-backed biotech clients.
Geography Analysis
North America accounted for 43.64% of 2025 revenue, driven by a dense cluster of gene-therapy developers and an assertive FDA that issued multiple warning letters regarding contamination-control lapses between 2024 and 2025. The agency’s stance compels sponsors to deploy dual orthogonal inactivation even when single methods satisfy pharmacopeial benchmarks. Canada and Mexico contribute lower volumes, but they align their protocols with U.S. standards to preserve cross-border supply chains. Venture capital continues to fund viral-vector capacity in Massachusetts and California, reinforcing regional dominance.
Asia-Pacific is forecast to register a 13.16% CAGR to 2031. Korean incentives and Samsung Biologics’ USD 2.1 billion expansion underpin regional momentum, while WuXi Biologics’ Singapore build-out delivers viral-vector capability near Southeast Asian clinical hubs. India’s Biocon and Syngene retrofit downstream trains with low-pH holds to meet EU and U.S. export standards. China’s NMPA adopted ICH Q5A(R2) in 2025, accelerating uptake of platform viral-clearance approaches. Japan’s PMDA harmonized guidance in 2024, shortening validation cycles for multiregional trials.
Germany hosts key single-use hardware output from Sartorius, while the United Kingdom completed Nereid trials in 2025, securing an endocrine-safe solvent-detergent path. France and Italy’s plasma networks continue solvent-detergent plus heat workflows, whereas Spain’s biosimilar producers lean on low-pH alternatives. Switzerland and the Nordics supply contract testing and specialized filters. The Middle East and Africa invest gradually in plasma fractionation; the Gulf Cooperation Council aims for regional self-sufficiency but still imports most finished immunoglobulin. South America faces capital constraints; Brazil and Argentina maintain legacy solvent-detergent lines and have yet to mandate the substitution of Triton X-100.


Competitive Landscape
The viral inactivation market is moderately concentrated. No single player dominates validation services, which remain fragmented among Charles River, Thermo Fisher Scientific, and WuXi Biologics. Vendors attempt to lock in customers by integrating proprietary single-use bags, mixers, and detergents into turnkey skids. Repligen’s 2024 purchase of Astrea Bioseparations exemplified the race to embed affinity media that sit upstream of viral clearance, thereby controlling a broader segment of the downstream process.
Innovation focuses on sensors and surfactants. Vironova commercialized rapid TEM analytics that verify viral-particle removal within two hours, a sharp improvement over conventional assays. Croda and Merck launched REACH-compliant detergents in 2025 that mimic the log-reduction performance of Triton X-100 without using octylphenol ethoxylates. On the services side, CDMOs package live-virus spiking, downstream processing, and fill-finish under one contract to shorten client timelines. Yet, until inline virus detectors hit the market, clearance still hinges on off-line assays, preserving demand for specialized test labs.
Viral Inactivation Industry Leaders
Merck KGaA
Sartorius AG
Texcell SA
Cytiva (Danaher Corporation)
Parker Hannifin Corp
- *Disclaimer: Major Players sorted in no particular order

Recent Industry Developments
- February 2025: Thermo Fisher Scientific acquired Solventum’s purification and filtration unit for USD 4.1 billion, enlarging its bioproduction footprint.
- January 2025: Croda launched the Virodex surfactant range, delivering Triton X-100-free chemistries that meet EU REACH rules.
- August 2024: ViroCell Biologics closed an oversubscribed convertible note to scale GMP viral-vector production after U.K. MHRA licensure.
- July 2024: Avantor released J.T.Baker Cell Lysis Solution and Endonuclease to boost AAV harvest yields with lower environmental impact.
- May 2024: Merck KGaA finalized its USD 600 million acquisition of Mirus Bio, expanding its viral-vector manufacturing technology suite.


Research Methodology Framework and Report Scope
Market Definitions and Key Coverage
Our study defines the viral inactivation market as the sale of reagents, dedicated systems, and verification services that render contaminating viruses non-infectious during biopharmaceutical and vaccine manufacturing. This step is modeled only when its purpose is outright inactivation rather than removal or detection.
Scope exclusion: Stand-alone viral removal filters or nucleic-acid detection assays that do not integrate an inactivation procedure are excluded.
Segmentation Overview
- By Method
- Solvent-Detergent
- Low-pH Adjustment
- Pasteurization / Heat
- Other Methods
- By Product
- Viral Inactivation Systems & Accessories
- Kits & Reagents
- Validation & Testing Services
- Other Products
- By Application
- Vaccines & Therapeutics
- Blood & Plasma Products
- Cellular & Gene-Therapy Products
- Other Applications
- By End-User
- Biopharma & Biotechnology Companies
- Contract Development & Manufacturing Organizations (CDMOs)
- Contract Research Organizations (CROs)
- Other End-Users
- By Geography
- North America
- United States
- Canada
- Mexico
- Europe
- Germany
- United Kingdom
- France
- Italy
- Spain
- Rest of Europe
- Asia-Pacific
- China
- Japan
- India
- Australia
- South Korea
- Rest of Asia-Pacific
- Middle East & Africa
- GCC
- South Africa
- Rest of Middle East & Africa
- South America
- Brazil
- Argentina
- Rest of South America
- North America
Detailed Research Methodology and Data Validation
Primary Research
We engaged quality-control leads at contract development manufacturers, regulatory reviewers in North America and Europe, and process engineers at Asian vaccine plants. Their inputs clarified kit utilization rates, solvent-detergent phase-out timelines, and pricing pass-throughs that raw desk data could not fully explain. These dialogues also validated early model outputs before sign-off.
Desk Research
Mordor analysts began with public-domain pillars such as FDA process validation guidance, EMA Q5A(R2) revision notes, WHO Technical Report Series on biologicals, and CDC Biologics Red Book to frame regulatory baselines. Trade statistics for plasma-derived products from UN Comtrade, annual biologics approvals collated by the European Federation of Pharmaceutical Industries, and peer-reviewed journals in PubMed added volume trend context. Company 10-Ks, investor decks, and press releases then supplied average selling price ranges and capacity expansion news. Subscription sources, including D&B Hoovers for producer revenues and Dow Jones Factiva for transaction alerts, helped triangulate kit pricing and regional uptake. The listed references illustrate our desk work, yet many additional publications were consulted as needed.
Market-Sizing & Forecasting
A top-down construct starts with global commercial biologic batch volumes, rebuilt from licensed product outputs and average media requirements. Viral inactivation step prevalence factors are then applied. Results are cross-checked bottom-up by rolling up leading supplier revenues and sampled ASP × volume calculations to keep totals grounded. Variables that drive the model include new biologic approvals, installed single-use bioreactor liters, average kit cost per liter treated, regional GMP facility counts, and regulatory inspection frequency trends. Five-year projections employ a multivariate regression marrying biologics R&D spend, capital expansion announcements, and tightening viral safety guidelines, which our experts reviewed for plausibility. Any bottom-up gaps are filled through conservative interpolation using nearest peer benchmarks.
Data Validation & Update Cycle
Analysts run variance and anomaly screens, compare outputs against external biologics production indices, and escalate discrepancies for senior review. Reports refresh every twelve months, with interim recalculations if major regulation or contamination events occur. A final analyst check ensures clients receive the freshest market view.
Why Mordor's Viral Inactivation Baseline Earns Stakeholder Confidence
Published estimates often diverge because providers pick different scopes, input signals, and refresh rhythms.
Key gap drivers stem from whether services are bundled with removal tests, the aggressiveness of kit price erosion assumptions, and how producers translate regional currencies into USD. Mordor reports current demand, whereas some outlets publish partial segments or older study years, leading to headline gaps.
Benchmark comparison
| Market Size | Anonymized source | Primary gap driver |
|---|---|---|
| USD 7.43 billion | Mordor Intelligence | - |
| USD 0.793 billion | Regional Consultancy A | Narrow geographic cut to North America and vaccines only |
| USD 1.28 billion | Trade Journal B | Relies chiefly on patent counts; limited primary validation |
| USD 5.47 billion | Global Consultancy C | Bundles viral removal and detection within totals, inflating overlap |
The comparison shows that our disciplined scope selection, dual-sourced variables, and annual refresh cadence deliver a balanced, transparent baseline that decision-makers can trace back to clear assumptions.


Key Questions Answered in the Report
What is the projected value of the viral inactivation market in 2031?
The market is forecast to reach USD 10.78 billion by 2031, reflecting a 7.93% CAGR from 2026 to 2031.
Which viral inactivation method is growing fastest through 2031?
Low-pH adjustment is expected to post the highest CAGR at 11.48% as antibody manufacturers integrate shorter holds into downstream purification.
Why are CDMOs expanding rapidly in viral inactivation services?
Sponsors outsource complex clearance studies and GMP suites, driving CDMOs to a projected 14.49% CAGR between 2026 and 2031.
How does the Triton X-100 ban affect manufacturers?
EU restrictions require revalidation with alternative surfactants, such as Virodex TXR-1, which extends timelines by up to 18 months and increases reagent costs.
Which region is expected to record the highest growth rate?
Asia-Pacific is set to expand at 13.16% CAGR, buoyed by major capacity additions in South Korea, Singapore, and China.
Page last updated on:


