Viral Vector And Plasmid DNA Manufacturing Market Size and Share
Market Overview
| Study Period | 2020 - 2031 |
|---|---|
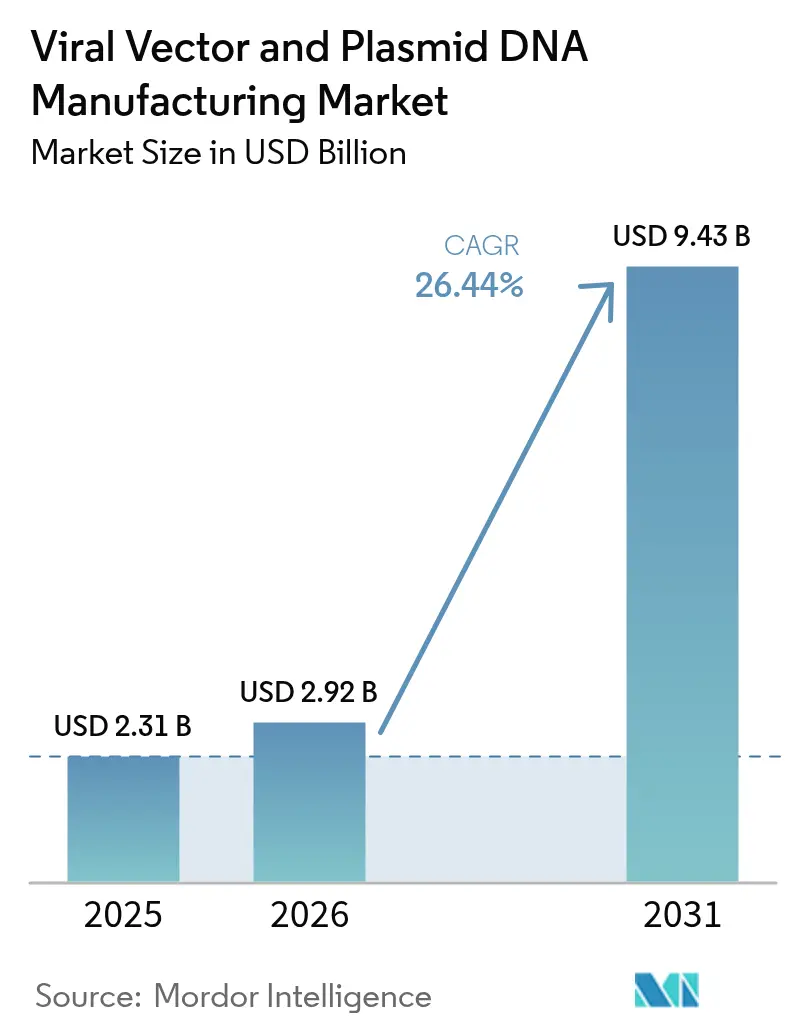
| Market Size (2026) | USD 2.92 Billion |
| Market Size (2031) | USD 9.43 Billion |
| Growth Rate (2026 - 2031) | 26.44% CAGR |
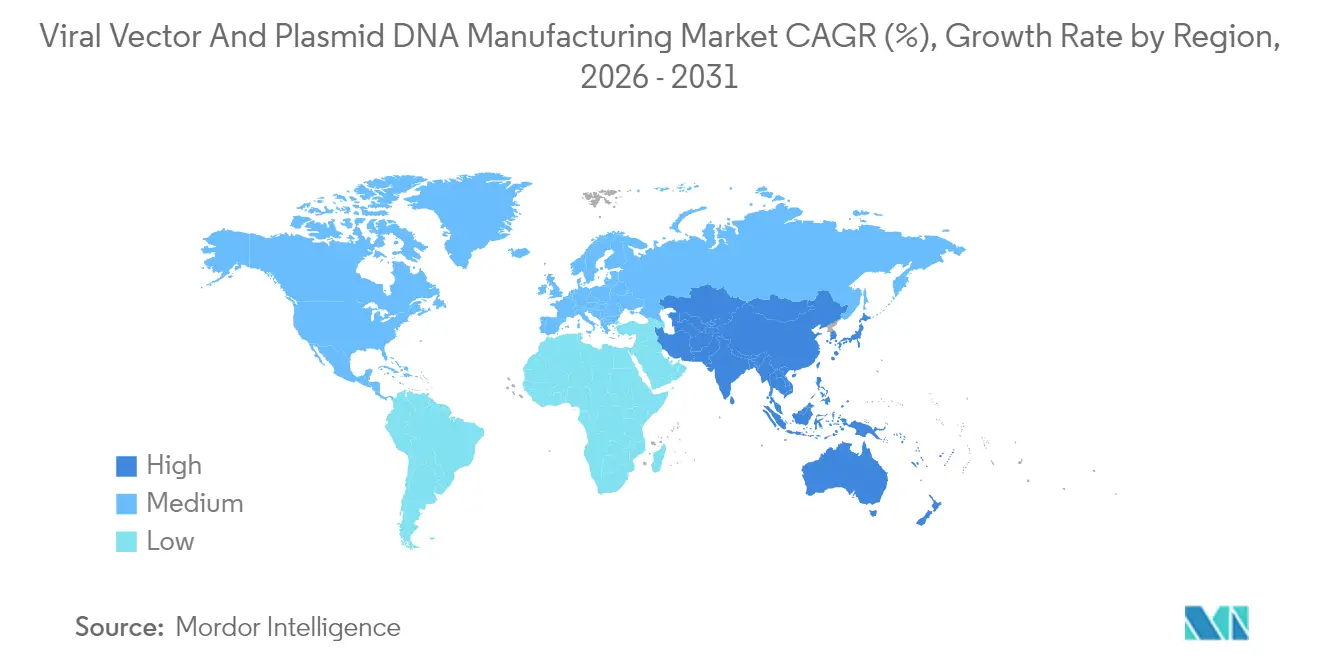
| Fastest Growing Market | Asia Pacific |
| Largest Market | North America |
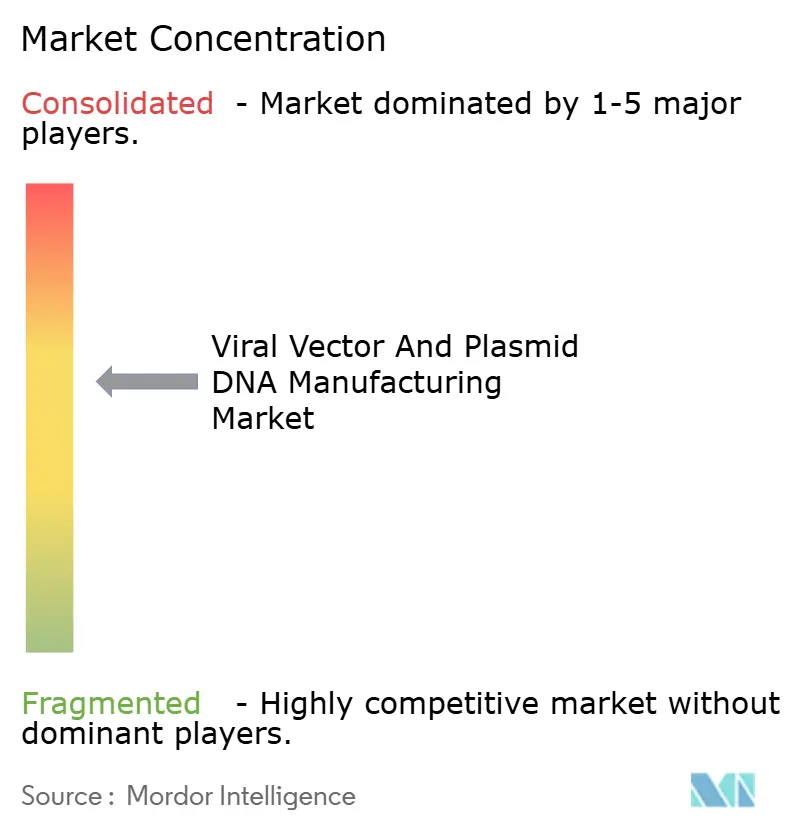
| Market Concentration | Medium |
Major Players *Disclaimer: Major Players sorted in no particular order Image © Mordor Intelligence. Reuse requires attribution under CC BY 4.0. | |
Viral Vector And Plasmid DNA Manufacturing Market Analysis by Mordor Intelligence
The viral vectors and plasmid DNA manufacturing market size in 2026 is estimated at USD 2.92 billion, growing from 2025 value of USD 2.31 billion with 2031 projections showing USD 9.43 billion, growing at 26.44% CAGR over 2026-2031. Demand accelerates as more gene therapies win regulatory approvals, personalized medicine becomes routine, and production technologies mature enough for commercial scale. Supply remains tight because global GMP capacity lags sharply behind the clinical pipeline, pushing sponsors toward specialized CDMOs and spurring wave after wave of facility expansions and acquisitions. Viral vectors continue to dominate shipments, yet non-viral approaches gain traction as developers try to curb cost, simplify scale-up, and limit immunogenicity. North America retains leadership in approvals and spend, but Asia-Pacific attracts the next tranche of factories as governments fund local biologics hubs and innovators chase lower operating outlays.
Key Report Takeaways
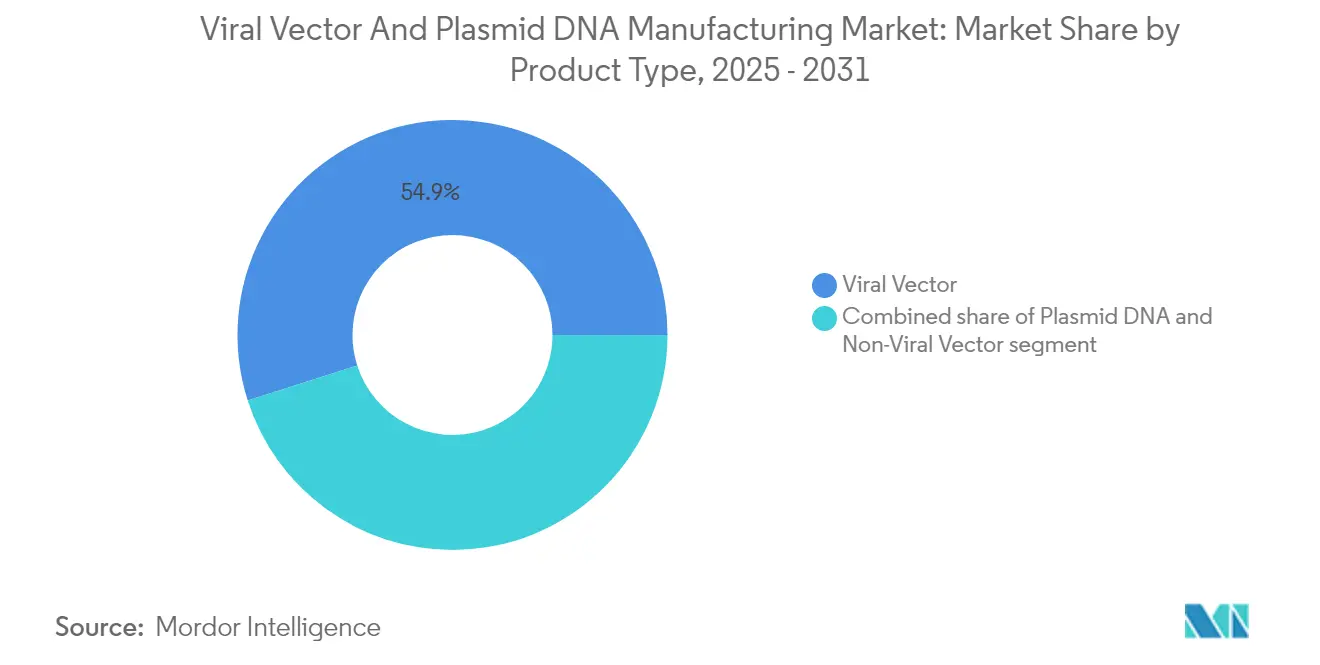
- By product type, viral vectors led with 54.92% of the viral vectors and plasmid DNA manufacturing market share in 2025, while non-viral vectors are projected to grow at a 29.12% CAGR to 2031.
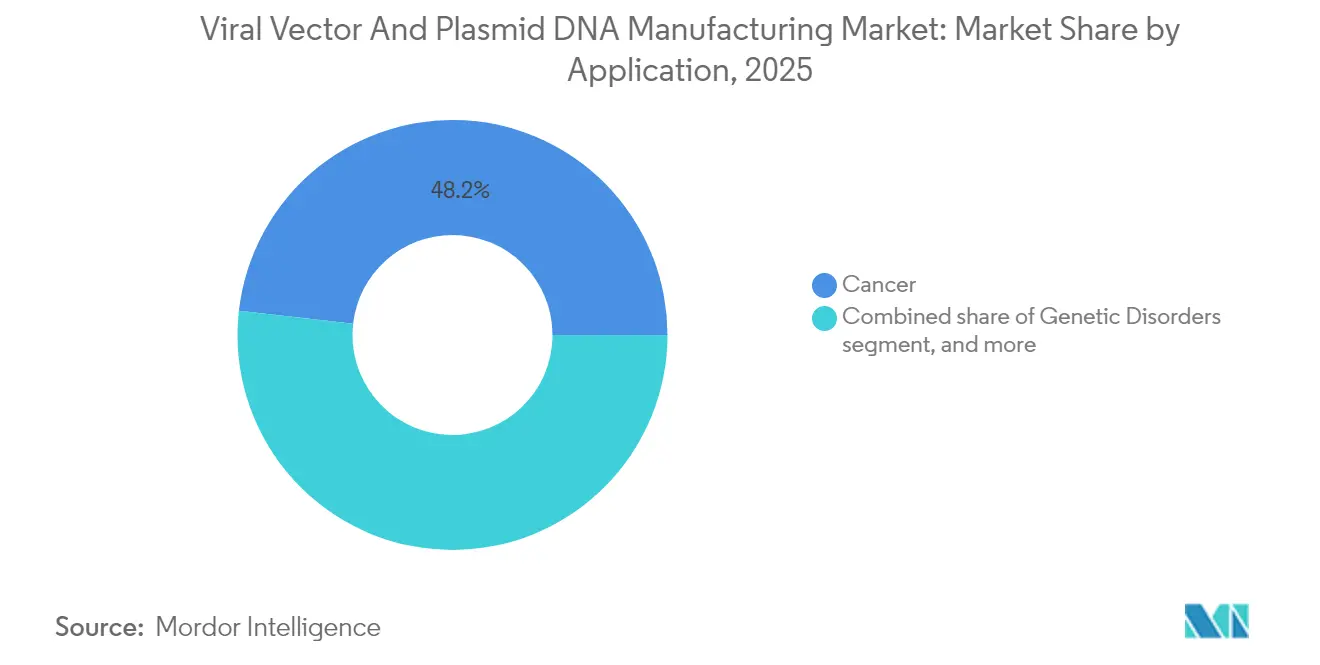
- By application, cancer accounted for 48.21% share of the viral vectors and plasmid DNA manufacturing market size in 2025, whereas infectious diseases are advancing at a 29.58% CAGR through 2031.
- By geography, North America held 42.11% revenue share in 2025; Asia-Pacific is set to expand at a 28.02% CAGR during 2026-2031.
Note: Market size and forecast figures in this report are generated using Mordor Intelligence’s proprietary estimation framework, updated with the latest available data and insights as of 2026.
Global Viral Vector And Plasmid DNA Manufacturing Market Trends and Insights
Drivers Impact Analysis*
| Driver | % Impact on CAGR Forecast | Geographic Relevance | Impact Timeline |
|---|---|---|---|
| Rising incidence of genetic and chronic diseases | +4.2% | Global, with higher prevalence in developed markets | Long term (≥ 4 years) |
| Growing pipeline of gene and cell therapies | +6.8% | North America and Europe leading; Asia-Pacific emerging | Medium term (2-4 years) |
| Expanding adoption of viral vectors in vaccines and novel modalities | +5.1% | Global, pandemic-driven acceleration | Short term (≤ 2 years) |
| Increasing outsourcing to specialized CDMOs | +3.9% | North America & Europe core; expanding worldwide | Medium term (2-4 years) |
| Technological advancements in scalable vector production platforms | +4.7% | Technology hubs in US, EU and Asia-Pacific | Long term (≥ 4 years) |
| Supportive regulatory and funding environment for advanced therapies | +2.5% | Primarily developed markets, spreading to emerging regions | Medium term (2-4 years) |
| Source: Mordor Intelligence | |||
Rising Incidence of Genetic and Chronic Diseases
More patients receive precise diagnoses for rare genetic disorders and chronic conditions, and many of those indications now have either approved or late-stage gene therapies in view. Recently cleared products such as Zevaskyn and Kebilidi show that authorities are willing to green-light advanced treatments for historically intractable illnesses, driving steady vector demand. The epidemiological transition toward older populations amplifies chronic disease prevalence, creating a durable pool of candidates for one-time gene replacement. Rare-disease incentives, including streamlined reviews and market exclusivity, further fortify the outlook. Combined, these factors add material volume to the viral vectors and plasmid DNA manufacturing market.
Growing Pipeline of Gene and Cell Therapies
More than 2,000 gene-therapy programs now populate global registries, with adeno-associated viruses (AAV) still the most common payload. The FDA’s Platform Technology Designation for Sarepta’s rAAVrh74 template encourages reuse of well-characterized vectors, cutting both cost and timeline[1]U.S. Food and Drug Administration, “Platform Technology Designation Granted to Sarepta’s rAAVrh74,” fda.gov. Drug makers have followed with bricks-and-mortar commitments such as Novartis’ EUR 40 million EU vector plant, ensuring slots for late-stage assets . Developers that secure capacity early can move rapidly from Phase II data to launch. The steady clinical queue therefore locks in multi-year production visibility and underpins expansion across the viral vectors and plasmid DNA manufacturing market.
Expanding Adoption of Viral Vectors in Vaccines and Novel Modalities
COVID-19 validated viral vectors for rapid vaccine scale-up, and platforms now target endemic pathogens and therapeutic vaccines. New adenoviral serotypes and capsid engineering help skirt pre-existing immunity, while bovine adenoviruses deliver promising intranasal responses. Lentiviral constructs venture into inhaled formulations for cystic fibrosis, and AAVs increasingly serve as vectored immunotherapies that drive robust, durable immunity. These non-oncology use cases diversify revenue streams and support continued factory builds across the viral vectors and plasmid DNA manufacturing market.
Technological Advancements in Scalable Vector Production Platforms
Single-use bioreactors, continuous purification, and digital twins shorten turnaround and trim contamination risk. Platform workflows can slash viral-vector cost of goods by as much as 40% while preserving potency. Real-time capacitance sensing tightens process control, raising yields and easing batch-to-batch variation[2]BioProcess International, “Capacitance Sensors Boost Viral Vector Yields,” bioprocessintl.com. Machine-learning engines from firms like Dyno Therapeutics re-engineer capsids for higher payload and lower dose. Collectively, these tools unlock greater volume and lower unit cost for the viral vectors and plasmid DNA manufacturing market.
Restraints Impact Analysis*
| Restraints Impact Analysis | (~) % Impact on CAGR Forecast | Geographic Relevance | Impact Timeline |
|---|---|---|---|
| High manufacturing and capital costs | -3.8% | Global, with greater impact on emerging markets | Medium term (2-4 years) |
| Limited global GMP production capacity | -4.2% | Worldwide shortage, regional variations | Short term (≤ 2 years) |
| Complex and evolving regulatory requirements | -2.7% | Most pronounced in multi-jurisdictional programs | Medium term (2-4 years) |
| Supply-chain dependence on specialized raw materials | -2.3% | Global, especially where import lead-times are long | Short term (≤ 2 years) |
| Source: Mordor Intelligence | |||
High Manufacturing and Capital Costs
A single gene-therapy course can cost USD 1 million, and viral vector inputs often consume up to 40% of that bill[3]The CRISPR Journal, “Cost Drivers in Gene Therapy Manufacturing,” crisprjournal.com. While Brazil showed a path to USD 35,000 CAR-T pricing through local production, most health systems struggle to pay at scale. Outcome-based contracts help spread risk, but smaller biotech firms still face heavy upfront investment to secure slots or build plants. Automation and standardized platforms promise relief, yet they require multimillion-dollar capital outlays that only deep-pocketed sponsors can afford. These costs temper penetration of the viral vectors and plasmid DNA manufacturing market, especially in lower-income regions.
Limited Global GMP Production Capacity
Industry surveys suggest available viral raw material meets under 1% of future global vector demand. Mega-projects like Fujifilm Diosynth’s USD 8 billion build and Samsung Biologics’ Plant 5 help but cannot close the gap quickly. Supply chain kinks, from specialized resins to trained staff, exacerbate delays. Developers therefore lock in CDMO agreements years before pivotal readouts, creating barriers for newer entrants and raising program risk. The mismatch constrains throughput for the viral vectors and plasmid DNA manufacturing market until additional capacity comes online.
*Our forecasts treat driver/restraint impacts as directional, not additive. The impact forecasts reflect baseline growth, mix effects, and variable interactions.
Segment Analysis
By Product Type: Viral Vectors Dominate Despite Non-Viral Momentum
Viral vectors accounted for 54.92% of the viral vectors and plasmid DNA manufacturing market in 2025, supported by well-established regulatory precedents and strong transfection efficiency. Non-viral vectors deliver the fastest 29.12% CAGR through 2031, propelled by lipid nanoparticles, polymer conjugates, and electroporation systems that bypass immunity hurdles. Plasmid DNA remains the backbone for both categories, serving as the starting template for viral assembly and as the therapeutic construct in direct injection approaches.
The viral vectors and plasmid DNA manufacturing market size for viral vectors is projected to widen further as newly approved products such as Casgevy and Elevidys transition to commercial scale. AAV and lentiviral lines dominate oncology and rare-disease pipelines thanks to durable expression and tissue tropism. Yet manufacturing complexity keeps cost high, motivating drug sponsors to trial scalable non-viral carriers. Lipid nanoparticle expertise gained in mRNA COVID-19 vaccines can be leveraged for plasmid and siRNA delivery, helping non-viral methods chip away at share. Partnerships between nanoparticle specialists and legacy biologics CDMOs have already started to expand total factory utilization, indicating that both modalities will coexist within the viral vectors and plasmid DNA manufacturing market.


By Application: Cancer Continues to Lead as Infectious Disease Surges
Cancer represented 48.21% of 2025 revenue, anchored by commercial CAR-T therapies and a full slate of autologous constructs entering pivotal trials. Infectious disease applications show the swiftest 29.58% CAGR through 2031, as adenoviral and AAV vaccine backbones remain central to pandemic preparedness programs. Gene-replacement products for ophthalmic and neurologic disorders add further depth, yet their absolute volumes stay modest relative to oncology and vaccines.
The viral vectors and plasmid DNA manufacturing market size tied to cancer indications is forecast to rise steadily because multiple solid-tumor CAR-T and TCR products approach launch. Cost pressure triggers process intensification and automated cell-handling lines, boosting vector demand in parallel. On the infectious-disease front, governments stockpile next-generation vector vaccines to guard against respiratory viruses and emerging zoonoses, providing predictable offtake. These twin growth engines give manufacturers confidence to extend capacity, reinforcing the virtuous cycle that underpins the viral vectors and plasmid DNA manufacturing market.
Geography Analysis
North America controlled 42.11% of 2025 revenue, sustained by FDA leadership, large venture funding pools, and a deep clinical-trial ecosystem. Major transactions like Lonza’s USD 1.2 billion takeover of a Vacaville plant and Charles River’s purchase of Vigene Biosciences illustrate the region’s appetite for vertical integration. Skilled labor shortages and raw-material chokepoints do persist, but concerted workforce programs and reshoring incentives aim to close gaps. Overall, the viral vectors and plasmid DNA manufacturing market still finds its highest pricing and most reliable regulatory pathway in the United States.
Asia-Pacific shows the strongest 28.02% CAGR outlook as multinational firms and domestic champions build new suites in China, South Korea, India, and Australia. VectorBuilder’s USD 500 million Guangzhou campus and WuXi Biologics’ continual expansions reflect Beijing’s emphasis on localizing critical modalities, while India’s Bharat Biotech commits USD 75 million to its inaugural CGT plant. Regional authorities streamline approvals and offer tax credits, bringing down cost per liter and widening patient access. These moves rapidly enlarge the viral vectors and plasmid DNA manufacturing market in the region and diversify global supply lines.
Europe retains a mature yet evolving position. EMA guidelines give predictable review timelines, and cross-border consortia channel Horizon Europe funds into advanced-therapy infrastructure. Novartis’ EUR 40 million Slovenian vector expansion underscores corporate confidence despite reimbursement variations across member states. Post-Brexit, the United Kingdom pursues parallel regulatory schemes to stay attractive for trials and manufacturing. Latin America and Middle East/Africa trail in absolute terms, but Brazil’s cost-effectiveness breakthroughs and Gulf sovereign investment vehicles hint at fresh capacity additions. Collectively, geographical diversification spreads risk and adds resilience to the viral vectors and plasmid DNA manufacturing market.

Competitive Landscape
The viral vectors and plasmid DNA manufacturing market is moderately fragmented. Integrated CDMOs such as Lonza, Thermo Fisher Scientific, and Catalent command premium pricing because they combine process development, GMP suites, and regulatory support. Mid-tier specialists like Oxford Biomedica and AGC Biologics target specific vector families to differentiate on know-how. Capacity decisions increasingly shape competitive positioning, and firms with spare clean-room slots often dictate timelines for smaller developers.
M&A activity remains brisk. Merck KGaA bought Mirus Bio for USD 600 million, adding transfection reagents that improve upstream titers. Charles River folded Vigene Biosciences into its network to offer seamless discovery-to-commercial services. These deals compress supply chains and promise faster tech-transfer turnarounds, attributes prized by venture-backed biotech firms. Strategic alliances also proliferate. Cytiva joined forces with Cellular Origins to commercialize a modular cell-therapy production platform, blending single-use hardware and digital analytics to shrink footprints and labor overhead.
Disruptors push new models. Dyno Therapeutics applies AI for rational capsid design, seeking licensing royalties rather than plant ownership. Asia-Pacific CDMOs advertise 30%-plus cost savings against Western peers, though sponsors weigh geopolitical and IP concerns. Thermo Fisher’s 2024 decision to exit certain vector services exposed the operational complexity involved and temporarily tightened supply, giving remaining competitors pricing power. Overall, innovation depth and capital intensity ensure that scale players preserve an edge, but nimble newcomers can still win share by solving specific pain points within the viral vectors and plasmid DNA manufacturing market.
Viral Vector And Plasmid DNA Manufacturing Industry Leaders
Lonza Group
Thermo Fisher Scientific, Inc.
Catalent Inc.
Oxford Biomedica
Fujifilm Diosynth Biotechnologies
- *Disclaimer: Major Players sorted in no particular order

Recent Industry Developments
- June 2025: Sarepta paused Elevidys shipments after a second patient death from liver failure, prompting new immunosuppression requirements.
- June 2025: FDA assigned Platform Technology Designation to Sarepta’s rAAVrh74 template, enabling modular gene-therapy submissions.
- March 2025: Boehringer Ingelheim dosed the first patient in LENTICLAIR 1, testing inhaled lentiviral therapy for cystic fibrosis.
- March 2025: Bharat Biotech committed USD 75 million to India’s first dedicated viral vector facility in Hyderabad.
- February 2025: FDA cleared Kebilidi for AADC deficiency, the first intracerebral AAV gene therapy in the United States.


Research Methodology Framework and Report Scope
Market Definitions and Key Coverage
Mordor Intelligence defines the viral vectors and plasmid DNA manufacturing market as the value generated from current-good-manufacturing-practice (cGMP) production of recombinant viral particles (AAV, lentivirus, adenovirus, retrovirus, others) and therapeutic-grade plasmid backbones that serve as raw material or final active substance for in-vivo gene therapy, ex-vivo cell therapy, DNA vaccines, and RNA platform support.
Scope Exclusion: research-only or diagnostic-grade vectors produced outside cGMP suites are excluded to avoid inflating the addressable spend.
Segmentation Overview
- By Product Type
- Plasmid DNA
- Viral Vector
- Non-Viral Vector
- By Application
- Cancer
- Genetic Disorders
- Infectious Diseases
- Ophthalmic Disorders
- Neurological Disorders
- Other Applications
- Geography
- North America
- United States
- Canada
- Mexico
- Europe
- Germany
- United Kingdom
- France
- Italy
- Spain
- Rest of Europe
- Asia-Pacific
- China
- Japan
- India
- Australia
- South Korea
- Rest of Asia-Pacific
- Middle East & Africa
- GCC
- South Africa
- Rest of Middle East & Africa
- South America
- Brazil
- Argentina
- Rest of South America
- North America
Detailed Research Methodology and Data Validation
Primary Research
Analysts held structured interviews with process-development scientists at large pharma, operations heads at specialist CDMOs across North America, Europe, and Asia-Pacific, and regulators overseeing advanced-therapy reviews. Their insights refined bioreactor utilization rates, lot-release failure frequencies, and year-one versus steady-state average selling prices, closing data gaps left by public filings.
Desk Research
We began with open datasets such as the US FDA Biologics License Application database, EMA's Advanced Therapies guidelines, and WHO International Clinical Trials Registry, which clarify the approved pipeline and ensuing demand. Trade bodies, such as the Alliance for Regenerative Medicine, BioProcess International's annual capacity survey, and the International Society for Cell & Gene Therapy, provide capacity benchmarks and cost curves. Company 10-Ks, investor decks, and patent families (queried through Questel and USPTO bulk downloads) illustrate production yields, facility throughputs, and technology adoption. D&B Hoovers revenue splits help us benchmark CDMOs that publicly separate vector and plasmid lines. This desk list is illustrative; many other authoritative sources informed data collection, validation, and contextual framing.
Market-Sizing & Forecasting
The model starts with a top-down triangulation of treated-patient pools by therapy type, blended vector dose, and prevailing contract pricing to sketch annual demand, which is then cross-checked through a bottom-up sample of CDMO capacity roll-ups and reported plant utilizations.
1. the number of late-stage gene-therapy trials,
2. average vector doses per indication,
3. success-to-license probabilities,
4. manufacturing scale-up factors (200 L to 2,000 L single-use bioreactors), and
5. benchmark average selling prices per milligram of vector genomes or milligram of plasmid DNA.
A multivariate-regression overlay, anchoring capacity expansion announcements, venture funding flows, and regulatory approvals, generates five-year forecasts, while scenario analysis stress-tests supply-chain bottlenecks. Bottom-up gaps, for instance where private CDMOs withhold volumes, are filled using respondent-validated yield assumptions.
Data Validation & Update Cycle
Outputs pass sequential variance checks against historic growth ceilings, currency-conversion audits, and peer review by a second analyst. We refresh each model annually; mid-cycle we trigger a review when FDA or EMA approves a breakthrough therapy, a major facility comes online, or an input price index shifts sharply. A final pre-publication sweep ensures clients receive the most current view.
Why Mordor's Viral Vector And Plasmid DNA Manufacturing Baseline Is Dependable
Published market sizes vary because firms select different grade definitions, include or exclude research volumes, and apply divergent dose-per-patient or price trajectories.
By pinning scope strictly to cGMP therapeutic supply and reconciling capacity with treated-patient math, Mordor delivers a balanced baseline clients can retrace.
Benchmark comparison
| Market Size | Anonymized source | Primary gap driver |
|---|---|---|
| USD 2.31 B (2025) | Mordor Intelligence | - |
| USD 6.47 B (2024) | Global Consultancy A | Includes research-grade reagents and upstream equipment revenues |
| USD 4.26 B (2024) | Industry Association B | Uses list-price vectors without failure-rate or discount adjustments |
In sum, while others may broaden scope or overlook yield attrition, Mordor's disciplined variable selection, dual-path validation, and annual refresh cadence make our figures the most defensible foundation for strategic decisions.


Key Questions Answered in the Report
What is the projected size of the viral vectors and plasmid DNA manufacturing market in 2031?
The market is forecast to reach USD 9.43 billion by 2031, expanding at a 26.44% CAGR.
Which product category currently leads the market?
Viral vectors lead with 54.92% share in 2025, supported by regulatory familiarity and high gene-delivery efficiency.
Why is Asia-Pacific the fastest-growing region?
Cost-competitive manufacturing, government incentives, and rising therapeutic demand drive a 28.02% CAGR in Asia-Pacific.
What is the biggest bottleneck facing manufacturers today?
Limited global GMP capacity meets under 1% of projected demand, creating multi-year wait times for production slots.
How are companies addressing high manufacturing costs?
Firms invest in single-use systems, standardized platform processes, and outcome-based pricing models to reduce cost of goods.
Which application segment is expected to grow fastest through 2031?
Infectious disease applications are forecast to expand at a 29.58% CAGR as governments prepare for future pandemics.
Page last updated on:


